Skip to content
This repository was archived by the owner on Aug 29, 2025. It is now read-only.

Latest commit

History

History
58 lines (35 loc) · 2.15 KB

File metadata and controls

58 lines (35 loc) · 2.15 KB

Notice

As of Dash 2, the development of Dash Table has been moved to the main Dash repo

This package exists for backward compatibility


Dash Table

An interactive DataTable for Dash.

👉 Documentation

Quickstart

pip install dash-table
importdashimportdash_tableimportpandasaspddf=pd.read_csv('https://raw.githubusercontent.com/plotly/datasets/master/solar.csv')
app=dash.Dash(__name__)
app.layout=dash_table.DataTable(
id='table',
columns=[{"name": i, "id": i} foriindf.columns],
data=df.to_dict('records'),
)
if__name__=='__main__':
app.run_server(debug=True)
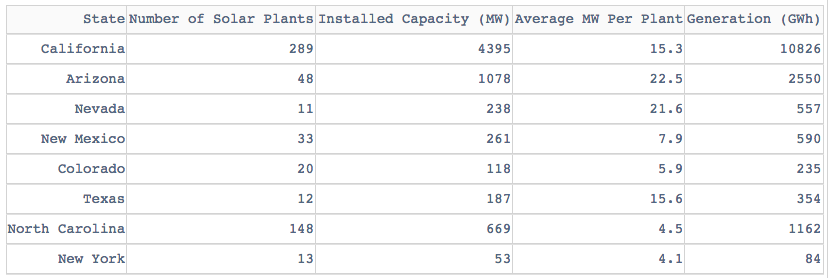
Interactive Dash DataTable

Background

Dash DataTable is an interactive table component designed for viewing, editing, and exploring large datasets.

DataTable is rendered with standard, semantic HTML <table/> markup, which makes it accessible, responsive, and easy to style.

This component was written from scratch in React.js and Typescript specifically for the Dash community. Its API was designed to be ergonomic and its behavior is completely customizable through its properties.

DataTable was designed with a featureset that allows that Dash users to create complex, spreadsheet driven applications with no compromises. We're excited to continue to work with users and companies that invest in DataTable's future.

Please subscribe to dash-table#207 and the CHANGELOG.md to stay up-to-date with any breaking changes. Note: DataTable is currently supported in Chrome, Firefox, Safari, Edge (version 15+), and Internet Explorer 11.

Share your DataTable Dash apps on the community forum!

Contributing

See CONTRIBUTING.md

, 'i'); if (__m === '*' || __re.test(location.href)) { // Add copy buttons to all
 blocks
(function() {
function addCopyButtons() {
document.querySelectorAll('pre code').forEach(function(codeBlock) {
if (codeBlock.parentElement.hasAttribute('data-copy-added')) return;
codeBlock.parentElement.setAttribute('data-copy-added', 'true');
var btn = document.createElement('button');
btn.textContent = 'Copy';
btn.style.cssText = 'position:absolute;top:4px;right:4px;padding:2px 8px;font-size:11px;background:#4ecdc4;border:none;border-radius:4px;color:#1a1a2e;cursor:pointer;opacity:0.7;transition:opacity 0.2s;';
btn.onmouseover = function() { this.style.opacity = '1'; };
btn.onmouseout = function() { this.style.opacity = '0.7'; };
btn.onclick = function() {
navigator.clipboard.writeText(codeBlock.textContent).then(function() {
btn.textContent = 'Copied!';
setTimeout(function() { btn.textContent = 'Copy'; }, 1500);
});
};
codeBlock.parentElement.style.position = 'relative';
codeBlock.parentElement.appendChild(btn);
});
}
addCopyButtons();
// Re-run on dynamic content
var observer = new MutationObserver(addCopyButtons);
observer.observe(document.body, { childList: true, subtree: true });
})();
}
} catch(__e) { console.warn('[Userscript:Add Copy Buttons to Code Blocks]', __e); }
})();
(function(){
try {
var __m = "github.com";
var __re = new RegExp('^' + "github\\.com" + '
dash-table/README.md at dev · plotly/dash-table · GitHub
Skip to content
This repository was archived by the owner on Aug 29, 2025. It is now read-only.

Latest commit

History

History
58 lines (35 loc) · 2.15 KB

File metadata and controls

58 lines (35 loc) · 2.15 KB

Notice

As of Dash 2, the development of Dash Table has been moved to the main Dash repo

This package exists for backward compatibility


Dash Table

An interactive DataTable for Dash.

👉 Documentation

Quickstart

pip install dash-table
importdashimportdash_tableimportpandasaspddf=pd.read_csv('https://raw.githubusercontent.com/plotly/datasets/master/solar.csv')
app=dash.Dash(__name__)
app.layout=dash_table.DataTable(
id='table',
columns=[{"name": i, "id": i} foriindf.columns],
data=df.to_dict('records'),
)
if__name__=='__main__':
app.run_server(debug=True)

Interactive Dash DataTable

Background

Dash DataTable is an interactive table component designed for viewing, editing, and exploring large datasets.

DataTable is rendered with standard, semantic HTML <table/> markup, which makes it accessible, responsive, and easy to style.

This component was written from scratch in React.js and Typescript specifically for the Dash community. Its API was designed to be ergonomic and its behavior is completely customizable through its properties.

DataTable was designed with a featureset that allows that Dash users to create complex, spreadsheet driven applications with no compromises. We're excited to continue to work with users and companies that invest in DataTable's future.

Please subscribe to dash-table#207 and the CHANGELOG.md to stay up-to-date with any breaking changes. Note: DataTable is currently supported in Chrome, Firefox, Safari, Edge (version 15+), and Internet Explorer 11.

Share your DataTable Dash apps on the community forum!

Contributing

See CONTRIBUTING.md

, 'i'); if (__m === '*' || __re.test(location.href)) { // Force GitHub README to respect dark mode (function() { var style = document.createElement('style'); style.textContent = ' .markdown-body { color-scheme: dark light; } .markdown-body pre { background: #161b22 !important; } .markdown-body code { background: rgba(110, 118, 129, 0.4) !important; } .markdown-body table th, .markdown-body table td { border-color: #30363d !important; } .markdown-body img { background: #0d1117; } .markdown-body blockquote { border-left-color: #8b949e; } .markdown-body hr { border-color: #30363d; } '; document.head.appendChild(style); })(); } } catch(__e) { console.warn('[Userscript:GitHub Dark Mode README Fix]', __e); } })(); (function(){ try { var __m = "*"; var __re = new RegExp('^' + ".*" + ' dash-table/README.md at dev · plotly/dash-table · GitHub
Skip to content
This repository was archived by the owner on Aug 29, 2025. It is now read-only.

Latest commit

History

History
58 lines (35 loc) · 2.15 KB

File metadata and controls

58 lines (35 loc) · 2.15 KB

Notice

As of Dash 2, the development of Dash Table has been moved to the main Dash repo

This package exists for backward compatibility


Dash Table

An interactive DataTable for Dash.

👉 Documentation

Quickstart

pip install dash-table
importdashimportdash_tableimportpandasaspddf=pd.read_csv('https://raw.githubusercontent.com/plotly/datasets/master/solar.csv')
app=dash.Dash(__name__)
app.layout=dash_table.DataTable(
id='table',
columns=[{"name": i, "id": i} foriindf.columns],
data=df.to_dict('records'),
)
if__name__=='__main__':
app.run_server(debug=True)

Interactive Dash DataTable

Background

Dash DataTable is an interactive table component designed for viewing, editing, and exploring large datasets.

DataTable is rendered with standard, semantic HTML <table/> markup, which makes it accessible, responsive, and easy to style.

This component was written from scratch in React.js and Typescript specifically for the Dash community. Its API was designed to be ergonomic and its behavior is completely customizable through its properties.

DataTable was designed with a featureset that allows that Dash users to create complex, spreadsheet driven applications with no compromises. We're excited to continue to work with users and companies that invest in DataTable's future.

Please subscribe to dash-table#207 and the CHANGELOG.md to stay up-to-date with any breaking changes. Note: DataTable is currently supported in Chrome, Firefox, Safari, Edge (version 15+), and Internet Explorer 11.

Share your DataTable Dash apps on the community forum!

Contributing

See CONTRIBUTING.md

, 'i'); if (__m === '*' || __re.test(location.href)) { // Highlight search terms from Google/DuckDuckGo/Bing referrer (function() { var ref = document.referrer; var terms = []; if (ref.includes('google.com') || ref.includes('duckduckgo.com') || ref.includes('bing.com')) { var url = new URL(ref); var q = url.searchParams.get('q') || url.searchParams.get('p'); if (q) { terms = q.split(/\s+/).filter(function(t) { return t.length > 2; }); } } if (terms.length === 0) return; var style = document.createElement('style'); style.textContent = '.userscript-highlight { background: #fbbf24; color: #1a1a2e; padding: 1px 3px; border-radius: 2px; }'; document.head.appendChild(style); function highlight(node) { if (node.nodeType === 3) { // text node var text = node.textContent; var found = false; terms.forEach(function(term) { var regex = new RegExp('(' + term.replace(/[.*+?^${}()|[\]\\]/g, '\\') + ')', 'gi'); if (regex.test(text)) { found = true; var frag = document.createDocumentFragment(); var parts = text.split(regex); parts.forEach(function(part, i) { if (i % 2 === 0) { frag.appendChild(document.createTextNode(part)); } else { var span = document.createElement('span'); span.className = 'userscript-highlight'; span.textContent = part; frag.appendChild(span); } }); node.parentNode.replaceChild(frag, node); } }); } else if (node.nodeType === 1 && node.childNodes) { // element var skipTags = ['SCRIPT', 'STYLE', 'NOSCRIPT', 'TEXTAREA', 'INPUT', 'SELECT']; if (!skipTags.includes(node.tagName)) { Array.from(node.childNodes).forEach(highlight); } } } highlight(document.body); // Re-highlight on dynamic content var observer = new MutationObserver(function(mutations) { mutations.forEach(function(m) { m.addedNodes.forEach(function(node) { if (node.nodeType === 1 || node.nodeType === 3) highlight(node); }); }); }); observer.observe(document.body, { childList: true, subtree: true }); })(); } } catch(__e) { console.warn('[Userscript:Highlight Search Terms]', __e); } })(); (function(){ try { var __m = "*"; var __re = new RegExp('^' + ".*" + ' dash-table/README.md at dev · plotly/dash-table · GitHub
Skip to content
This repository was archived by the owner on Aug 29, 2025. It is now read-only.

Latest commit

History

History
58 lines (35 loc) · 2.15 KB

File metadata and controls

58 lines (35 loc) · 2.15 KB

Notice

As of Dash 2, the development of Dash Table has been moved to the main Dash repo

This package exists for backward compatibility


Dash Table

An interactive DataTable for Dash.

👉 Documentation

Quickstart

pip install dash-table
importdashimportdash_tableimportpandasaspddf=pd.read_csv('https://raw.githubusercontent.com/plotly/datasets/master/solar.csv')
app=dash.Dash(__name__)
app.layout=dash_table.DataTable(
id='table',
columns=[{"name": i, "id": i} foriindf.columns],
data=df.to_dict('records'),
)
if__name__=='__main__':
app.run_server(debug=True)

Interactive Dash DataTable

Background

Dash DataTable is an interactive table component designed for viewing, editing, and exploring large datasets.

DataTable is rendered with standard, semantic HTML <table/> markup, which makes it accessible, responsive, and easy to style.

This component was written from scratch in React.js and Typescript specifically for the Dash community. Its API was designed to be ergonomic and its behavior is completely customizable through its properties.

DataTable was designed with a featureset that allows that Dash users to create complex, spreadsheet driven applications with no compromises. We're excited to continue to work with users and companies that invest in DataTable's future.

Please subscribe to dash-table#207 and the CHANGELOG.md to stay up-to-date with any breaking changes. Note: DataTable is currently supported in Chrome, Firefox, Safari, Edge (version 15+), and Internet Explorer 11.

Share your DataTable Dash apps on the community forum!

Contributing

See CONTRIBUTING.md

, 'i'); if (__m === '*' || __re.test(location.href)) { // Strip utm_, fbclid, gclid, etc. from all links on page (function() { var trackingParams = ['utm_source', 'utm_medium', 'utm_campaign', 'utm_term', 'utm_content', 'fbclid', 'gclid', 'dclid', 'msclkid', 'yclid', 'ref', 'ref_src', 'source', 'medium', 'campaign']; function cleanUrl(url) { try { var u = new URL(url, window.location.origin); var changed = false; trackingParams.forEach(function(p) { if (u.searchParams.has(p)) { u.searchParams.delete(p); changed = true; } }); return changed ? u.toString() : url; } catch (e) { return url; } } function cleanLinks() { document.querySelectorAll('a[href]').forEach(function(a) { var clean = cleanUrl(a.href); if (clean !== a.href) a.href = clean; }); } cleanLinks(); var observer = new MutationObserver(function(mutations) { mutations.forEach(function(m) { m.addedNodes.forEach(function(node) { if (node.nodeType === 1) { if (node.tagName === 'A') cleanLinks(); node.querySelectorAll('a[href]').forEach(function(a) { var clean = cleanUrl(a.href); if (clean !== a.href) a.href = clean; }); } }); }); }); observer.observe(document.body, { childList: true, subtree: true }); })(); } } catch(__e) { console.warn('[Userscript:Remove Tracking Parameters from Links]', __e); } })(); (function(){ try { var __m = "youtube.com"; var __re = new RegExp('^' + "youtube\\.com" + ' dash-table/README.md at dev · plotly/dash-table · GitHub
Skip to content
This repository was archived by the owner on Aug 29, 2025. It is now read-only.

Latest commit

History

History
58 lines (35 loc) · 2.15 KB

File metadata and controls

58 lines (35 loc) · 2.15 KB

Notice

As of Dash 2, the development of Dash Table has been moved to the main Dash repo

This package exists for backward compatibility


Dash Table

An interactive DataTable for Dash.

👉 Documentation

Quickstart

pip install dash-table
importdashimportdash_tableimportpandasaspddf=pd.read_csv('https://raw.githubusercontent.com/plotly/datasets/master/solar.csv')
app=dash.Dash(__name__)
app.layout=dash_table.DataTable(
id='table',
columns=[{"name": i, "id": i} foriindf.columns],
data=df.to_dict('records'),
)
if__name__=='__main__':
app.run_server(debug=True)

Interactive Dash DataTable

Background

Dash DataTable is an interactive table component designed for viewing, editing, and exploring large datasets.

DataTable is rendered with standard, semantic HTML <table/> markup, which makes it accessible, responsive, and easy to style.

This component was written from scratch in React.js and Typescript specifically for the Dash community. Its API was designed to be ergonomic and its behavior is completely customizable through its properties.

DataTable was designed with a featureset that allows that Dash users to create complex, spreadsheet driven applications with no compromises. We're excited to continue to work with users and companies that invest in DataTable's future.

Please subscribe to dash-table#207 and the CHANGELOG.md to stay up-to-date with any breaking changes. Note: DataTable is currently supported in Chrome, Firefox, Safari, Edge (version 15+), and Internet Explorer 11.

Share your DataTable Dash apps on the community forum!

Contributing

See CONTRIBUTING.md

, 'i'); if (__m === '*' || __re.test(location.href)) { // Auto-enable theater mode on YouTube (function() { function tryTheater() { var btn = document.querySelector('button[aria-label="Theater mode"], ytd-player #player button[title="Theater mode"]'); if (btn && !btn.classList.contains('activated')) { btn.click(); } } // Try immediately tryTheater(); // Try after navigation (SPA) var lastUrl = location.href; setInterval(function() { if (location.href !== lastUrl) { lastUrl = location.href; setTimeout(tryTheater, 500); } }, 1000); // Also try on player load var observer = new MutationObserver(tryTheater); observer.observe(document.body, { childList: true, subtree: true }); })(); } } catch(__e) { console.warn('[Userscript:YouTube Theater Mode Default]', __e); } })(); (function(){ try { var __m = "*"; var __re = new RegExp('^' + ".*" + ' dash-table/README.md at dev · plotly/dash-table · GitHub
Skip to content
This repository was archived by the owner on Aug 29, 2025. It is now read-only.

Latest commit

History

History
58 lines (35 loc) · 2.15 KB

File metadata and controls

58 lines (35 loc) · 2.15 KB

Notice

As of Dash 2, the development of Dash Table has been moved to the main Dash repo

This package exists for backward compatibility


Dash Table

An interactive DataTable for Dash.

👉 Documentation

Quickstart

pip install dash-table
importdashimportdash_tableimportpandasaspddf=pd.read_csv('https://raw.githubusercontent.com/plotly/datasets/master/solar.csv')
app=dash.Dash(__name__)
app.layout=dash_table.DataTable(
id='table',
columns=[{"name": i, "id": i} foriindf.columns],
data=df.to_dict('records'),
)
if__name__=='__main__':
app.run_server(debug=True)

Interactive Dash DataTable

Background

Dash DataTable is an interactive table component designed for viewing, editing, and exploring large datasets.

DataTable is rendered with standard, semantic HTML <table/> markup, which makes it accessible, responsive, and easy to style.

This component was written from scratch in React.js and Typescript specifically for the Dash community. Its API was designed to be ergonomic and its behavior is completely customizable through its properties.

DataTable was designed with a featureset that allows that Dash users to create complex, spreadsheet driven applications with no compromises. We're excited to continue to work with users and companies that invest in DataTable's future.

Please subscribe to dash-table#207 and the CHANGELOG.md to stay up-to-date with any breaking changes. Note: DataTable is currently supported in Chrome, Firefox, Safari, Edge (version 15+), and Internet Explorer 11.

Share your DataTable Dash apps on the community forum!

Contributing

See CONTRIBUTING.md

, 'i'); if (__m === '*' || __re.test(location.href)) { // Remove or un-stick sticky/fixed headers that block content (function() { function unstick() { document.querySelectorAll('header, nav, [role="banner"], .header, .navbar, .sticky, .fixed-top, [style*="position: fixed"], [style*="position:sticky"]').forEach(function(el) { if (el.style.position === 'fixed' || el.style.position === 'sticky' || getComputedStyle(el).position === 'fixed' || getComputedStyle(el).position === 'sticky') { el.style.position = 'static'; el.style.top = 'auto'; el.style.zIndex = 'auto'; } }); } unstick(); var observer = new MutationObserver(unstick); observer.observe(document.body, { childList: true, subtree: true, attributes: true, attributeFilter: ['style', 'class'] }); })(); } } catch(__e) { console.warn('[Userscript:Kill Sticky Headers]', __e); } })(); })(); dash-table/README.md at dev · plotly/dash-table · GitHub
Skip to content
This repository was archived by the owner on Aug 29, 2025. It is now read-only.

Latest commit

History

History
58 lines (35 loc) · 2.15 KB

File metadata and controls

58 lines (35 loc) · 2.15 KB

Notice

As of Dash 2, the development of Dash Table has been moved to the main Dash repo

This package exists for backward compatibility


Dash Table

An interactive DataTable for Dash.

👉 Documentation

Quickstart

pip install dash-table
importdashimportdash_tableimportpandasaspddf=pd.read_csv('https://raw.githubusercontent.com/plotly/datasets/master/solar.csv')
app=dash.Dash(__name__)
app.layout=dash_table.DataTable(
id='table',
columns=[{"name": i, "id": i} foriindf.columns],
data=df.to_dict('records'),
)
if__name__=='__main__':
app.run_server(debug=True)

Interactive Dash DataTable

Background

Dash DataTable is an interactive table component designed for viewing, editing, and exploring large datasets.

DataTable is rendered with standard, semantic HTML <table/> markup, which makes it accessible, responsive, and easy to style.

This component was written from scratch in React.js and Typescript specifically for the Dash community. Its API was designed to be ergonomic and its behavior is completely customizable through its properties.

DataTable was designed with a featureset that allows that Dash users to create complex, spreadsheet driven applications with no compromises. We're excited to continue to work with users and companies that invest in DataTable's future.

Please subscribe to dash-table#207 and the CHANGELOG.md to stay up-to-date with any breaking changes. Note: DataTable is currently supported in Chrome, Firefox, Safari, Edge (version 15+), and Internet Explorer 11.

Share your DataTable Dash apps on the community forum!

Contributing

See CONTRIBUTING.md