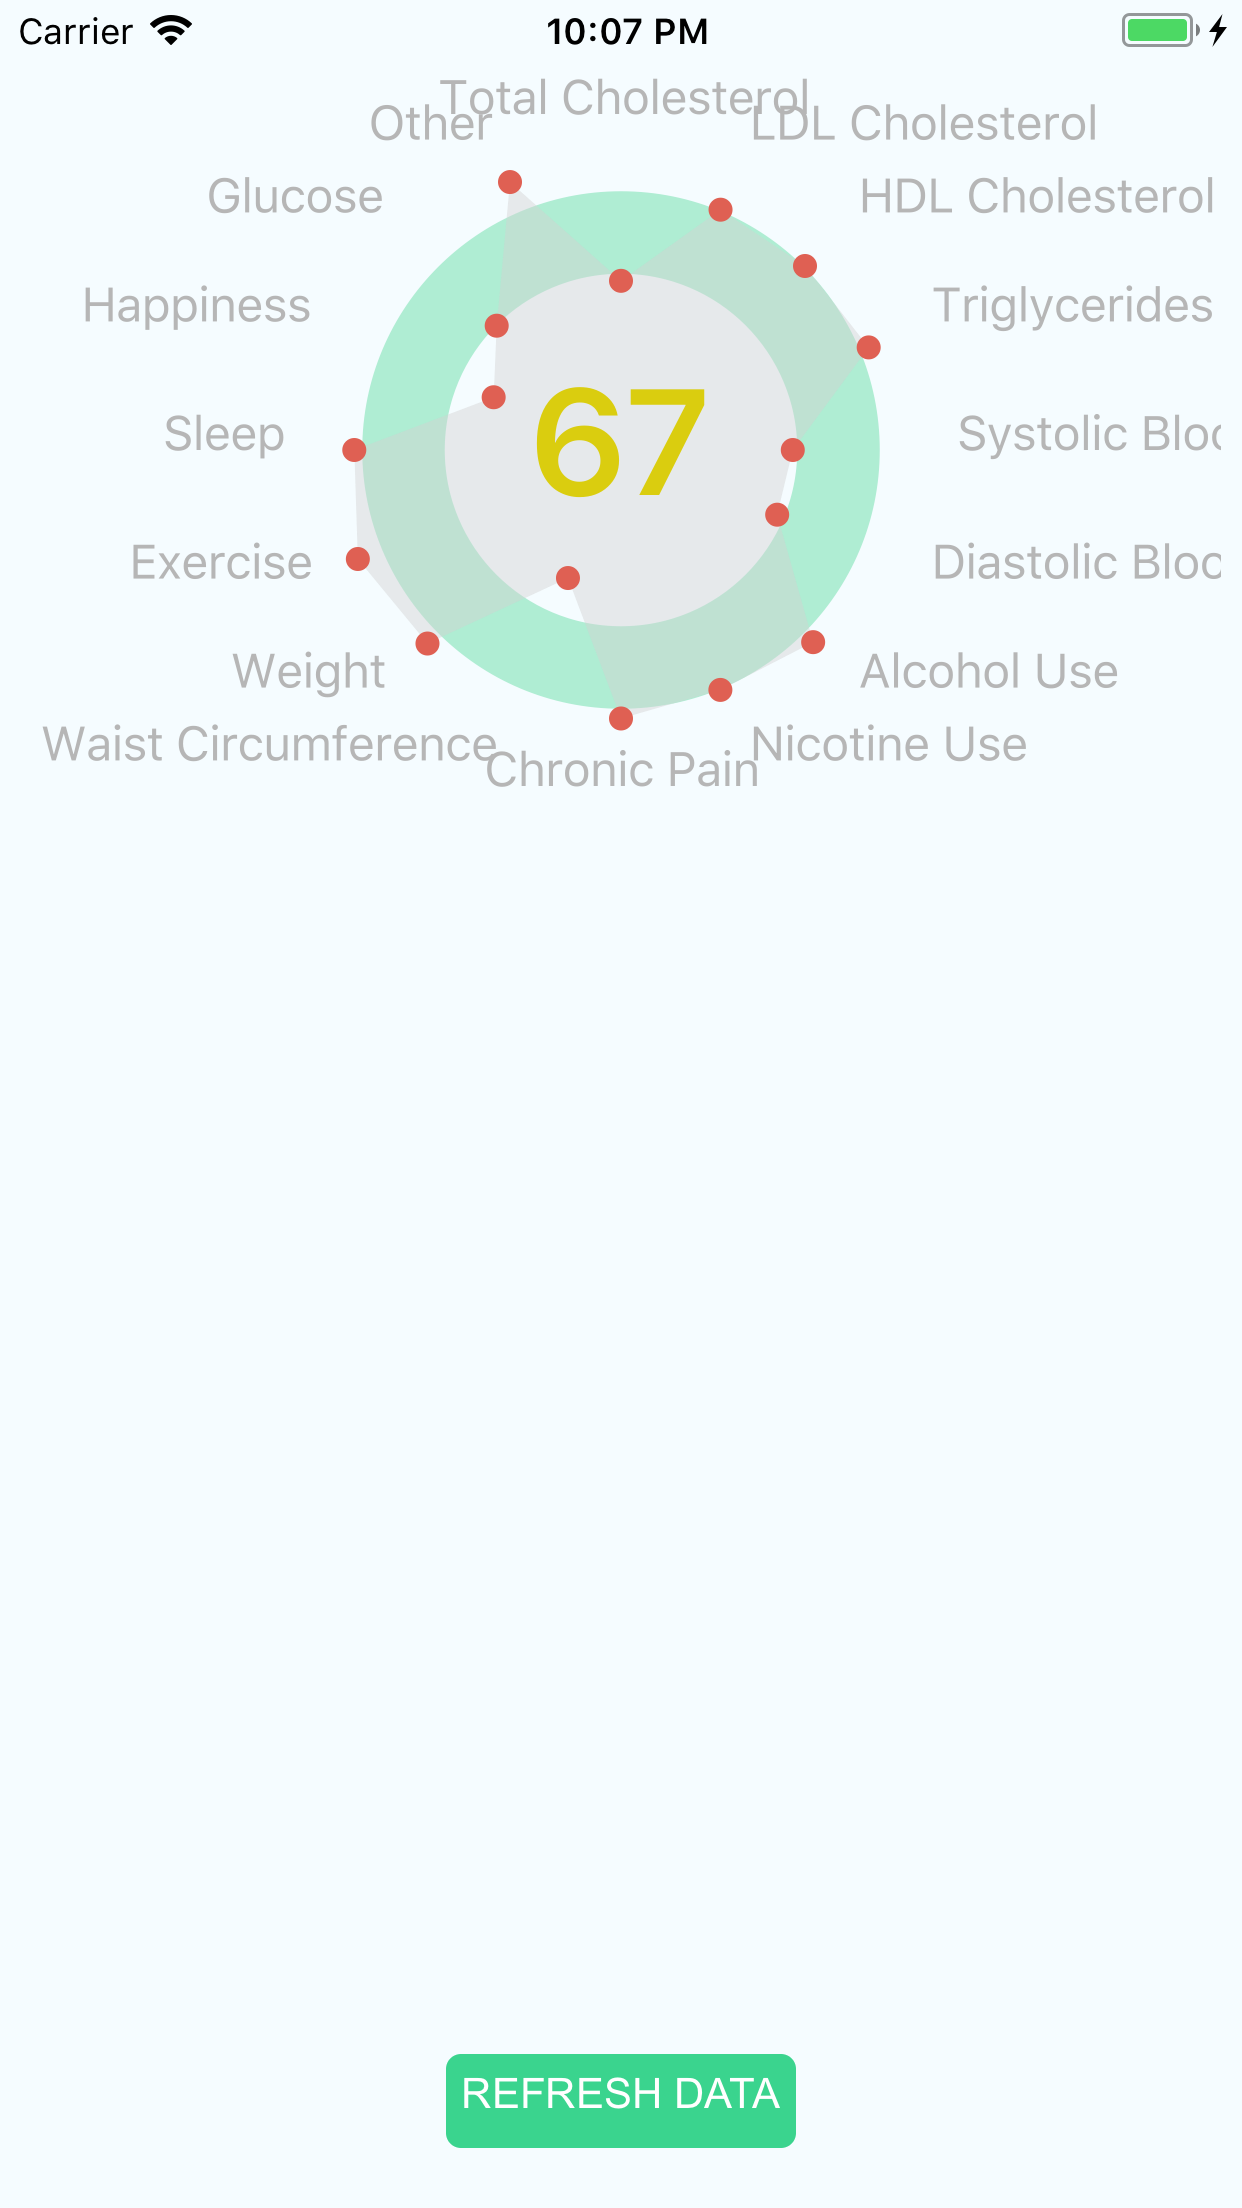




This is a React Native native implementation of the hGraph library. hGraph is a visual representation of a patient's health status, designed to increase awareness of the individual's factors that can affect one's overall health.
$ npm install react-native-hgraph --save
$ react-native link react-native-hgraph
You will still need to manually add the SVG package manually. Please follow the steps below.
Follow the steps bellow:
Add RNSVG.xcodeproj from <React Native Project>/node_modules/react-native-svg/iOS/ to your project
Link the libRNSVG.a library in the Linked Frameworks and Libraries in your Target -> General -> Linked Frameworks and Libraries
Follow the steps bellow:
- Import the react-native-hgraph module: Add the following lines to your settings.gradle file:
include ':react-native-svg' project(':react-native-svg').projectDir = new File(rootProject.projectDir, '../node_modules/react-native-svg/android') include ':react-native-hgraph' project(':react-native-hgraph').projectDir = new File(rootProject.projectDir, '../node_modules/react-native-hgraph/android')
- Add the compile line in your app gradle file:
implementation project(':react-native-svg') implementation project(':react-native-hgraph')
- Import RNReactNativeHgraphPackage and SvgPackage in the MainApplication.java file:
import io.citizenhealth.RNReactNativeHgraphPackage; import com.horcrux.svg.SvgPackage;
and add the new SvgPackage() and new RNReactNativeHgraphPackage() in your getPackages() function in MainApplication.java
protected List<ReactPackage> getPackages() { return Arrays.<ReactPackage>asList( new MainReactPackage(), new SvgPackage(), new RNReactNativeHgraphPackage() ); }
| Prop Name | Type | Is Required | Description | Default |
|---|---|---|---|---|
| data | array | true | An array of objects representing the metrics to display in hGraph (see below) | N/A |
| score | number | false | The overall score to display in the center of hGraph | N/A |
| width | number | false | The width in pixels hGraph should render at. | 600 |
| height | number | false | The height in pixels hGraph should render at. | 600 |
| margin | object | false | An object representing the values for margins around hGraph. | { top: 70, right: 100, bottom: 70, left: 100 } |
| thresholdMin | number | false | A number value between 0 and 1 (percentage), determining the position the lower threshold of the healthy range renders at. | .25 |
| thresholdMax | number | false | A number value between 0 and 1 (percentage), determining the position the upper threshold of the healthy range renders at. | .75 |
| donutHoleFactor | number | false | A number value between 0 and 1 (percentage), determining the amount of hGraph's radius that should be cut out forming the hole in the center of the graph. | .4 |
| pathColor | string (hex color code) | false | The color of the polygon shape. | "#d2d2d2" |
| color | string (hex color code) | false | The color of the points and polygon shape. | '#616363' |
| healthyRangeFillColor | string (hex color code) | false | The color of the healthy range band. | '#98bd8e' |
| fontSize | number | false | The size (in pixels) of the font for the labels. | 16 |
| fontColor | string (hex color code) | false | The color of the labels. | '#000' |
| showAxisLabel | boolean | false | Whether or not axis labels should display around hGraph. | true |
| axisLabelWrapWidth | number | false | The width (in pixels) that the labels should wrap text at. | 80 (Note: use null for no wrapping) |
| axisLabelOffset | number | false | The distance (in pixels) that axis labels should be offset from the outer bounds of hGraph's 'absolute max' radius. | 12 |
| areaOpacity | number | false | The opacity of the polygon shape. | 0.25 |
| pointRadius | number | false | The radius (in pixels) of the points for metric values. | 10 |
| pointLabelWrapWidth | number | false | The width (in pixels) that the point labels should wrap text at. | null (no wrapping) |
| pointLabelOffset | number | false | The distance (in pixels) that point labels should be offset from the point. | 8 |
| hitboxRadius | number | false | The radius (in pixels) of the point hitboxes. (hGraph overlays a transparent hitbox over each point which can help users accurately click/touch points, particularly on mobile devices.) | Defaults to props.pointRadius size. |
| showScore | boolean | false | Whether or not to display the overall score in the middle of hGraph. | true |
| scoreFontSize | number | false | The size (in pixels) of the font for the overall hGraph score | 120 |
| scoreFontColor | string (hex color code) | false | The color of the hGraph score. | '#000' |
| zoomFactor | number | false | The multiplier factor hGraph should zoom in. | 2.25 |
| zoomTransitionTime | number | false | The amount of time (in milliseconds) the zooming animation should take. | 750 |
| zoomOnPointClick | boolean | false | Configure if hGraph should zoom in/focus on a clicked point and display child points in the graph. | true |
| onPointClick | function | false | Callback function called when a point is clicked. Function is passed 2 arguments: the data object corresponding to the point clicked, and the event. | N/A |
| Name | Default | Type | Description | |
| ---------------- | ------------ | -------------- | -------------- |
importHGraph,{hGraphConvert,calculateHealthScore}from'react-native-hgraph';
...
consttotalCholesterolValue=(1-0)*Math.random();constldlValue=(300-0)*Math.random();consthdlValue=(150-0)*Math.random();consttriglyceridesValue=(300-0)*Math.random();constbloodPressureSystolicValue=(230-50)*Math.random();constbloodPressureDiastolicValue=(140-35)*Math.random();constalcoholUseValue=(20-0)*Math.random();constnicotineUseValue=(20-0)*Math.random();constpainLevelValue=(10-0)*Math.random();constwaistCircumferenceValue=(200-0)*Math.random();constweightValue=(400-50)*Math.random();constexerciseValue=(60-0)*Math.random();constsleepValue=(18-0)*Math.random();consthappinessValue=(10-0)*Math.random();constglucoseValue=(160-0)*Math.random();constotherValue=(1-0)*Math.random();consthealthData=[hGraphConvert('male','totalCholesterol',{id : 'totalCholesterol',"value" : totalCholesterolValue}),hGraphConvert('male','ldl',{id : 'ldl',"value" : ldlValue}),hGraphConvert('male','hdl',{id : 'hdl',"value" : hdlValue}),hGraphConvert('male','triglycerides',{id : 'triglycerides',"value" : triglyceridesValue}),hGraphConvert('male','bloodPressureSystolic',{id : 'bloodPressureSystolic',"value" : bloodPressureSystolicValue}),hGraphConvert('male','bloodPressureDiastolic',{id : 'bloodPressureDiastolic',"value" : bloodPressureDiastolicValue}),hGraphConvert('male','alcoholUse',{id : 'alcoholUse',"value" : alcoholUseValue}),hGraphConvert('male','nicotineUse',{id : 'nicotineUse',"value" : nicotineUseValue}),hGraphConvert('male','painLevel',{id : 'painLevel',"value" : painLevelValue}),hGraphConvert('male','waistCircumference',{id : 'waistCircumference',"value" : waistCircumferenceValue}),hGraphConvert('male','weight',{id : 'weight',"value" : weightValue}),hGraphConvert('male','exercise',{id : 'exercise',"value" : exerciseValue}),hGraphConvert('male','sleep',{id : 'sleep',"value" : sleepValue}),hGraphConvert('male','happiness',{id : 'happiness',"value" : happinessValue}),hGraphConvert('male','glucose',{id : 'glucose',"value" : glucoseValue}),hGraphConvert('male','other',{id : 'other',"value" : otherValue}),]consthealthScore=Math.floor(calculateHealthScore(healthData));
...
<HGraphwidth={200}height={200}score={98}margin={{top: 50,right: 100,bottom: 50,left: 100}}showAxisLabel={true}scoreFontSize={50}data={}/>