

A Leaflet plugin that allows to add elevation profiles using d3js
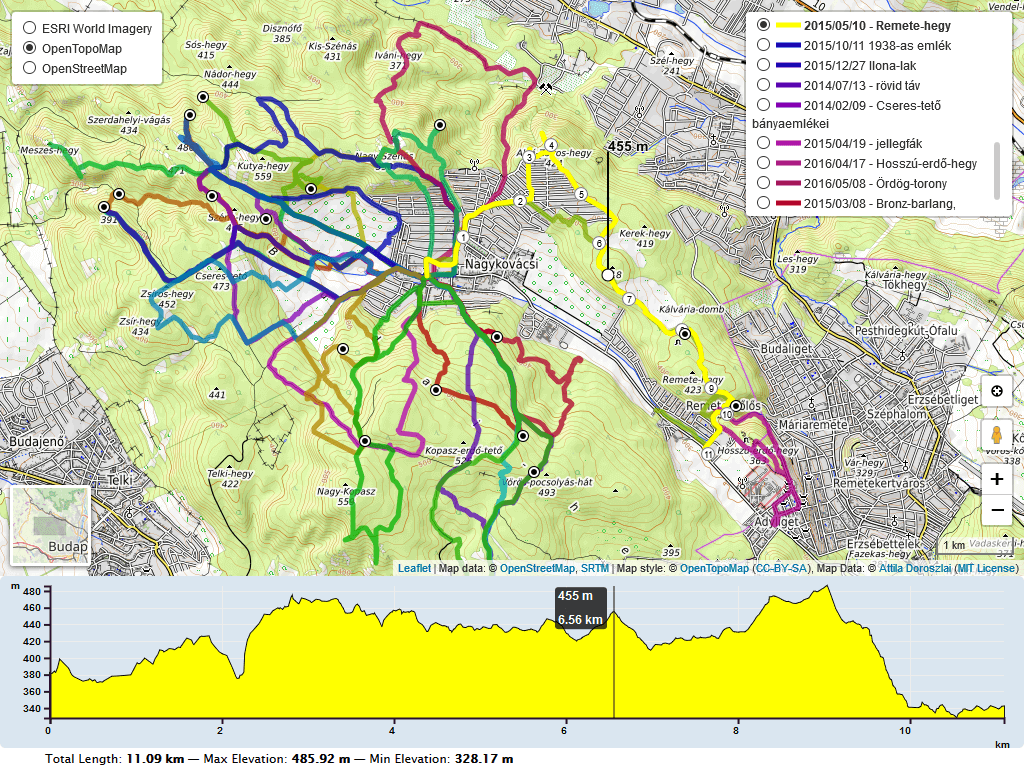
For a working example see one of the following demos:
- loading .gpx file
- loading .geojson file
- loading .kml file
- loading .tcx file
- loading a local .gpx file
- loading data from a textarea
- loading individual .geojson tracks
- loading individual .gpx tracks
- loading multiple .gpx tracks (hover to toggle)
- loading multiple .gpx tracks (click to toggle)
- loading multiple maps
- stacking multiple charts (elevation, slope, speed)
- translating plugin labels
- rotating chart labels
- using custom colors
- using .gpx extensions (cadence, heart, pace)
- using .gpx waypoint icons
- using .geojson waypoint icons
- autohide map
- autohide chart
- clear button
- collapsible button
- custom summary
- edge scale control
- follow marker
- layer almostover
- linear gradient
- slope chart
- speed chart
- temperature chart
- walking marker
Initially based on the work of Felix “MrMufflon” Bache
- include CSS & JavaScript
<head>
...
<style>html,body,#map,#elevation-div { height:100%; width:100%; padding:0; margin:0; } #map { height:75%; } #elevation-div {	height:25%; font:12px/1.5 "Helvetica Neue", Arial, Helvetica, sans-serif; } </style><!-- leaflet-ui --><scriptsrc="https://unpkg.com/leaflet@1.7.1/dist/leaflet.js"></script><scriptsrc="https://unpkg.com/leaflet-ui@0.6.0/dist/leaflet-ui.js"></script><!-- leaflet-elevation --><linkrel="stylesheet" href="https://unpkg.com/@raruto/leaflet-elevation/dist/leaflet-elevation.css" /><scriptsrc="https://unpkg.com/@raruto/leaflet-elevation/dist/leaflet-elevation.js"></script>
...
</head>
- choose the div container used for the slippy map
<body>
...
<divid="map"></div>
...
</body>
- create your first simple “leaflet-elevation” slippy map
<script>// Full list options at "leaflet-elevation.js"varelevation_options={// Default chart colors: theme lime-theme, magenta-theme, ...theme: "lightblue-theme",// Chart container outside/inside map containerdetached: true,// if (detached), the elevation chart containerelevationDiv: "#elevation-div",// if (!detached) autohide chart profile on chart mouseleaveautohide: false,// if (!detached) initial state of chart profile controlcollapsed: false,// if (!detached) control position on one of map cornersposition: "topright",// Toggle close icon visibilitycloseBtn: true,// Autoupdate map center on chart mouseover.followMarker: true,// Autoupdate map bounds on chart update.autofitBounds: true,// Chart distance/elevation units.imperial: false,// [Lat, Long] vs [Long, Lat] points. (leaflet default: [Lat, Long])reverseCoords: false,// Acceleration chart profile: true || "summary" || "disabled" || falseacceleration: false,// Slope chart profile: true || "summary" || "disabled" || falseslope: false,// Speed chart profile: true || "summary" || "disabled" || falsespeed: false,// Altitude chart profile: true || "summary" || "disabled" || falsealtitude: true,// Display time info: true || "summary" || falsetime: true,// Display distance info: true || "summary" || falsedistance: true,// Summary track info style: "inline" || "multiline" || falsesummary: 'multiline',// Download link: "link" || false || "modal"downloadLink: 'link',// Toggle chart ruler filterruler: true,// Toggle chart legend filterlegend: true,// Toggle "leaflet-almostover" integrationalmostOver: true,// Toggle "leaflet-distance-markers" integrationdistanceMarkers: false,// Toggle "leaflet-edgescale" integrationedgeScale: false,// Toggle "leaflet-hotline" integrationhotline: true,// Display track datetimes: true || falsetimestamps: false,// Display track waypoints: true || "markers" || "dots" || falsewaypoints: true,// Toggle custom waypoint icons: true || { associative array of <sym> tags } || falsewptIcons: {'': L.divIcon({className: 'elevation-waypoint-marker',html: '<i class="elevation-waypoint-icon"></i>',iconSize: [30,30],iconAnchor: [8,30],}),},// Toggle waypoint labels: true || "markers" || "dots" || falsewptLabels: true,// Render chart profiles as Canvas or SVG PathspreferCanvas: true,};// Instantiate map (leaflet-ui).varmap=L.map('map',{mapTypeId: 'terrain',center: [41.4583,12.7059],zoom: 5});// Instantiate elevation control.varcontrolElevation=L.control.elevation(elevation_options).addTo(map);// Load track from url (allowed data types: "*.geojson", "*.gpx", "*.tcx")controlElevation.load("https://raruto.github.io/leaflet-elevation/examples/via-emilia.gpx");</script>
Within your local development environment:
git clone git@github.com:Raruto/leaflet-elevation.git
cd ./leaflet-elevation
npm i # install dependencies
npm run dev # start dev server at: http://localhost:8080
npm run build # generate "dist" files (once)
npm run test# test all "*.spec.js" files (once)
After that you can start developing inside the src and test folders (eg. open "http://localhost:8080/test" in your browser to preview changes). Check also CONTRIBUTING.md file for some information about it.
1. How can I change the color of the elevation plot?
There are multiple options to achieve this:
- You could either use some default presets (see: theme: "lightblue-theme" option in readme file and the following file
leaflet-elevation.cssfor some other default "*-theme" names). - check out this example
- Or add the following lines for custom colors.
.elevation-control .area {
fill: red;
}
.elevation-control .background {
background-color: white;
2. How to enable/disable the leaflet user interface customizations?
These customizations are actually part of the leaflet-ui and can be toggled on/off using e.g. the following options:
varmap=L.map('map',{center: [41.4583,12.7059],// needs value to initializezoom: 5,// needs value to initializemapTypeId: 'topo',mapTypeIds: ['osm','terrain','satellite','topo'],gestureHandling: false,// zoom with Cmd + ScrollzoomControl: true,// plus minus buttonspegmanControl: false,locateControl: false,fullscreenControl: true,layersControl: true,minimapControl: false,editInOSMControl: false,loadingControl: false,searchControl: false,disableDefaultUI: false,printControl: false,});3. How can I import this library as ES module?
Usually, when working with a js bundler like Vite or Webpack, you need to provide to this library the full path to some dynamically imported files from the srcFolder:
import'./your-custom-style.css';import'leaflet/dist/leaflet.css';importLfrom'leaflet';import'@raruto/leaflet-elevation/src/index.js';import'@raruto/leaflet-elevation/src/index.css';constmap=L.map('map',{center: [41.4583,12.7059]zoom: 5,});constcontrolElevation=L.control.elevation({// CHANGE ME: with your own http server folder (eg. "http://custom-server/public/path/to/leaflet-elevation/src/")srcFolder: 'http://unpkg.com/@raruto/leaflet-elevation/src/'}).addTo(map);// Load track from url (allowed data types: "*.geojson", "*.gpx", "*.tcx")controlElevation.load("https://raruto.github.io/leaflet-elevation/examples/via-emilia.gpx");4. Some real world projects based on this plugin?
- https://parcours.scasb.org/
- https://velocat.ru/velo/phpBB3/map.php
- https://plugins.qgis.org/plugins/track_profile_2_web/
- https://wordpress.org/plugins/os-datahub-maps/
- https://wordpress.org/plugins/extensions-leaflet-map/
- https://github.com/der-stefan/OpenTopoMap
- https://gpx.n-peloton.fr/
- https://walkaholic.me/map
Related: Leaflet-UI presets, QGIS Integration
All notable changes to this project are documented in the releases page.
Compatibile with:



Contributors:MrMufflon, HostedDinner, ADoroszlai, Raruto
License: GPL-3.0+