A lightweight Node.js REPL debugger for Windows that spawns a PowerShell window and connects to your running process for live debugging.
- Windows-only debugger (uses PowerShell)
- Creates a separate REPL session connected to your Node.js process
- Lets you inspect variables, run commands, and evaluate code in real-time
- Provides a configurable default return value when no command is entered
- Automatically sets a custom PowerShell window title for your session
npm install windows-debuggerconstwindowsDebugger=require("windows-debugger");// Start a debugger sessionwindowsDebugger({title: "MyApp Debugger",default: "Nothing entered",eval: (code)=>eval(code)});When called, this will:
- Start a local TCP REPL server.
- Launch a new PowerShell window with the given title.
- Connect the REPL to your running Node.js process.
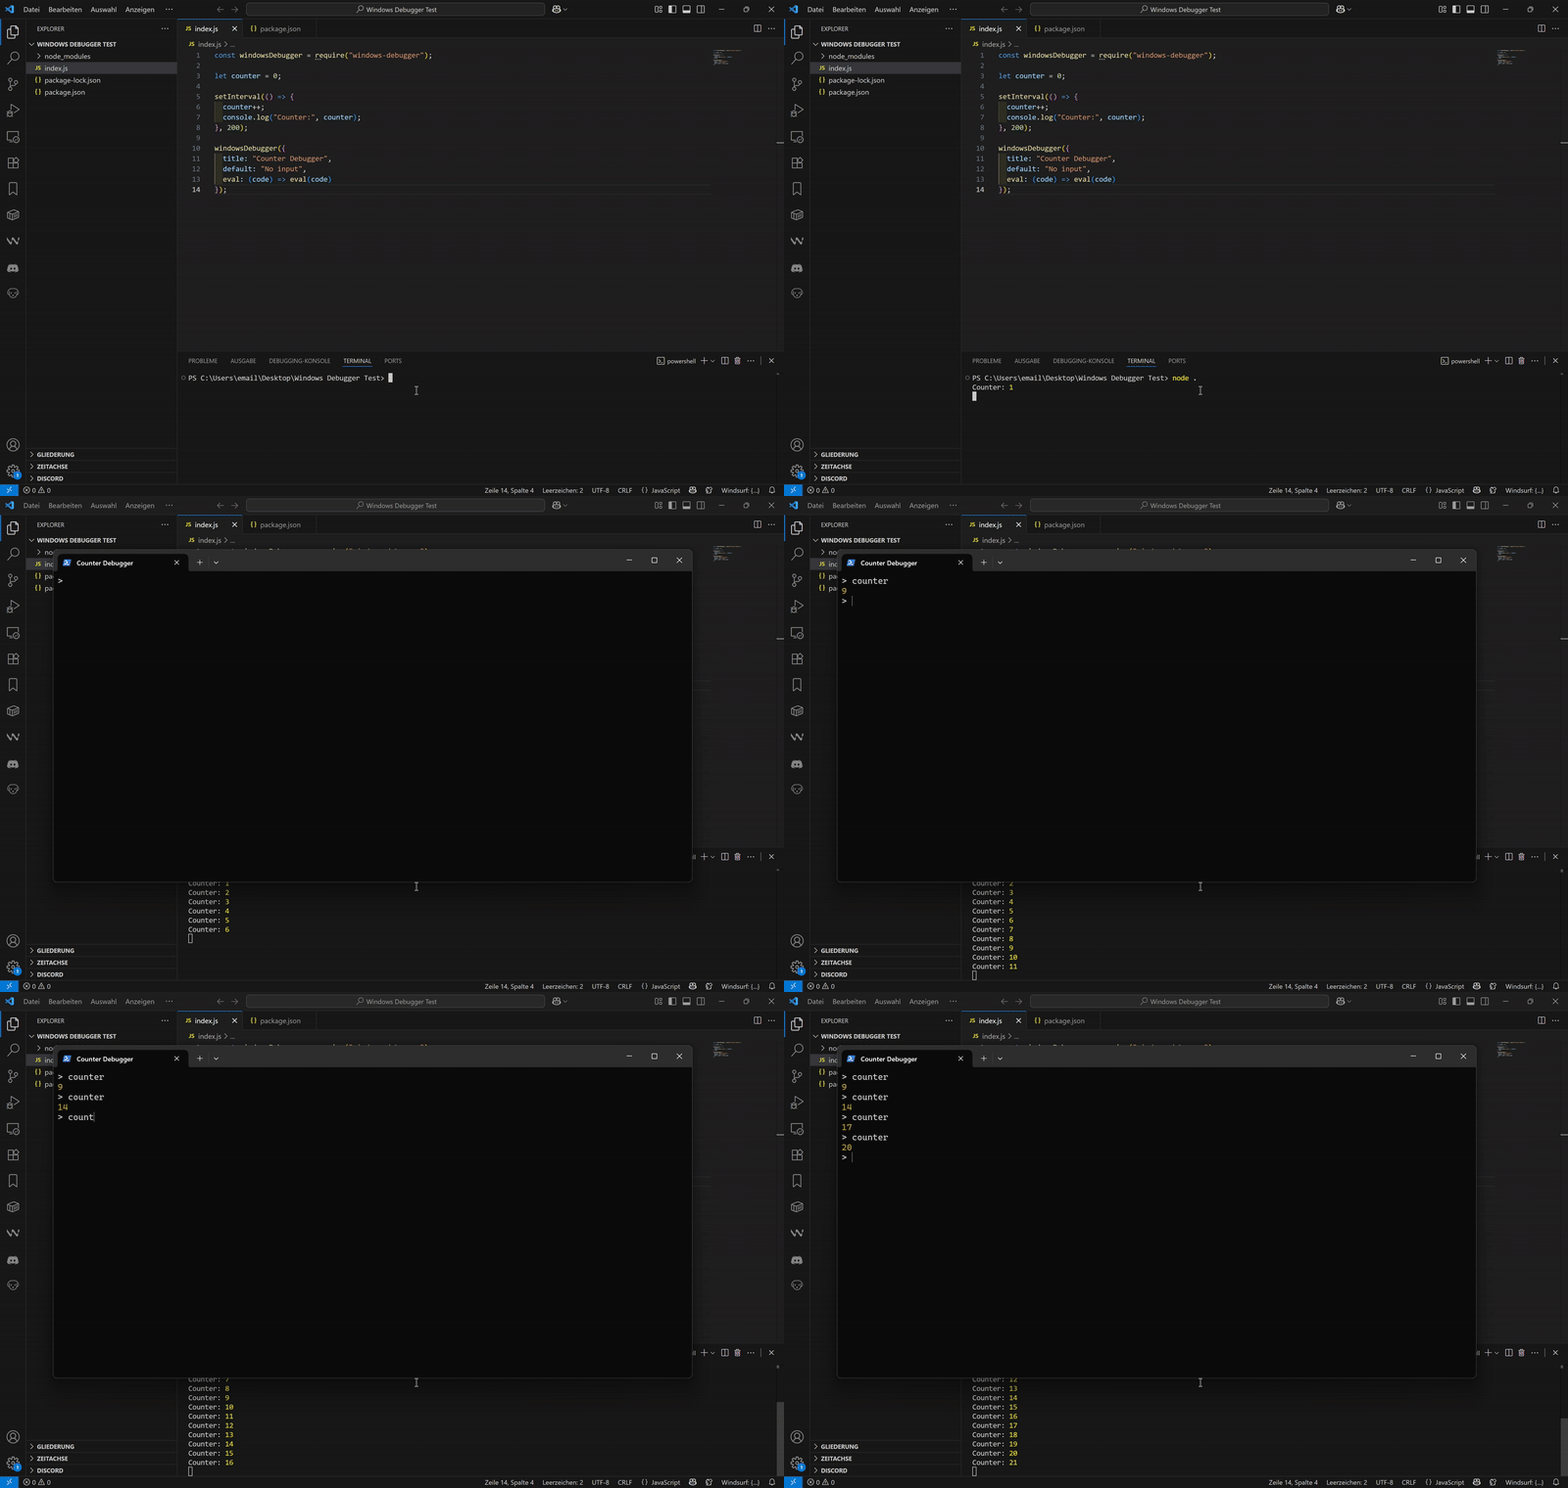
constwindowsDebugger=require("windows-debugger");letcounter=0;setInterval(()=>{counter++;console.log("Counter:",counter);},2000);windowsDebugger({title: "Counter Debugger",default: "No input",eval: (code)=>eval(code)});A new PowerShell window will open with the title
Counter Debugger.Inside the window, you can type:
counterAnd see the live value of the
countervariable.
- Windows only (
process.platform === "win32"is enforced) - Requires PowerShell installed and accessible via
powershell.exe - Works with Node.js v14+ (earlier versions untested)
| Option | Type | Description |
|---|---|---|
title | string | The window title for the PowerShell debugger session. |
default | any | The default return value when pressing enter without typing a command. |
eval | Function | An eval function used to evaluate REPL input. |
password | string | If not provided, a random one-time UUID is generated automatically. |
- All REPL errors are caught and displayed in the PowerShell session.
- Domain errors are suppressed to avoid crashing the main process.
MIT