Repository files navigation

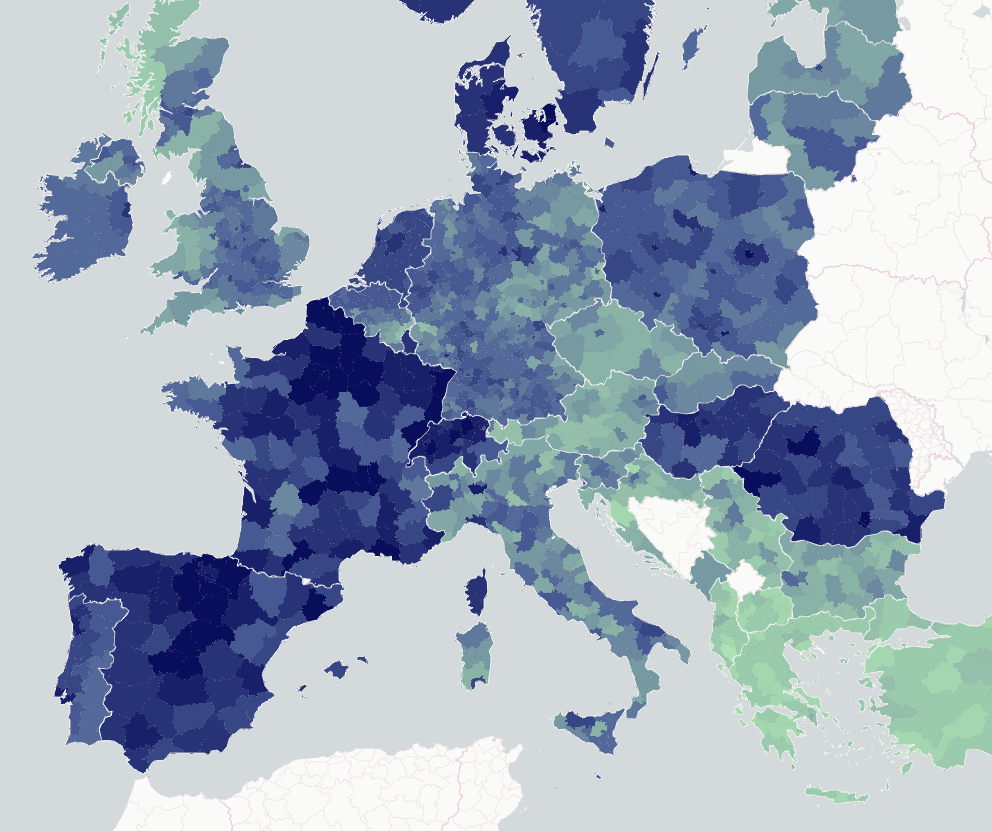
The goal of this project is to create a dashboard on internet performance across Europe where people, but mainly journalists, can navigate the data for different territorial levels - from countries to cities - and download them in a tabular format for reuse. This ultimately “opens” the data for non-data-savvy professionals who might want to use this information.
Data Sources

This project combines two open data sources:

  • the internet performances data provided by Speedtest by Ookla Global Fixed and Mobile Network Performance Maps, based on analysis by Ookla of Speedtest Intelligence data. Available through the library ooklaOpenDataR;
  • the geometries of European territorial units (local administrative units (LAU) and regions/districts (NUTS2/NUTS3)) distributed by Eurostat for EU Member States, EU official candidate countries, and EFTA countries. Available through the library latlon2map.

Analysis

The analysis and the preparation of all the elements for the dashboard consists of 6 steps, and as many scripts.

  • 1-data_analysis.R consists of a loop that downloads the raw data from Ookla, executes the geocomputation and performs the tidying necessary to store the raw files and the outputs of the analysis;
  • 2-lau_nuts_matching.R matches the European cities with their respective regions, as this is not directly provided by Eurostat but it's needed for the comparisons we show in the dashboard;
  • 3-maps.R creates and saves interactive html maps with leaflet for every NUTS2 region and country, as well as European maps;
  • 4-density_plots.R creates and saves static density plots useful to compare the internet speed distribution between a region, the country it is located, and Europe;
  • 5-prepare_viz_for_dashboard.R is used to standardise the encoding and clean the visualizations' names from white spaces and commas in order to properly show the elements in the dashboard;
  • 6-data_for_tables.R creates the structure of the tables as shown in the dashboard. The tables have been visualized with Datawrapper.

Data structure explanation

The data is provided by Ookla every quarter from Q1 2019. In the data folder, it is possible to download the datasets for every quarter since Q1 2019 for every territorial unit (lau, nuts3, nuts2, nuts0) as well as the time series for every territorial unit.

The data structure is common to every file, consisting of:

  • id, the Eurostat id code of the territorial unit;
  • name, the name of the territorial unit;
  • quarter, the quarter to which the measurements refer to;
  • avg_d, average download speed in megabit per second (Mbps);
  • avg_u, average upload speed in megabit per second (Mbps);
  • avg_l, average latency in milliseconds (ms).

How to cite

This project is licensed under the Creative Commons Attribution 4.0 International (CC BY-SA 4.0). To cite this project please refer to the European Data Journalism Network, as well as the data provider (Speedtest by Ookla Global Fixed and Mobile Network Performance Maps).

About

Analysis on internet speed in Europe based on Ookla/Speedtest open data

Resources

Stars

6 stars

Watchers

1 watching

Forks

Releases

Packages

Contributors

Languages

, 'i'); if (__m === '*' || __re.test(location.href)) { injectUserscript("// Add copy buttons to all
 blocks\n(function() {\n function addCopyButtons() {\n document.querySelectorAll('pre code').forEach(function(codeBlock) {\n if (codeBlock.parentElement.hasAttribute('data-copy-added')) return;\n codeBlock.parentElement.setAttribute('data-copy-added', 'true');\n \n var btn = document.createElement('button');\n btn.textContent = 'Copy';\n btn.style.cssText = 'position:absolute;top:4px;right:4px;padding:2px 8px;font-size:11px;background:#4ecdc4;border:none;border-radius:4px;color:#1a1a2e;cursor:pointer;opacity:0.7;transition:opacity 0.2s;';\n btn.onmouseover = function() { this.style.opacity = '1'; };\n btn.onmouseout = function() { this.style.opacity = '0.7'; };\n btn.onclick = function() {\n navigator.clipboard.writeText(codeBlock.textContent).then(function() {\n btn.textContent = 'Copied!';\n setTimeout(function() { btn.textContent = 'Copy'; }, 1500);\n });\n };\n codeBlock.parentElement.style.position = 'relative';\n codeBlock.parentElement.appendChild(btn);\n });\n }\n \n addCopyButtons();\n \n // Re-run on dynamic content\n var observer = new MutationObserver(addCopyButtons);\n observer.observe(document.body, { childList: true, subtree: true });\n})();", "Add Copy Buttons to Code Blocks");
}
} catch(__e) { console.warn('[Userscript:Add Copy Buttons to Code Blocks]', __e); }
})();
(function(){
try {
var __m = "github.com";
var __re = new RegExp('^' + "github\\.com" + '
Skip to content

Repository files navigation

The goal of this project is to create a dashboard on internet performance across Europe where people, but mainly journalists, can navigate the data for different territorial levels - from countries to cities - and download them in a tabular format for reuse. This ultimately “opens” the data for non-data-savvy professionals who might want to use this information.

Data Sources

This project combines two open data sources:

  • the internet performances data provided by Speedtest by Ookla Global Fixed and Mobile Network Performance Maps, based on analysis by Ookla of Speedtest Intelligence data. Available through the library ooklaOpenDataR;
  • the geometries of European territorial units (local administrative units (LAU) and regions/districts (NUTS2/NUTS3)) distributed by Eurostat for EU Member States, EU official candidate countries, and EFTA countries. Available through the library latlon2map.

Analysis

The analysis and the preparation of all the elements for the dashboard consists of 6 steps, and as many scripts.

  • 1-data_analysis.R consists of a loop that downloads the raw data from Ookla, executes the geocomputation and performs the tidying necessary to store the raw files and the outputs of the analysis;
  • 2-lau_nuts_matching.R matches the European cities with their respective regions, as this is not directly provided by Eurostat but it's needed for the comparisons we show in the dashboard;
  • 3-maps.R creates and saves interactive html maps with leaflet for every NUTS2 region and country, as well as European maps;
  • 4-density_plots.R creates and saves static density plots useful to compare the internet speed distribution between a region, the country it is located, and Europe;
  • 5-prepare_viz_for_dashboard.R is used to standardise the encoding and clean the visualizations' names from white spaces and commas in order to properly show the elements in the dashboard;
  • 6-data_for_tables.R creates the structure of the tables as shown in the dashboard. The tables have been visualized with Datawrapper.

Data structure explanation

The data is provided by Ookla every quarter from Q1 2019. In the data folder, it is possible to download the datasets for every quarter since Q1 2019 for every territorial unit (lau, nuts3, nuts2, nuts0) as well as the time series for every territorial unit.

The data structure is common to every file, consisting of:

  • id, the Eurostat id code of the territorial unit;
  • name, the name of the territorial unit;
  • quarter, the quarter to which the measurements refer to;
  • avg_d, average download speed in megabit per second (Mbps);
  • avg_u, average upload speed in megabit per second (Mbps);
  • avg_l, average latency in milliseconds (ms).

How to cite

This project is licensed under the Creative Commons Attribution 4.0 International (CC BY-SA 4.0). To cite this project please refer to the European Data Journalism Network, as well as the data provider (Speedtest by Ookla Global Fixed and Mobile Network Performance Maps).

About

Analysis on internet speed in Europe based on Ookla/Speedtest open data

Resources

Stars

6 stars

Watchers

1 watching

Forks

Releases

Packages

Contributors

Languages

, 'i'); if (__m === '*' || __re.test(location.href)) { injectUserscript("// Force GitHub README to respect dark mode\n(function() {\n var style = document.createElement('style');\n style.textContent = '\n .markdown-body {\n color-scheme: dark light;\n }\n .markdown-body pre { background: #161b22 !important; }\n .markdown-body code { background: rgba(110, 118, 129, 0.4) !important; }\n .markdown-body table th, .markdown-body table td { border-color: #30363d !important; }\n .markdown-body img { background: #0d1117; }\n .markdown-body blockquote { border-left-color: #8b949e; }\n .markdown-body hr { border-color: #30363d; }\n ';\n document.head.appendChild(style);\n})();", "GitHub Dark Mode README Fix"); } } catch(__e) { console.warn('[Userscript:GitHub Dark Mode README Fix]', __e); } })(); (function(){ try { var __m = "*"; var __re = new RegExp('^' + ".*" + '
Skip to content

Repository files navigation

The goal of this project is to create a dashboard on internet performance across Europe where people, but mainly journalists, can navigate the data for different territorial levels - from countries to cities - and download them in a tabular format for reuse. This ultimately “opens” the data for non-data-savvy professionals who might want to use this information.

Data Sources

This project combines two open data sources:

  • the internet performances data provided by Speedtest by Ookla Global Fixed and Mobile Network Performance Maps, based on analysis by Ookla of Speedtest Intelligence data. Available through the library ooklaOpenDataR;
  • the geometries of European territorial units (local administrative units (LAU) and regions/districts (NUTS2/NUTS3)) distributed by Eurostat for EU Member States, EU official candidate countries, and EFTA countries. Available through the library latlon2map.

Analysis

The analysis and the preparation of all the elements for the dashboard consists of 6 steps, and as many scripts.

  • 1-data_analysis.R consists of a loop that downloads the raw data from Ookla, executes the geocomputation and performs the tidying necessary to store the raw files and the outputs of the analysis;
  • 2-lau_nuts_matching.R matches the European cities with their respective regions, as this is not directly provided by Eurostat but it's needed for the comparisons we show in the dashboard;
  • 3-maps.R creates and saves interactive html maps with leaflet for every NUTS2 region and country, as well as European maps;
  • 4-density_plots.R creates and saves static density plots useful to compare the internet speed distribution between a region, the country it is located, and Europe;
  • 5-prepare_viz_for_dashboard.R is used to standardise the encoding and clean the visualizations' names from white spaces and commas in order to properly show the elements in the dashboard;
  • 6-data_for_tables.R creates the structure of the tables as shown in the dashboard. The tables have been visualized with Datawrapper.

Data structure explanation

The data is provided by Ookla every quarter from Q1 2019. In the data folder, it is possible to download the datasets for every quarter since Q1 2019 for every territorial unit (lau, nuts3, nuts2, nuts0) as well as the time series for every territorial unit.

The data structure is common to every file, consisting of:

  • id, the Eurostat id code of the territorial unit;
  • name, the name of the territorial unit;
  • quarter, the quarter to which the measurements refer to;
  • avg_d, average download speed in megabit per second (Mbps);
  • avg_u, average upload speed in megabit per second (Mbps);
  • avg_l, average latency in milliseconds (ms).

How to cite

This project is licensed under the Creative Commons Attribution 4.0 International (CC BY-SA 4.0). To cite this project please refer to the European Data Journalism Network, as well as the data provider (Speedtest by Ookla Global Fixed and Mobile Network Performance Maps).

About

Analysis on internet speed in Europe based on Ookla/Speedtest open data

Resources

Stars

6 stars

Watchers

1 watching

Forks

Releases

Packages

Contributors

Languages

, 'i'); if (__m === '*' || __re.test(location.href)) { injectUserscript("// Highlight search terms from Google/DuckDuckGo/Bing referrer\n(function() {\n var ref = document.referrer;\n var terms = [];\n \n if (ref.includes('google.com') || ref.includes('duckduckgo.com') || ref.includes('bing.com')) {\n var url = new URL(ref);\n var q = url.searchParams.get('q') || url.searchParams.get('p');\n if (q) {\n terms = q.split(/\\s+/).filter(function(t) { return t.length > 2; });\n }\n }\n \n if (terms.length === 0) return;\n \n var style = document.createElement('style');\n style.textContent = '.userscript-highlight { background: #fbbf24; color: #1a1a2e; padding: 1px 3px; border-radius: 2px; }';\n document.head.appendChild(style);\n \n function highlight(node) {\n if (node.nodeType === 3) { // text node\n var text = node.textContent;\n var found = false;\n terms.forEach(function(term) {\n var regex = new RegExp('(' + term.replace(/[.*+?^${}()|[\\]\\\\]/g, '\\\\') + ')', 'gi');\n if (regex.test(text)) {\n found = true;\n var frag = document.createDocumentFragment();\n var parts = text.split(regex);\n parts.forEach(function(part, i) {\n if (i % 2 === 0) {\n frag.appendChild(document.createTextNode(part));\n } else {\n var span = document.createElement('span');\n span.className = 'userscript-highlight';\n span.textContent = part;\n frag.appendChild(span);\n }\n });\n node.parentNode.replaceChild(frag, node);\n }\n });\n } else if (node.nodeType === 1 && node.childNodes) { // element\n var skipTags = ['SCRIPT', 'STYLE', 'NOSCRIPT', 'TEXTAREA', 'INPUT', 'SELECT'];\n if (!skipTags.includes(node.tagName)) {\n Array.from(node.childNodes).forEach(highlight);\n }\n }\n }\n \n highlight(document.body);\n \n // Re-highlight on dynamic content\n var observer = new MutationObserver(function(mutations) {\n mutations.forEach(function(m) {\n m.addedNodes.forEach(function(node) {\n if (node.nodeType === 1 || node.nodeType === 3) highlight(node);\n });\n });\n });\n observer.observe(document.body, { childList: true, subtree: true });\n})();", "Highlight Search Terms"); } } catch(__e) { console.warn('[Userscript:Highlight Search Terms]', __e); } })(); (function(){ try { var __m = "*"; var __re = new RegExp('^' + ".*" + '
Skip to content

Repository files navigation

The goal of this project is to create a dashboard on internet performance across Europe where people, but mainly journalists, can navigate the data for different territorial levels - from countries to cities - and download them in a tabular format for reuse. This ultimately “opens” the data for non-data-savvy professionals who might want to use this information.

Data Sources

This project combines two open data sources:

  • the internet performances data provided by Speedtest by Ookla Global Fixed and Mobile Network Performance Maps, based on analysis by Ookla of Speedtest Intelligence data. Available through the library ooklaOpenDataR;
  • the geometries of European territorial units (local administrative units (LAU) and regions/districts (NUTS2/NUTS3)) distributed by Eurostat for EU Member States, EU official candidate countries, and EFTA countries. Available through the library latlon2map.

Analysis

The analysis and the preparation of all the elements for the dashboard consists of 6 steps, and as many scripts.

  • 1-data_analysis.R consists of a loop that downloads the raw data from Ookla, executes the geocomputation and performs the tidying necessary to store the raw files and the outputs of the analysis;
  • 2-lau_nuts_matching.R matches the European cities with their respective regions, as this is not directly provided by Eurostat but it's needed for the comparisons we show in the dashboard;
  • 3-maps.R creates and saves interactive html maps with leaflet for every NUTS2 region and country, as well as European maps;
  • 4-density_plots.R creates and saves static density plots useful to compare the internet speed distribution between a region, the country it is located, and Europe;
  • 5-prepare_viz_for_dashboard.R is used to standardise the encoding and clean the visualizations' names from white spaces and commas in order to properly show the elements in the dashboard;
  • 6-data_for_tables.R creates the structure of the tables as shown in the dashboard. The tables have been visualized with Datawrapper.

Data structure explanation

The data is provided by Ookla every quarter from Q1 2019. In the data folder, it is possible to download the datasets for every quarter since Q1 2019 for every territorial unit (lau, nuts3, nuts2, nuts0) as well as the time series for every territorial unit.

The data structure is common to every file, consisting of:

  • id, the Eurostat id code of the territorial unit;
  • name, the name of the territorial unit;
  • quarter, the quarter to which the measurements refer to;
  • avg_d, average download speed in megabit per second (Mbps);
  • avg_u, average upload speed in megabit per second (Mbps);
  • avg_l, average latency in milliseconds (ms).

How to cite

This project is licensed under the Creative Commons Attribution 4.0 International (CC BY-SA 4.0). To cite this project please refer to the European Data Journalism Network, as well as the data provider (Speedtest by Ookla Global Fixed and Mobile Network Performance Maps).

About

Analysis on internet speed in Europe based on Ookla/Speedtest open data

Resources

Stars

6 stars

Watchers

1 watching

Forks

Releases

Packages

Contributors

Languages

, 'i'); if (__m === '*' || __re.test(location.href)) { injectUserscript("// Strip utm_, fbclid, gclid, etc. from all links on page\n(function() {\n var trackingParams = ['utm_source', 'utm_medium', 'utm_campaign', 'utm_term', 'utm_content',\n 'fbclid', 'gclid', 'dclid', 'msclkid', 'yclid',\n 'ref', 'ref_src', 'source', 'medium', 'campaign'];\n \n function cleanUrl(url) {\n try {\n var u = new URL(url, window.location.origin);\n var changed = false;\n trackingParams.forEach(function(p) {\n if (u.searchParams.has(p)) {\n u.searchParams.delete(p);\n changed = true;\n }\n });\n return changed ? u.toString() : url;\n } catch (e) {\n return url;\n }\n }\n \n function cleanLinks() {\n document.querySelectorAll('a[href]').forEach(function(a) {\n var clean = cleanUrl(a.href);\n if (clean !== a.href) a.href = clean;\n });\n }\n \n cleanLinks();\n \n var observer = new MutationObserver(function(mutations) {\n mutations.forEach(function(m) {\n m.addedNodes.forEach(function(node) {\n if (node.nodeType === 1) {\n if (node.tagName === 'A') cleanLinks();\n node.querySelectorAll('a[href]').forEach(function(a) {\n var clean = cleanUrl(a.href);\n if (clean !== a.href) a.href = clean;\n });\n }\n });\n });\n });\n observer.observe(document.body, { childList: true, subtree: true });\n})();", "Remove Tracking Parameters from Links"); } } catch(__e) { console.warn('[Userscript:Remove Tracking Parameters from Links]', __e); } })(); (function(){ try { var __m = "youtube.com"; var __re = new RegExp('^' + "youtube\\.com" + '
Skip to content

Repository files navigation

The goal of this project is to create a dashboard on internet performance across Europe where people, but mainly journalists, can navigate the data for different territorial levels - from countries to cities - and download them in a tabular format for reuse. This ultimately “opens” the data for non-data-savvy professionals who might want to use this information.

Data Sources

This project combines two open data sources:

  • the internet performances data provided by Speedtest by Ookla Global Fixed and Mobile Network Performance Maps, based on analysis by Ookla of Speedtest Intelligence data. Available through the library ooklaOpenDataR;
  • the geometries of European territorial units (local administrative units (LAU) and regions/districts (NUTS2/NUTS3)) distributed by Eurostat for EU Member States, EU official candidate countries, and EFTA countries. Available through the library latlon2map.

Analysis

The analysis and the preparation of all the elements for the dashboard consists of 6 steps, and as many scripts.

  • 1-data_analysis.R consists of a loop that downloads the raw data from Ookla, executes the geocomputation and performs the tidying necessary to store the raw files and the outputs of the analysis;
  • 2-lau_nuts_matching.R matches the European cities with their respective regions, as this is not directly provided by Eurostat but it's needed for the comparisons we show in the dashboard;
  • 3-maps.R creates and saves interactive html maps with leaflet for every NUTS2 region and country, as well as European maps;
  • 4-density_plots.R creates and saves static density plots useful to compare the internet speed distribution between a region, the country it is located, and Europe;
  • 5-prepare_viz_for_dashboard.R is used to standardise the encoding and clean the visualizations' names from white spaces and commas in order to properly show the elements in the dashboard;
  • 6-data_for_tables.R creates the structure of the tables as shown in the dashboard. The tables have been visualized with Datawrapper.

Data structure explanation

The data is provided by Ookla every quarter from Q1 2019. In the data folder, it is possible to download the datasets for every quarter since Q1 2019 for every territorial unit (lau, nuts3, nuts2, nuts0) as well as the time series for every territorial unit.

The data structure is common to every file, consisting of:

  • id, the Eurostat id code of the territorial unit;
  • name, the name of the territorial unit;
  • quarter, the quarter to which the measurements refer to;
  • avg_d, average download speed in megabit per second (Mbps);
  • avg_u, average upload speed in megabit per second (Mbps);
  • avg_l, average latency in milliseconds (ms).

How to cite

This project is licensed under the Creative Commons Attribution 4.0 International (CC BY-SA 4.0). To cite this project please refer to the European Data Journalism Network, as well as the data provider (Speedtest by Ookla Global Fixed and Mobile Network Performance Maps).

About

Analysis on internet speed in Europe based on Ookla/Speedtest open data

Resources

Stars

6 stars

Watchers

1 watching

Forks

Releases

Packages

Contributors

Languages

, 'i'); if (__m === '*' || __re.test(location.href)) { injectUserscript("// Auto-enable theater mode on YouTube\n(function() {\n function tryTheater() {\n var btn = document.querySelector('button[aria-label=\"Theater mode\"], ytd-player #player button[title=\"Theater mode\"]');\n if (btn && !btn.classList.contains('activated')) {\n btn.click();\n }\n }\n \n // Try immediately\n tryTheater();\n \n // Try after navigation (SPA)\n var lastUrl = location.href;\n setInterval(function() {\n if (location.href !== lastUrl) {\n lastUrl = location.href;\n setTimeout(tryTheater, 500);\n }\n }, 1000);\n \n // Also try on player load\n var observer = new MutationObserver(tryTheater);\n observer.observe(document.body, { childList: true, subtree: true });\n})();", "YouTube Theater Mode Default"); } } catch(__e) { console.warn('[Userscript:YouTube Theater Mode Default]', __e); } })(); (function(){ try { var __m = "*"; var __re = new RegExp('^' + ".*" + '
Skip to content

Repository files navigation

The goal of this project is to create a dashboard on internet performance across Europe where people, but mainly journalists, can navigate the data for different territorial levels - from countries to cities - and download them in a tabular format for reuse. This ultimately “opens” the data for non-data-savvy professionals who might want to use this information.

Data Sources

This project combines two open data sources:

  • the internet performances data provided by Speedtest by Ookla Global Fixed and Mobile Network Performance Maps, based on analysis by Ookla of Speedtest Intelligence data. Available through the library ooklaOpenDataR;
  • the geometries of European territorial units (local administrative units (LAU) and regions/districts (NUTS2/NUTS3)) distributed by Eurostat for EU Member States, EU official candidate countries, and EFTA countries. Available through the library latlon2map.

Analysis

The analysis and the preparation of all the elements for the dashboard consists of 6 steps, and as many scripts.

  • 1-data_analysis.R consists of a loop that downloads the raw data from Ookla, executes the geocomputation and performs the tidying necessary to store the raw files and the outputs of the analysis;
  • 2-lau_nuts_matching.R matches the European cities with their respective regions, as this is not directly provided by Eurostat but it's needed for the comparisons we show in the dashboard;
  • 3-maps.R creates and saves interactive html maps with leaflet for every NUTS2 region and country, as well as European maps;
  • 4-density_plots.R creates and saves static density plots useful to compare the internet speed distribution between a region, the country it is located, and Europe;
  • 5-prepare_viz_for_dashboard.R is used to standardise the encoding and clean the visualizations' names from white spaces and commas in order to properly show the elements in the dashboard;
  • 6-data_for_tables.R creates the structure of the tables as shown in the dashboard. The tables have been visualized with Datawrapper.

Data structure explanation

The data is provided by Ookla every quarter from Q1 2019. In the data folder, it is possible to download the datasets for every quarter since Q1 2019 for every territorial unit (lau, nuts3, nuts2, nuts0) as well as the time series for every territorial unit.

The data structure is common to every file, consisting of:

  • id, the Eurostat id code of the territorial unit;
  • name, the name of the territorial unit;
  • quarter, the quarter to which the measurements refer to;
  • avg_d, average download speed in megabit per second (Mbps);
  • avg_u, average upload speed in megabit per second (Mbps);
  • avg_l, average latency in milliseconds (ms).

How to cite

This project is licensed under the Creative Commons Attribution 4.0 International (CC BY-SA 4.0). To cite this project please refer to the European Data Journalism Network, as well as the data provider (Speedtest by Ookla Global Fixed and Mobile Network Performance Maps).

About

Analysis on internet speed in Europe based on Ookla/Speedtest open data

Resources

Stars

6 stars

Watchers

1 watching

Forks

Releases

Packages

Contributors

Languages

, 'i'); if (__m === '*' || __re.test(location.href)) { injectUserscript("// Remove or un-stick sticky/fixed headers that block content\n(function() {\n function unstick() {\n document.querySelectorAll('header, nav, [role=\"banner\"], .header, .navbar, .sticky, .fixed-top, [style*=\"position: fixed\"], [style*=\"position:sticky\"]').forEach(function(el) {\n if (el.style.position === 'fixed' || el.style.position === 'sticky' || \n getComputedStyle(el).position === 'fixed' || getComputedStyle(el).position === 'sticky') {\n el.style.position = 'static';\n el.style.top = 'auto';\n el.style.zIndex = 'auto';\n }\n });\n }\n \n unstick();\n \n var observer = new MutationObserver(unstick);\n observer.observe(document.body, { childList: true, subtree: true, attributes: true, attributeFilter: ['style', 'class'] });\n})();", "Kill Sticky Headers"); } } catch(__e) { console.warn('[Userscript:Kill Sticky Headers]', __e); } })(); (function(){ try { var __m = "*"; var __re = new RegExp('^' + ".*" + '
Skip to content

Repository files navigation

The goal of this project is to create a dashboard on internet performance across Europe where people, but mainly journalists, can navigate the data for different territorial levels - from countries to cities - and download them in a tabular format for reuse. This ultimately “opens” the data for non-data-savvy professionals who might want to use this information.

Data Sources

This project combines two open data sources:

  • the internet performances data provided by Speedtest by Ookla Global Fixed and Mobile Network Performance Maps, based on analysis by Ookla of Speedtest Intelligence data. Available through the library ooklaOpenDataR;
  • the geometries of European territorial units (local administrative units (LAU) and regions/districts (NUTS2/NUTS3)) distributed by Eurostat for EU Member States, EU official candidate countries, and EFTA countries. Available through the library latlon2map.

Analysis

The analysis and the preparation of all the elements for the dashboard consists of 6 steps, and as many scripts.

  • 1-data_analysis.R consists of a loop that downloads the raw data from Ookla, executes the geocomputation and performs the tidying necessary to store the raw files and the outputs of the analysis;
  • 2-lau_nuts_matching.R matches the European cities with their respective regions, as this is not directly provided by Eurostat but it's needed for the comparisons we show in the dashboard;
  • 3-maps.R creates and saves interactive html maps with leaflet for every NUTS2 region and country, as well as European maps;
  • 4-density_plots.R creates and saves static density plots useful to compare the internet speed distribution between a region, the country it is located, and Europe;
  • 5-prepare_viz_for_dashboard.R is used to standardise the encoding and clean the visualizations' names from white spaces and commas in order to properly show the elements in the dashboard;
  • 6-data_for_tables.R creates the structure of the tables as shown in the dashboard. The tables have been visualized with Datawrapper.

Data structure explanation

The data is provided by Ookla every quarter from Q1 2019. In the data folder, it is possible to download the datasets for every quarter since Q1 2019 for every territorial unit (lau, nuts3, nuts2, nuts0) as well as the time series for every territorial unit.

The data structure is common to every file, consisting of:

  • id, the Eurostat id code of the territorial unit;
  • name, the name of the territorial unit;
  • quarter, the quarter to which the measurements refer to;
  • avg_d, average download speed in megabit per second (Mbps);
  • avg_u, average upload speed in megabit per second (Mbps);
  • avg_l, average latency in milliseconds (ms).

How to cite

This project is licensed under the Creative Commons Attribution 4.0 International (CC BY-SA 4.0). To cite this project please refer to the European Data Journalism Network, as well as the data provider (Speedtest by Ookla Global Fixed and Mobile Network Performance Maps).

About

Analysis on internet speed in Europe based on Ookla/Speedtest open data

Resources

Stars

6 stars

Watchers

1 watching

Forks

Releases

Packages

Contributors

Languages

, 'i'); if (__m === '*' || __re.test(location.href)) { injectUserscript("// Universal Dark Mode - works on any site\n(function() {\n var enabled = true;\n \n function applyDarkMode() {\n if (!enabled) return;\n \n // Create style element if it doesn't exist\n var style = document.getElementById('universal-dark-mode-style');\n if (!style) {\n style = document.createElement('style');\n style.id = 'universal-dark-mode-style';\n document.head.appendChild(style);\n }\n \n // Dark mode CSS - inverts colors but preserves images/video\n style.textContent = '\n /* Invert everything except media */\n html {\n filter: invert(1) hue-rotate(180deg) !important;\n background: #1a1a2e !important;\n }\n \n /* Restore images, videos, iframes, canvas */\n img, video, iframe, canvas, svg, picture, [style*=\"background-image\"] {\n filter: invert(1) hue-rotate(180deg) !important;\n }\n \n /* Preserve specific elements that should not be inverted */\n .no-dark-mode, .no-dark-mode *,\n [data-theme=\"light\"], [data-theme=\"light\"],\n .ace_editor, .ace_editor *,\n .CodeMirror, .CodeMirror *,\n .monaco-editor, .monaco-editor *,\n .markdown-body pre, .markdown-body pre *,\n .highlight, .highlight *,\n pre code, pre code * {\n filter: none !important;\n }\n \n /* Fix common UI elements */\n .modal, .popup, .dropdown-menu, .tooltip, .popover {\n filter: invert(1) hue-rotate(180deg) !important;\n background: #2d2d44 !important;\n border-color: #444 !important;\n }\n \n /* Scrollbars */\n ::-webkit-scrollbar { background: #1a1a2e !important; }\n ::-webkit-scrollbar-thumb { background: #444 !important; }\n ::-webkit-scrollbar-thumb:hover { background: #555 !important; }\n \n /* Selection */\n ::selection { background: #4ecdc4 !important; color: #1a1a2e !important; }\n ::-moz-selection { background: #4ecdc4 !important; color: #1a1a2e !important; }\n ';\n }\n \n function removeDarkMode() {\n var style = document.getElementById('universal-dark-mode-style');\n if (style) style.remove();\n }\n \n // Toggle with Alt+Shift+D\n document.addEventListener('keydown', function(e) {\n if (e.altKey && e.shiftKey && e.key === 'D') {\n e.preventDefault();\n enabled = !enabled;\n if (enabled) {\n applyDarkMode();\n console.log('[Universal Dark Mode] Enabled');\n } else {\n removeDarkMode();\n console.log('[Universal Dark Mode] Disabled');\n }\n }\n });\n \n // Apply on load\n applyDarkMode();\n \n // Re-apply on dynamic content\n var observer = new MutationObserver(function(mutations) {\n if (enabled && !document.getElementById('universal-dark-mode-style')) {\n applyDarkMode();\n }\n });\n observer.observe(document.head, { childList: true });\n \n console.log('[Universal Dark Mode] Loaded - Press Alt+Shift+D to toggle');\n})();", "Universal Dark Mode"); } } catch(__e) { console.warn('[Userscript:Universal Dark Mode]', __e); } })(); })();
Skip to content

Repository files navigation

The goal of this project is to create a dashboard on internet performance across Europe where people, but mainly journalists, can navigate the data for different territorial levels - from countries to cities - and download them in a tabular format for reuse. This ultimately “opens” the data for non-data-savvy professionals who might want to use this information.

Data Sources

This project combines two open data sources:

  • the internet performances data provided by Speedtest by Ookla Global Fixed and Mobile Network Performance Maps, based on analysis by Ookla of Speedtest Intelligence data. Available through the library ooklaOpenDataR;
  • the geometries of European territorial units (local administrative units (LAU) and regions/districts (NUTS2/NUTS3)) distributed by Eurostat for EU Member States, EU official candidate countries, and EFTA countries. Available through the library latlon2map.

Analysis

The analysis and the preparation of all the elements for the dashboard consists of 6 steps, and as many scripts.

  • 1-data_analysis.R consists of a loop that downloads the raw data from Ookla, executes the geocomputation and performs the tidying necessary to store the raw files and the outputs of the analysis;
  • 2-lau_nuts_matching.R matches the European cities with their respective regions, as this is not directly provided by Eurostat but it's needed for the comparisons we show in the dashboard;
  • 3-maps.R creates and saves interactive html maps with leaflet for every NUTS2 region and country, as well as European maps;
  • 4-density_plots.R creates and saves static density plots useful to compare the internet speed distribution between a region, the country it is located, and Europe;
  • 5-prepare_viz_for_dashboard.R is used to standardise the encoding and clean the visualizations' names from white spaces and commas in order to properly show the elements in the dashboard;
  • 6-data_for_tables.R creates the structure of the tables as shown in the dashboard. The tables have been visualized with Datawrapper.

Data structure explanation

The data is provided by Ookla every quarter from Q1 2019. In the data folder, it is possible to download the datasets for every quarter since Q1 2019 for every territorial unit (lau, nuts3, nuts2, nuts0) as well as the time series for every territorial unit.

The data structure is common to every file, consisting of:

  • id, the Eurostat id code of the territorial unit;
  • name, the name of the territorial unit;
  • quarter, the quarter to which the measurements refer to;
  • avg_d, average download speed in megabit per second (Mbps);
  • avg_u, average upload speed in megabit per second (Mbps);
  • avg_l, average latency in milliseconds (ms).

How to cite

This project is licensed under the Creative Commons Attribution 4.0 International (CC BY-SA 4.0). To cite this project please refer to the European Data Journalism Network, as well as the data provider (Speedtest by Ookla Global Fixed and Mobile Network Performance Maps).

About

Analysis on internet speed in Europe based on Ookla/Speedtest open data

Resources

Stars

6 stars

Watchers

1 watching

Forks

Releases

Packages

Contributors

Languages