Deploiement d'un réseau IoT lorawan Multitenant sur le technopole ElGhazala
Deployment of a Lorawan Multitenant IoT network on the ElGhazala technopole This involves installing 3 gateways connected to the ChirpStack network server. For a user to exploit the network, simply he should ask the admin to create a tenant on Chirpstack and assign it as admin to that tenant. The admin adds shared gateways to all tenants. Now the user can create applications and can add the end-devices associated to his application. This project targets all students, PhD students and teachers of Sup'Com as well as professionals in partnership.
A single machine running a Linux based operating system.
A single machine running a Windows based operating system for monitoring / administration.
Docker version 23.0.5 and Docker Compose version 2.17.3 is used in this tutorial. Detailed installation instructions can be found here.
Arduino IDE. Detailed installation instructions can be found here.
Postman. Detailed installation instructions can be found here.
Git
sudo apt-get install git- To install Chirpstack v3 with docker, follow the next steps.
git clone https://github.com/chirpstack/chirpstack-docker.git
cd chirpstack-docker
git checkout v3
docker compose up- To check whether the installation was successful go to the server IP on port 8080. In the following tutorial my server IP address is 192.168.33.69.
- A seeeduino lorawana gateway kit. For further details on the kit visit this wiki page
- A DHT11 temperatur and humidity sensor.

The tutorial allows the deployment of the following system, comprising a basic FIWARE IoT stack:
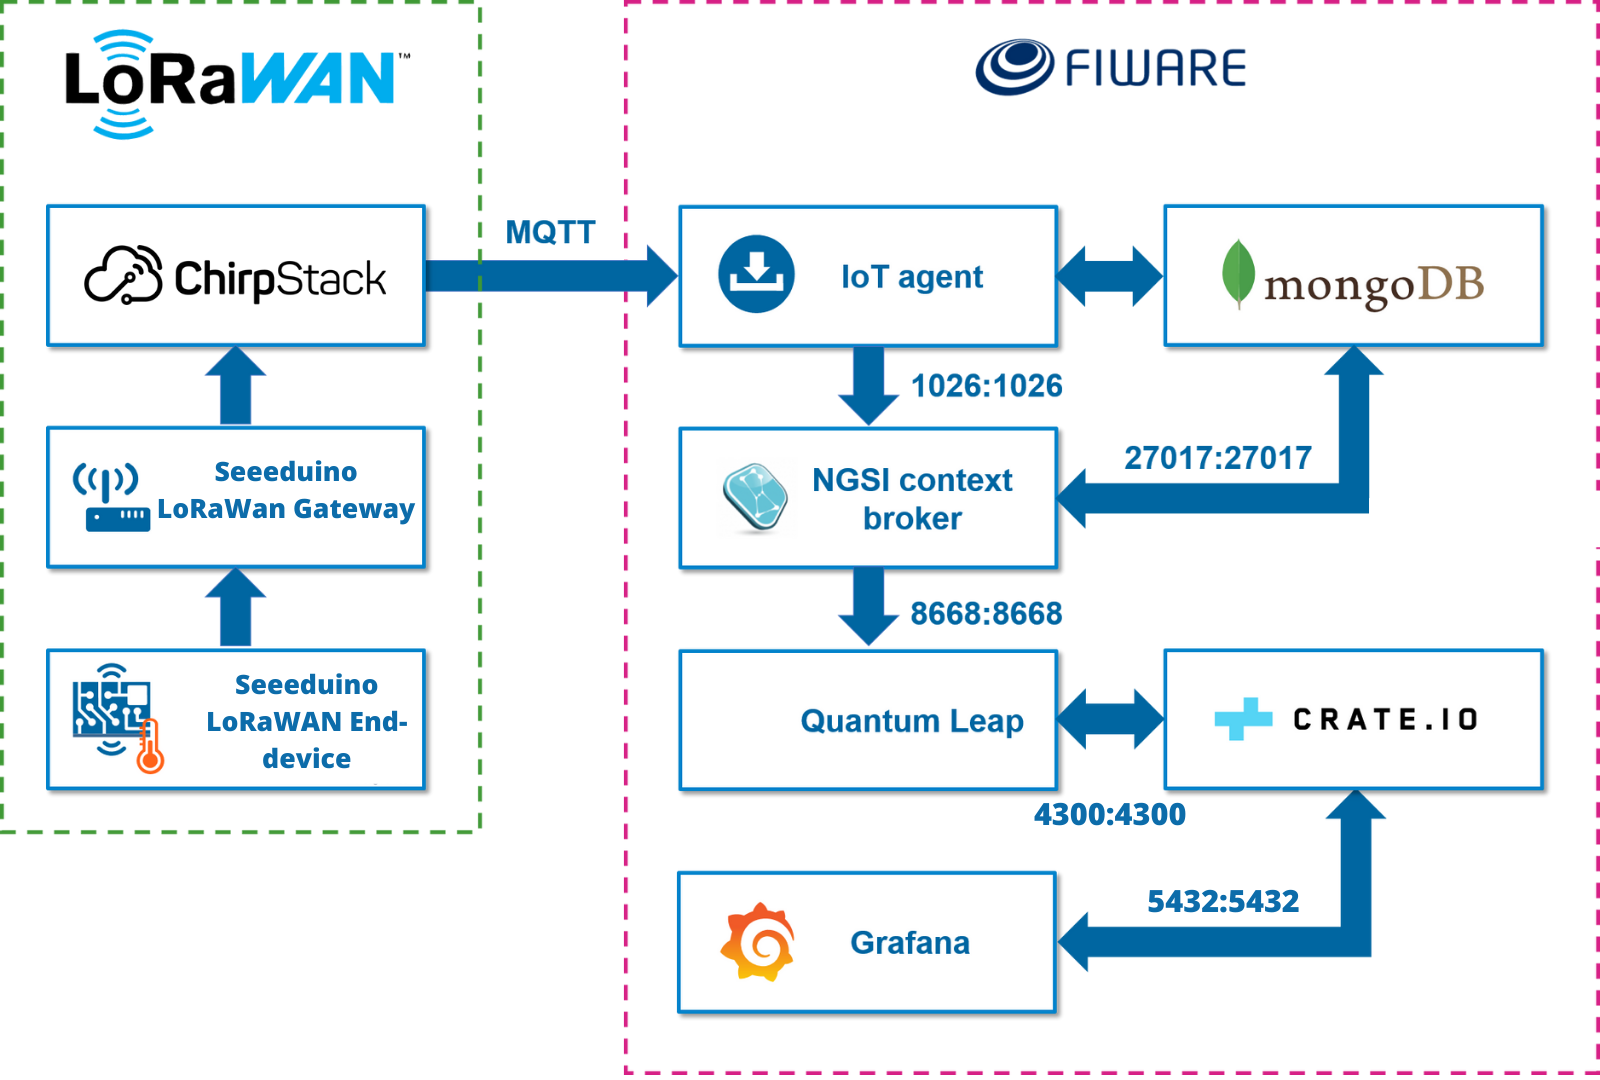
- A LoRaWAN end-node based on an Seeeduino LoRaWAN development board. In our application, the device will readtemperatur and humidity values from the DHT11 sensor, encode the information using CayenneLpp data model and forward the result to Chirpstack LoRaWAN stack through the gateways.
- The LoRaWAN gateway plays the role of a concentrator which forwards the messages to the LoRaWAN network server, included in Chirpstack v3 stack.
- Chirpstack v3 stack implements the functionalities of the LoRaWAN network server and LoRaWAN application server.
- FIWARE IoT Agent enables the ingestion of data from LoRaWAN application servers in NGSI context brokers, subscribing to appropriate communication channels (i.e., MQTT topics), decoding payloads and translating them to NGSI data model. It relies on a MongoDB database to persist information.
- FIWARE Context Broker manages large-scale context information abstracting the type of data source and the underlying communication technologies. It relies on a MongoDB database to persist information.
- FIWARE Quantum Leap subscribes to notifications of new data ingested by FIWARE Context Brokers and stores the historical information in time-series format. It relies on a CrateDB database to persist information.
- Grafana provides an easy and intuitive mechanism to visualize and explore data by means of fashionable dashboards.
All the code and files needed to follow this tutorial are included in FiwareAtSupCom\LoraWan GitHub repository. To clone the repository:
git clone https://github.com/FiwareAtSupCom/LoraWan.gitTo configure the gateway for forwarding lorawan packets to the network server, you need to follow the next steps.
- Hardware connection.
- Open gateway terminal (over Serial or SSH). You can follow the instructions in the Seeeduino getting started section.
- Configure the gateway to forward the lorawan packets to chirpstack server:
nano /home/rxhf/risinghf/pktfwd/local_conf.jsonChange the server_address to your chirpstack server IP address, change serv_port_up and server_port_down to 1700, and keep the gateway_ID, we will need it later.
{
"gateway_conf": {
"gateway_ID": "b827ebfffe0e1174",
"autoquit_threshold": 5,
"server_address": "SERVER_ADDRESS",
"serv_port_up": 1700,
"serv_port_down": 1700
}
}- To apply the changes reboot the gateway:
sudo rebootGo to the web UI of chirpstack following this link:
http://192.168.33.69:8080and login using "admin" as a username and a password.Add a network server:
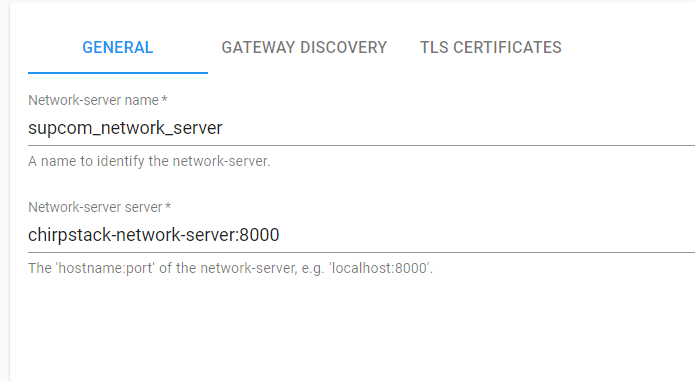
Add a new service profile.
Add a new gateway:
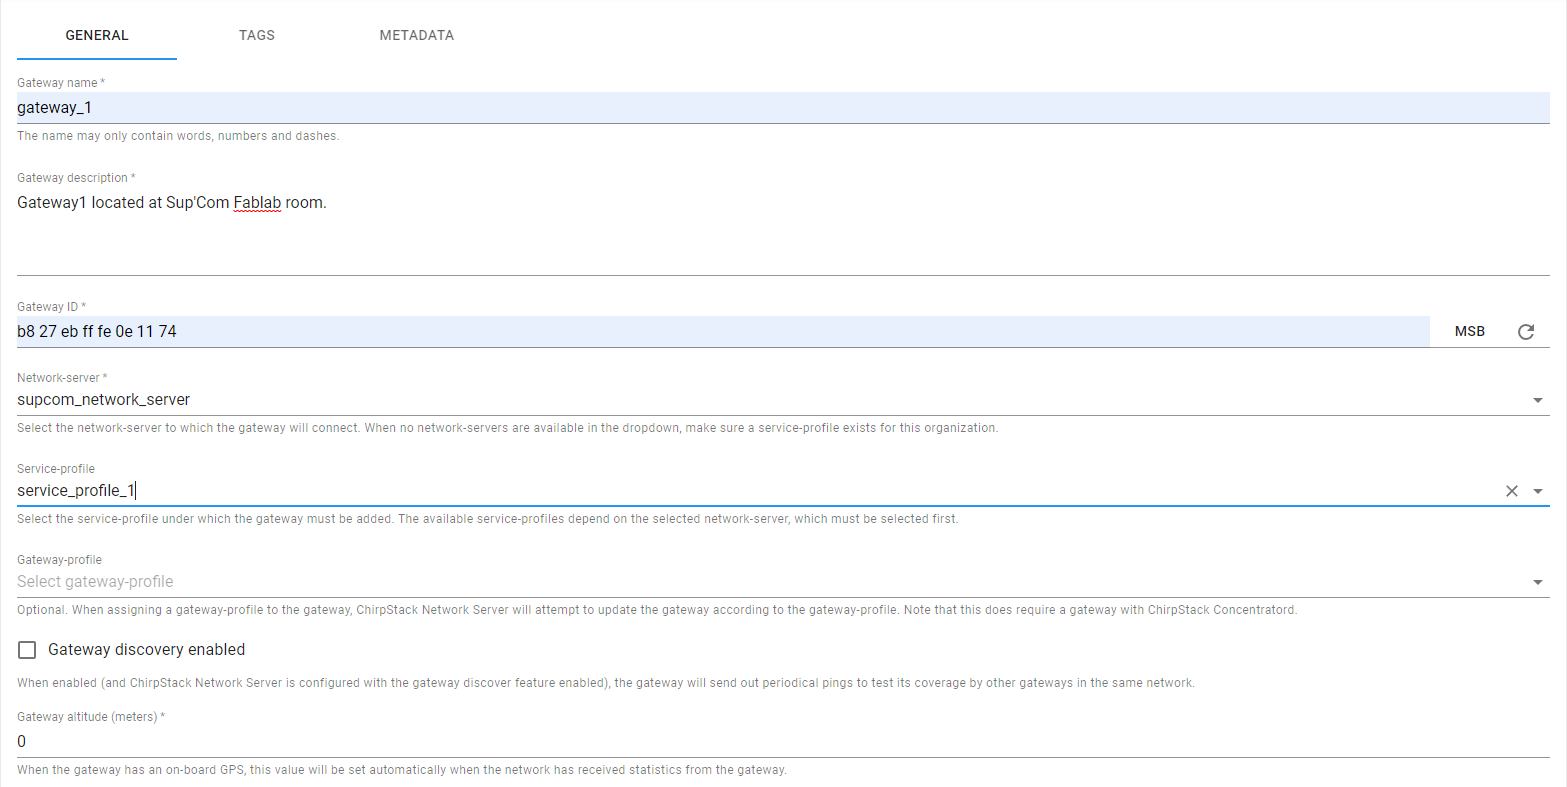
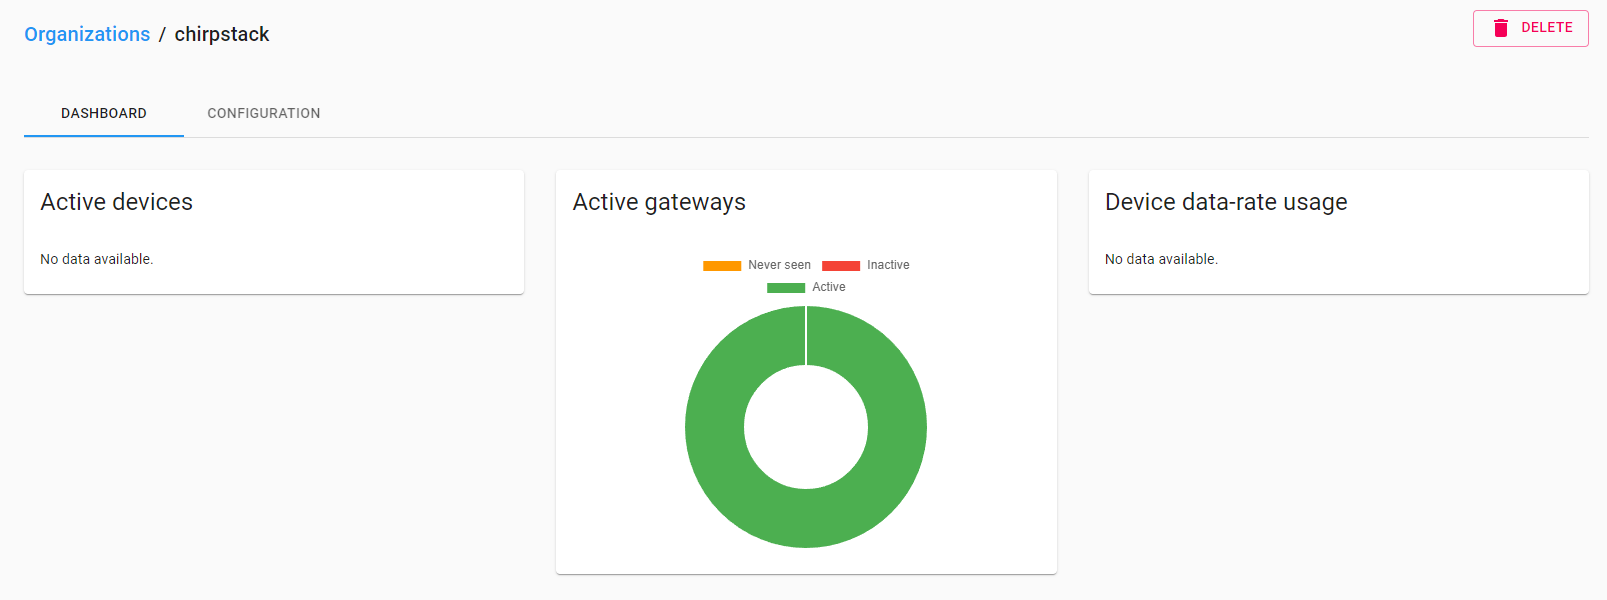
- Verify that the gateway is active in the dashboard.
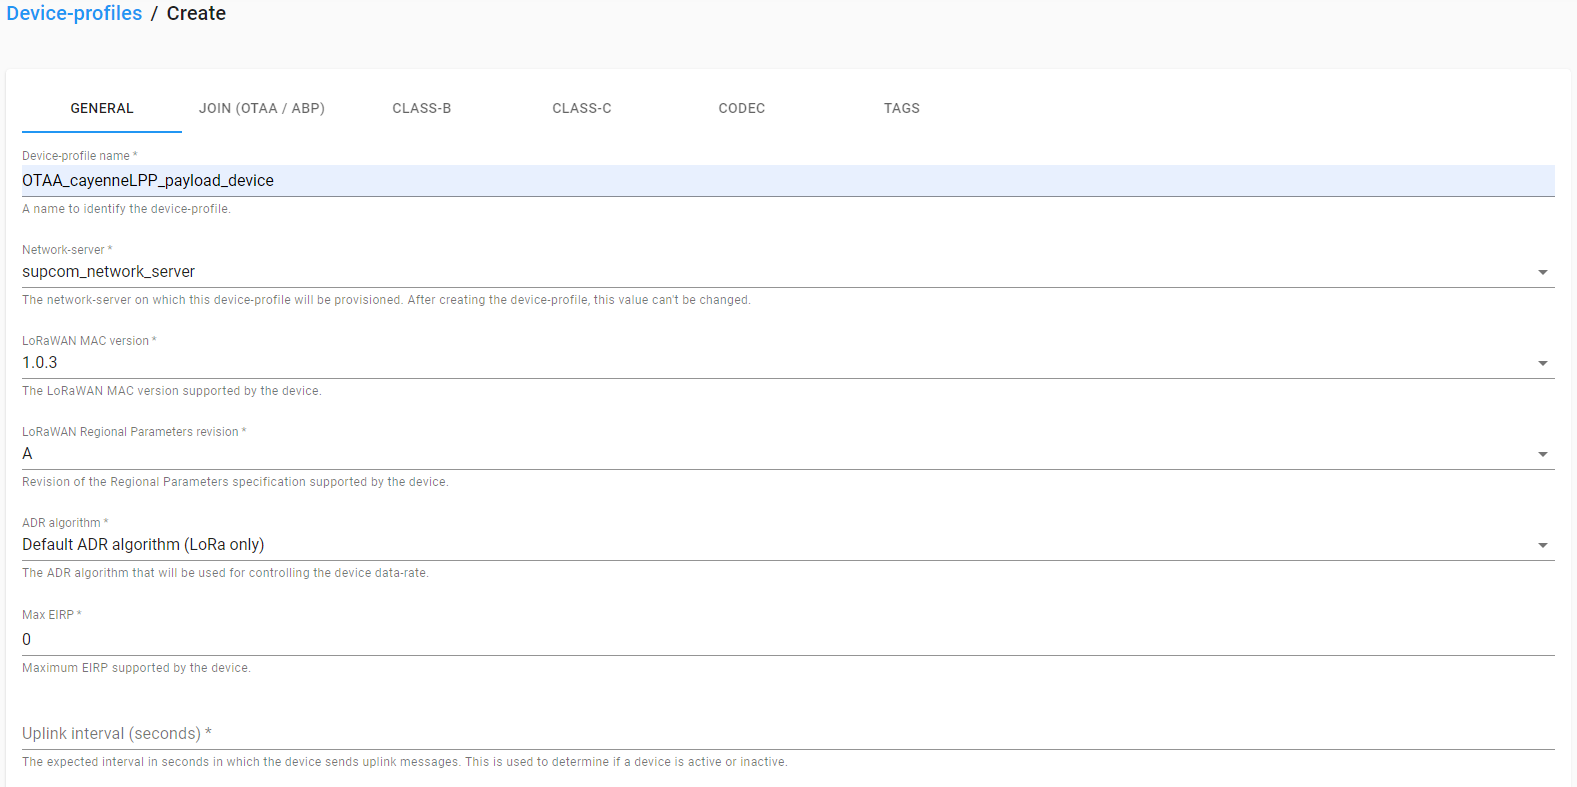
- Add a new device profile and make sure to check OTAA mode support and CayenneLPP as a codec:
Add an application.
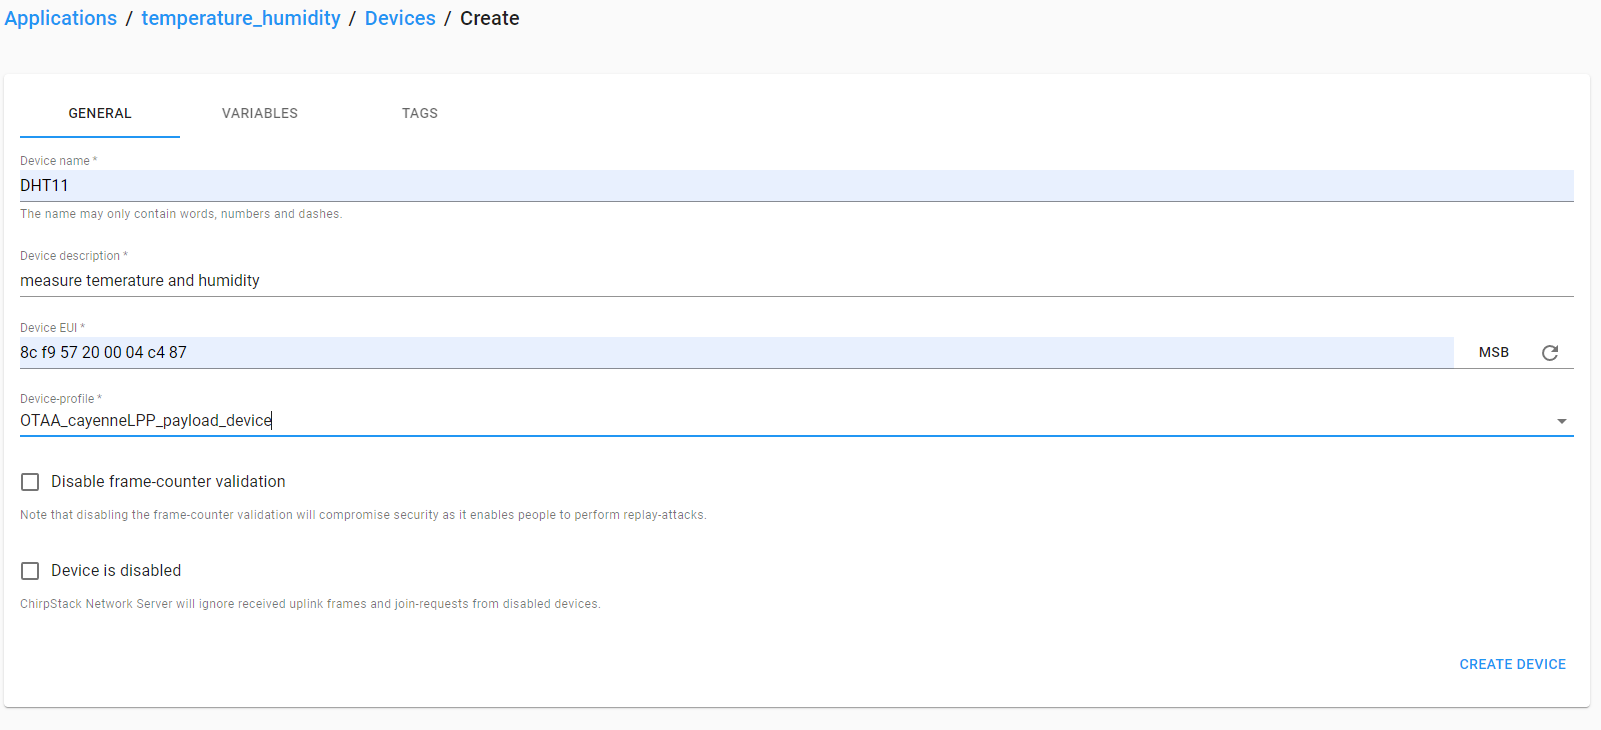
Add a device to the created application using the device profile. For that you will need to generate an Appkey (that you need to keep for the next step)and the DEV EUI which you can get following Seeeduino AT communication section.
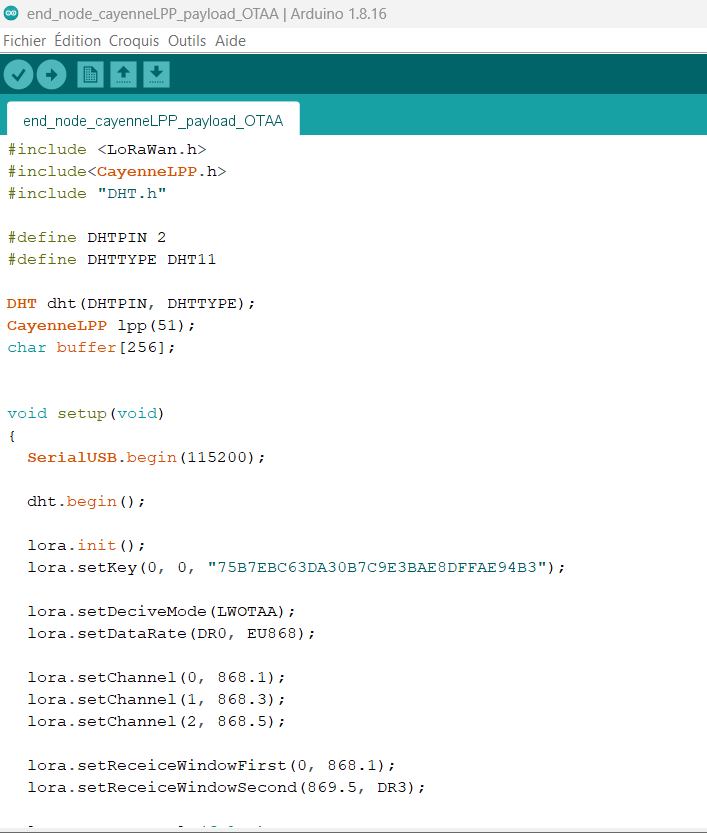
- Open the end node device sketch located in
seeeduino_lorawana_end_device/end_node_cayenneLPP_payload_OTAA.
- Install the required libraries and seeeduino lorawan board. You can follow this tutorial.
- Change the appkey generated in the previous step.
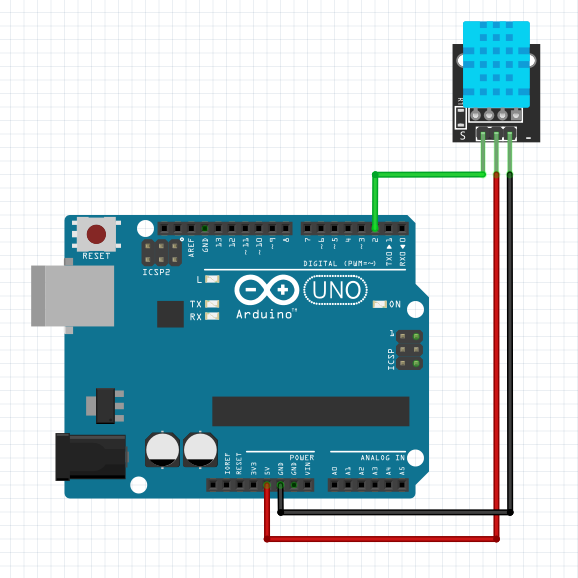
- Upload the code to the board and make the wiring as shown in the next figure.
- We will create the FIWARE stack containers using the following command.
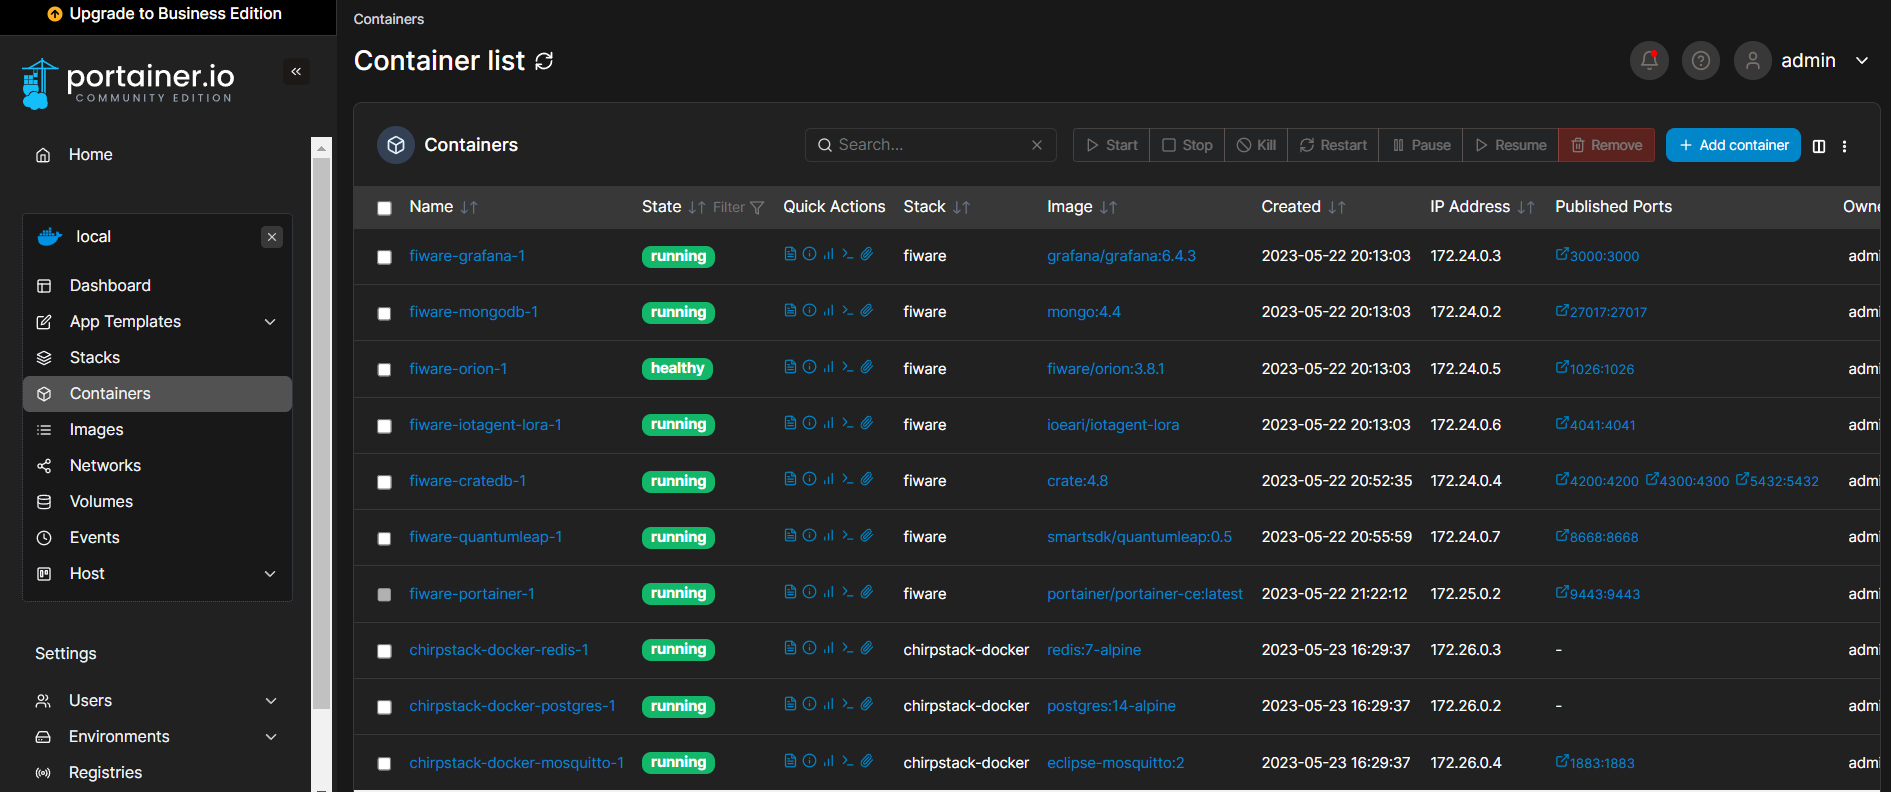
docker compose -f docker/fiware/docker-compose.ymlFor the containers administration and visualisation we will use Portainer web UI installed using the previous cmd.(You will need to create an account.)
You can open the UI interface using this link:
https://192.168.33.69:9443
- Import the Postman workspace located in "postman/fiware1.postman_collection.json" which containes the needed HTTP requests.
- GET request to:
http://192.168.33.69:1026/version- The output should be like this:
{
"orion": {
"version": "3.8.1",
"uptime": "0 d, 21 h, 19 m, 10 s",
"git_hash": "30622caf67bb4384b73747abb17733e5ad9989a8",
"compile_time": "Fri Feb 17 10:20:06 UTC 2023",
"compiled_by": "root",
"compiled_in": "02a18b9e9dcd",
"release_date": "Fri Feb 17 10:20:06 UTC 2023",
"machine": "x86_64",
"doc": "https://fiware-orion.rtfd.io/en/3.8.1/",
"libversions": {
"boost": "1_74",
"libcurl": "libcurl/7.74.0 OpenSSL/1.1.1n zlib/1.2.12 brotli/1.0.9 libidn2/2.3.0 libpsl/0.21.0 (+libidn2/2.3.0) libssh2/1.9.0 nghttp2/1.43.0 librtmp/2.3",
"libmosquitto": "2.0.15",
"libmicrohttpd": "0.9.73",
"openssl": "1.1",
"rapidjson": "1.1.0",
"mongoc": "1.23.1",
"bson": "1.23.1"
}
}
}- GET request to:
http://192.168.33.69:4041/iot/about- The output should be like this:
{
"libVersion": "2.21.0",
"port": 4041,
"baseRoot": "/",
"version": "1.2.5"
}- POST request to:
http://192.168.33.69:4041/iot/devices- Add these headers:
fiware-service: smartroom
fiware-servicepath: /rooms- And this body(you should change the fields of: dev_eui, app_eui, application_id, application_key. You can get them from the chirpstack application.)
{
"devices": [
{
"device_id": "dht_001",
"entity_name": "DHT_001",
"entity_type": "DHT",
"timezone": "Europe/Berlin",
"attributes": [
{
"object_id": "rh1",
"name": "relative_humidity_1",
"type": "Number"
},
{
"object_id": "t1",
"name": "temperature_1",
"type": "Number"
}
],
"internal_attributes": {
"lorawan": {
"application_server": {
"host": "192.168.33.69",
"username": "admin",
"password": "admin",
"provider": "chirpstack"
},
"dev_eui": "8cf957200004c487",
"app_eui": "4569343567897875",
"application_id": "1",
"application_key": "75B7EBC63DA30B7C9E3BAE8DFFAE94B3",
"data_model": "cayennelpp"
}
}
}
]
}- The output should be like this with 201 status code
{}- GET request to:
http://192.168.33.69:4041/iot/devices- Add these headers:
fiware-service: smartroom
fiware-servicepath: /rooms- The output should be:
{
"count": 1,
"devices": [
{
"device_id": "dht_001",
"service": "smartroom",
"service_path": "/rooms",
"entity_name": "DHT_001",
"entity_type": "DHT",
"attributes": [
{
"object_id": "rh1",
"name": "relative_humidity_1",
"type": "Number"
},
{
"object_id": "t1",
"name": "temperature_1",
"type": "Number"
}
],
"lazy": [],
"commands": [],
"static_attributes": [],
"internal_attributes": {
"lorawan": {
"application_server": {
"host": "192.168.33.69",
"username": "admin",
"password": "admin",
"provider": "chirpstack"
},
"dev_eui": "8cf957200004c487",
"app_eui": "4569343567897875",
"application_id": "1",
"application_key": "75B7EBC63DA30B7C9E3BAE8DFFAE94B3",
"data_model": "cayennelpp"
}
}
}
]
}- GET request to:
http://192.168.33.69:1026/v2/entities/DHT_001- Add these headers:
fiware-service: smartroom
fiware-servicepath: /rooms- The output should be:
{
"id": "DHT_001",
"type": "DHT",
"TimeInstant": {
"type": "DateTime",
"value": "2023-05-24T14:49:26.718Z",
"metadata": {}
},
"relative_humidity_1": {
"type": "Number",
"value": 62,
"metadata": {
"TimeInstant": {
"type": "DateTime",
"value": "2023-05-24T14:49:26.718Z"
}
}
},
"temperature_1": {
"type": "Number",
"value": 26,
"metadata": {
"TimeInstant": {
"type": "DateTime",
"value": "2023-05-24T14:49:26.718Z"
}
}
}
}- GET request to:
http://192.168.33.69:8668/version- The output should be like this:
{
"version": "0.8.x"
}- POST request to:
http://192.168.33.69:1026/v2/subscriptions- Add these headers:
fiware-service: smartroom
fiware-servicepath: /rooms- And this body:
{
"description": "Notify QuantumLeap of all DHT Sensor changes",
"subject": {
"entities": [
{
"idPattern": "DHT*"
}
],
"condition": {
"attrs": [
"relative_humidity_1",
"temperature_1"
]
}
},
"notification": {
"http": {
"url": "http://quantumleap:8668/v2/notify"
},
"attrs": [
"relative_humidity_1",
"temperature_1"
],
"metadata": ["dateCreated", "dateModified"]
}
}- This should return an empty response body with a 201 status code
- GET request to:
http://192.168.33.69:1026/v2/subscriptions- Add these headers:
fiware-service: smartroom
fiware-servicepath: /rooms- The output should be like this:
[
{
"id": "646e24594282b5b0b902b9ce",
"description": "Notify QuantumLeap of all DHT Sensor changes",
"status": "active",
"subject": {
"entities": [
{
"idPattern": "DHT*"
}
],
"condition": {
"attrs": [
"relative_humidity_1",
"temperature_1"
]
}
},
"notification": {
"timesSent": 1,
"lastNotification": "2023-05-24T14:51:06.000Z",
"attrs": [
"relative_humidity_1",
"temperature_1"
],
"onlyChangedAttrs": false,
"attrsFormat": "normalized",
"http": {
"url": "http://quantumleap:8668/v2/notify"
},
"metadata": [
"dateCreated",
"dateModified"
],
"lastSuccess": "2023-05-24T14:51:06.000Z",
"lastSuccessCode": 200,
"covered": false
}
}
]- GET request to:
http://192.168.33.69:8668/v2/entities/DHT_001- Add these headers:
fiware-service: smartroom
fiware-servicepath: /rooms- The output should be like this:
{
"attributes": [
{
"attrName": "TimeInstant",
"values": [
null,
null,
null,
null,
null
]
},
{
"attrName": "relative_humidity_1",
"values": [
62.0,
62.0,
62.0,
62.0,
61.0
]
},
{
"attrName": "temperature_1",
"values": [
26.0,
26.0,
26.0,
27.0,
26.0
]
}
],
"entityId": "DHT_001",
"index": [
"2023-05-24T14:50:16.840+00:00",
"2023-05-24T14:50:26.865+00:00",
"2023-05-24T14:50:36.888+00:00",
"2023-05-24T14:50:46.908+00:00",
"2023-05-24T14:51:06.962+00:00"
]
}Navigate to
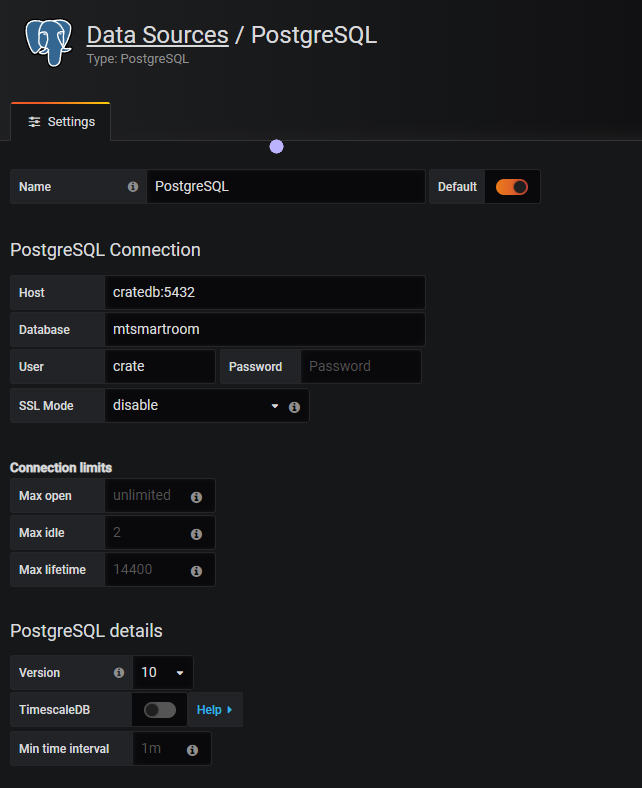
http://192.168.33.69:3000and log in with default credentials which are:admin / adminAdd a new data source using the following parameters:
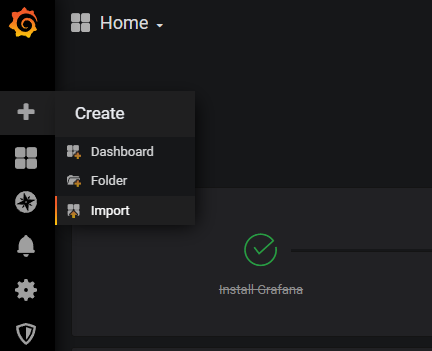
- Import the dashboard located in:
grafana_dashboardfolder.
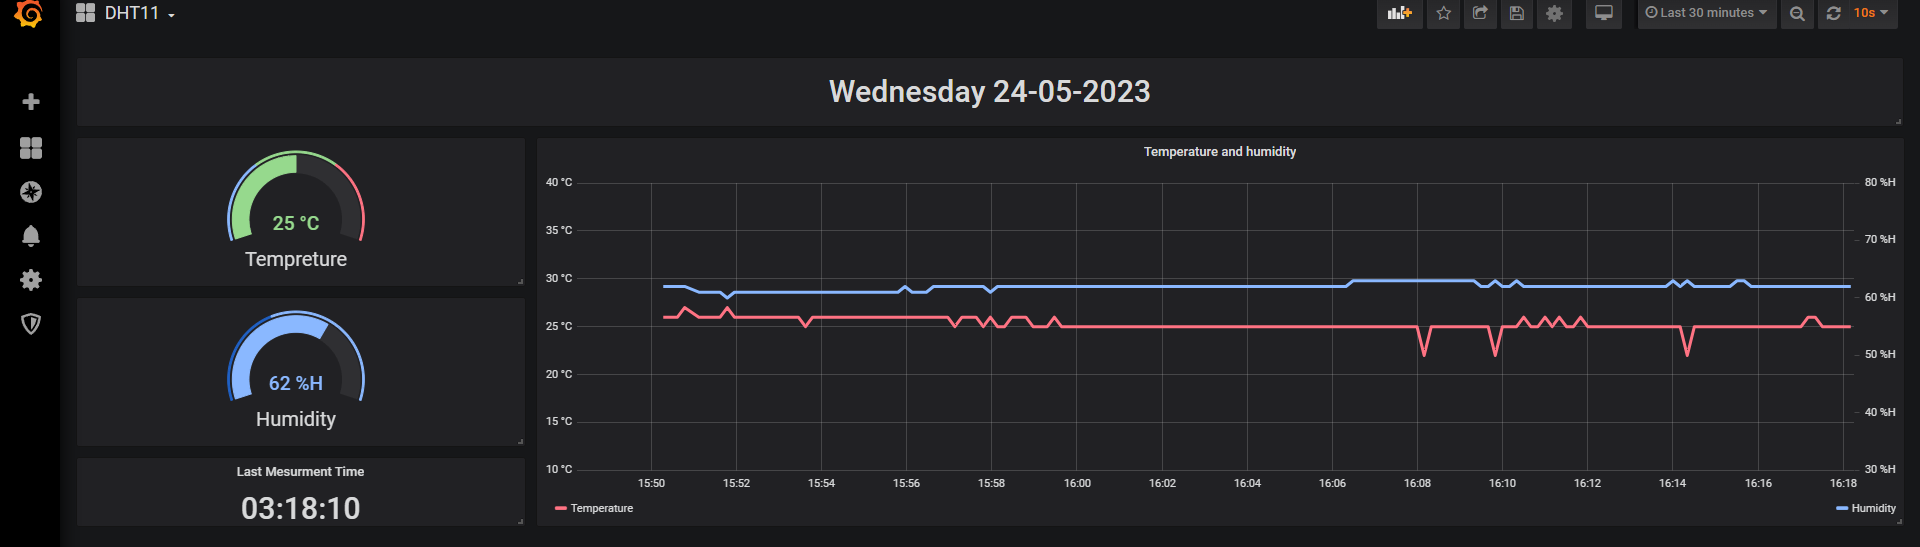
- The final result should look like this: