- Instalation
- Simple
- Zoom smooth line and axis customization
- Ranges
- Customization options
- Ranges chart customization
- Live updates
pod 'NCICharts'
![alt text][Illustration] [Illustration]: https://raw.github.com/FlowForwarding/dynamiccharts/master/docs/simple.png "NCI simple chart"

#import"NCISimpleChartView.h"
NCISimpleChartView *chart = [[NCISimpleChartView alloc] initWithFrame:CGRectMake(50, 30, 400, 250)];
[self.view addSubview:chart];
int numOfPoints = 10;
for (int ind = 0; ind < numOfPoints; ind ++){
if (ind % 5 == 0){
[chart addPoint:ind val:@[[NSNull null]]];
} else {
[chart addPoint:ind val:@[@(arc4random() % 5)]];
}
}![alt text][IllustrationZoom] [IllustrationZoom]: https://raw.github.com/FlowForwarding/dynamiccharts/master/docs/zoom.gif

![alt text][IllustrationDecr] [IllustrationDecr]: https://raw.github.com/FlowForwarding/dynamiccharts/master/docs/decr.png
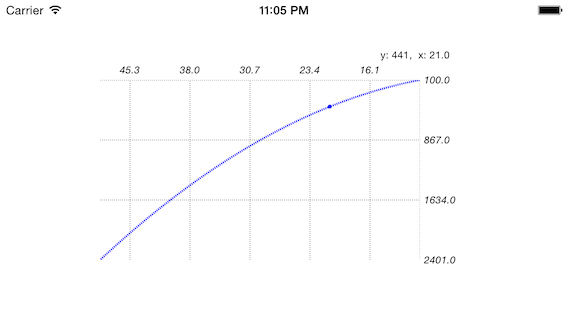
 NCISimpleChartView *zoomingChart = [[NCISimpleChartView alloc] initWithFrame:CGRectMake(self.view.frame.size.height + 50, 30, 400, 250)
andOptions:@{nciGraphRenderer: [NCIZoomGraphView class],
nciIsSmooth: @[@YES],
nciYAxis: @{
nciAxisShift: @320,
nciInvertedLabes: @YES,
nciLineDashes: @[],
nciLineWidth: @2
},
nciXAxis: @{
nciLineColor: [UIColor greenColor],
nciLineWidth: @2,
nciAxisShift : @90,
nciInvertedLabes: @YES
}}];
[pages addSubview:zoomingChart];
int numOfPoints = 10;
for (int ind = 0; ind < numOfPoints; ind ++){
[zoomingChart addPoint:ind val:@[@(arc4random() % 5)]];
}
NCISimpleChartView *nciChartDecreasing = [[NCISimpleChartView alloc] initWithFrame:CGRectMake(self.view.frame.size.height + 50, 30, 400, 250) andOptions:
@{
nciGraphRenderer: [NCIZoomGraphView class],
nciLineWidths: @[@2],
nciIsFill: @[@(NO)],
nciYAxis: @{
nciAxisDecreasing: @YES,
nciAxisShift : @320,
nciInvertedLabes: @YES
},
nciXAxis: @{
nciAxisDecreasing: @YES,
nciAxisShift : @0,
nciInvertedLabes: @YES
}
}];
nciChartDecreasing.topBottomGridSpace = 0;
[pages addSubview:nciChartDecreasing];
for (int ind = 10; ind < 50; ind ++){
[nciChartDecreasing addPoint:ind val:@[@(ind*ind)]];
}![alt text][Illustration2] [Illustration2]: https://raw.github.com/FlowForwarding/dynamiccharts/master/docs/ranges.png "NCI chart"

#import"NCIChartView.h"
NCIChartView *chart = [[NCIChartView alloc] initWithFrame:CGRectMake(0, 0, 300, 400)];
[self.view addSubview:chart];
int numOfPoints = 10;
for (int ind = 0; ind < numOfPoints; ind ++){
[chart addPoint:ind val:@[@(arc4random() % 5)]];
}
chart.minRangeVal = 5;
chart.maxRangeVal = 8; ![alt text][Illustration4] [Illustration4]: https://raw.github.com/FlowForwarding/dynamiccharts/master/docs/cuatomization.png "NCI customized chart"
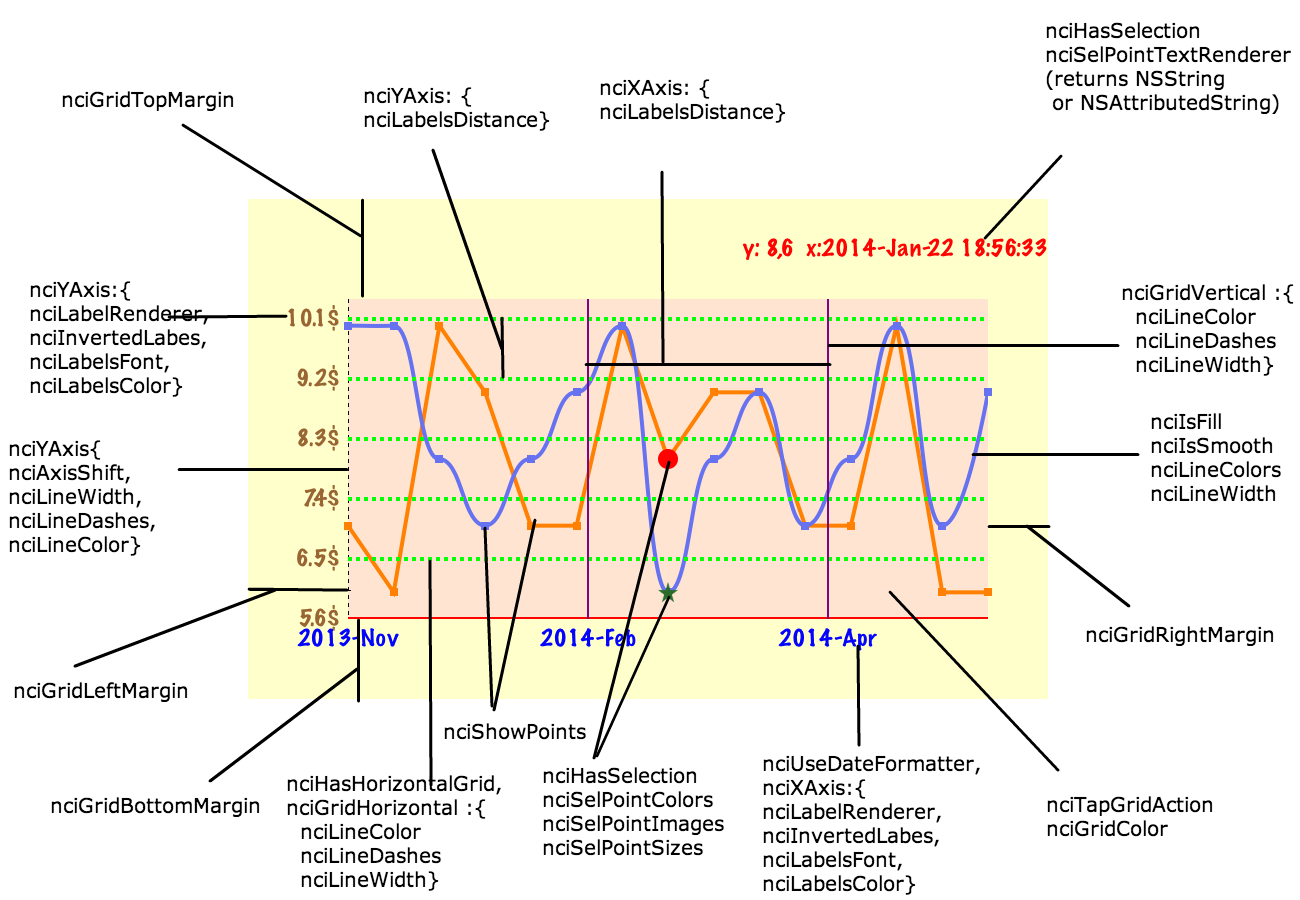
 NCISimpleChartView *simpleChart = [[NCISimpleChartView alloc]
initWithFrame:CGRectMake(50, 30, 400, 250)
andOptions: @{
nciIsFill: @[@(NO), @(NO)],
nciIsSmooth: @[@(NO), @(YES)],
nciLineColors: @[[UIColor orangeColor], [NSNullnull]],
nciLineWidths: @[@2, [NSNullnull]],
nciHasSelection: @YES,
nciSelPointColors: @[[UIColor redColor]],
nciSelPointImages: @[[NSNullnull], @"star"],
nciSelPointTextRenderer: ^(double argument, NSArray* values){
NSDateFormatter *dateFormatter = [[NSDateFormatteralloc] init];
[dateFormatter setDateFormat:@"yyyy-MMM-dd HH:mm:ss"];
return [[NSAttributedStringalloc] initWithString:
[NSStringstringWithFormat:@"y: %.0f,%.0f x:%@",
[values[0] floatValue],
[values[1] floatValue],
[dateFormatter stringFromDate:[NSDatedateWithTimeIntervalSince1970: argument]]]
attributes: @{NSForegroundColorAttributeName: [UIColor redColor],
NSFontAttributeName: [UIFont fontWithName:@"MarkerFelt-Thin"size:12]}];
},
nciSelPointSizes: @[@10, [NSNullnull]],
// nciTapGridAction: ^(double argument, double value, float xInGrid, float yInGrid){//// },
nciShowPoints : @YES,
nciUseDateFormatter: @YES,//nciXLabelRenderer
nciXAxis: @{nciLineColor: [UIColor redColor],
nciLineDashes: @[],
nciLineWidth: @2,
nciLabelsFont: [UIFont fontWithName:@"MarkerFelt-Thin"size:12],
nciLabelsColor: [UIColor blueColor],
nciLabelsDistance: @120,
nciUseDateFormatter: @YES
},
nciYAxis: @{nciLineColor: [UIColor blackColor],
nciLineDashes: @[@2,@2],
nciLineWidth: @1,
nciLabelsFont: [UIFont fontWithName:@"MarkerFelt-Thin"size:12],
nciLabelsColor: [UIColor brownColor],
nciLabelsDistance: @30,
nciLabelRenderer: ^(double value){
return [[NSAttributedStringalloc] initWithString: [NSStringstringWithFormat:@"%.1f$", value]
attributes:@{NSForegroundColorAttributeName: [UIColor brownColor],
NSFontAttributeName: [UIFont fontWithName:@"MarkerFelt-Thin"size:12]}];
},
},
nciGridVertical: @{nciLineColor: [UIColor purpleColor],
nciLineDashes: @[],
nciLineWidth: @1},
nciGridHorizontal: @{nciLineColor: [UIColor greenColor],
nciLineDashes: @[@2,@2],
nciLineWidth: @2},
nciGridColor: [[UIColor magentaColor] colorWithAlphaComponent:0.1],
nciGridLeftMargin: @50,
nciGridTopMargin: @50,
nciGridBottomMargin: @40
}];
simpleChart.backgroundColor = [[UIColor yellowColor] colorWithAlphaComponent:0.2];
int numOfPoints = 10;
double dataPeriod = 60*60*24*30;
double step = dataPeriod/(numOfPoints - 1);
for (int ind = 0; ind < numOfPoints; ind ++){
//to use default date formatter for Y axis, provide arguments as timeIntervalSince1970//and set nciXLabelRenderer option to YES
[simpleChart addPoint:[[NSDatedateWithTimeIntervalSinceNow: -dataPeriod + step *ind] timeIntervalSince1970] val:@[@(arc4random() % 5),
@(arc4random() % 5)]];
} NCIChartView *chart = [[NCIChartView alloc]
initWithFrame:CGRectMake(0, 0, 400, 250)
andOptions: @{
nciTopGraphOptions : @{
//simple chart options
},
nciBottomGraphOptions : @{
//simple chart options
},
nciLeftRangeImageName: @"image",
nciRightRangeImageName: @"image",
nciBottomChartHeight: @50
}
];
//@property(nonatomic)double minRangeVal;//@property(nonatomic)double maxRangeVal;//@property (nonatomic, copy) void (^rangesMoved)(void); NCISimpleChartView *chart = [[NCISimpleChartView alloc]
initWithFrame:CGRectMake(50, 30, 400, 250)];
[self.view addSubview:chart];
int numOfPoints = 10;
for (int ind = 0; ind < numOfPoints; ind ++){
[chart addPoint:ind val:@[@(arc4random() % 5)]];
}
dispatch_async(dispatch_get_global_queue(DISPATCH_QUEUE_PRIORITY_DEFAULT, 0), ^{
for (int ind = numOfPoints; ind < 4*numOfPoints; ind ++){
[NSThreadsleepForTimeInterval:2.0f];
[chart addPoint:ind val:@[@(2*ind)]];
dispatch_async(dispatch_get_main_queue(), ^{
[chart drawChart];
});
}
});