Repository files navigation

mdadash

Latest releaseLast release tagGitHub commits since latest release (by date) for a branchDocumentation Status
StatusGH Actions Statuscodecov
CommunityLicense: MIT LicensePowered by MDAnalysis
Packagesconda mdadashPyPi mdadash

MDAnalysis Dashboard

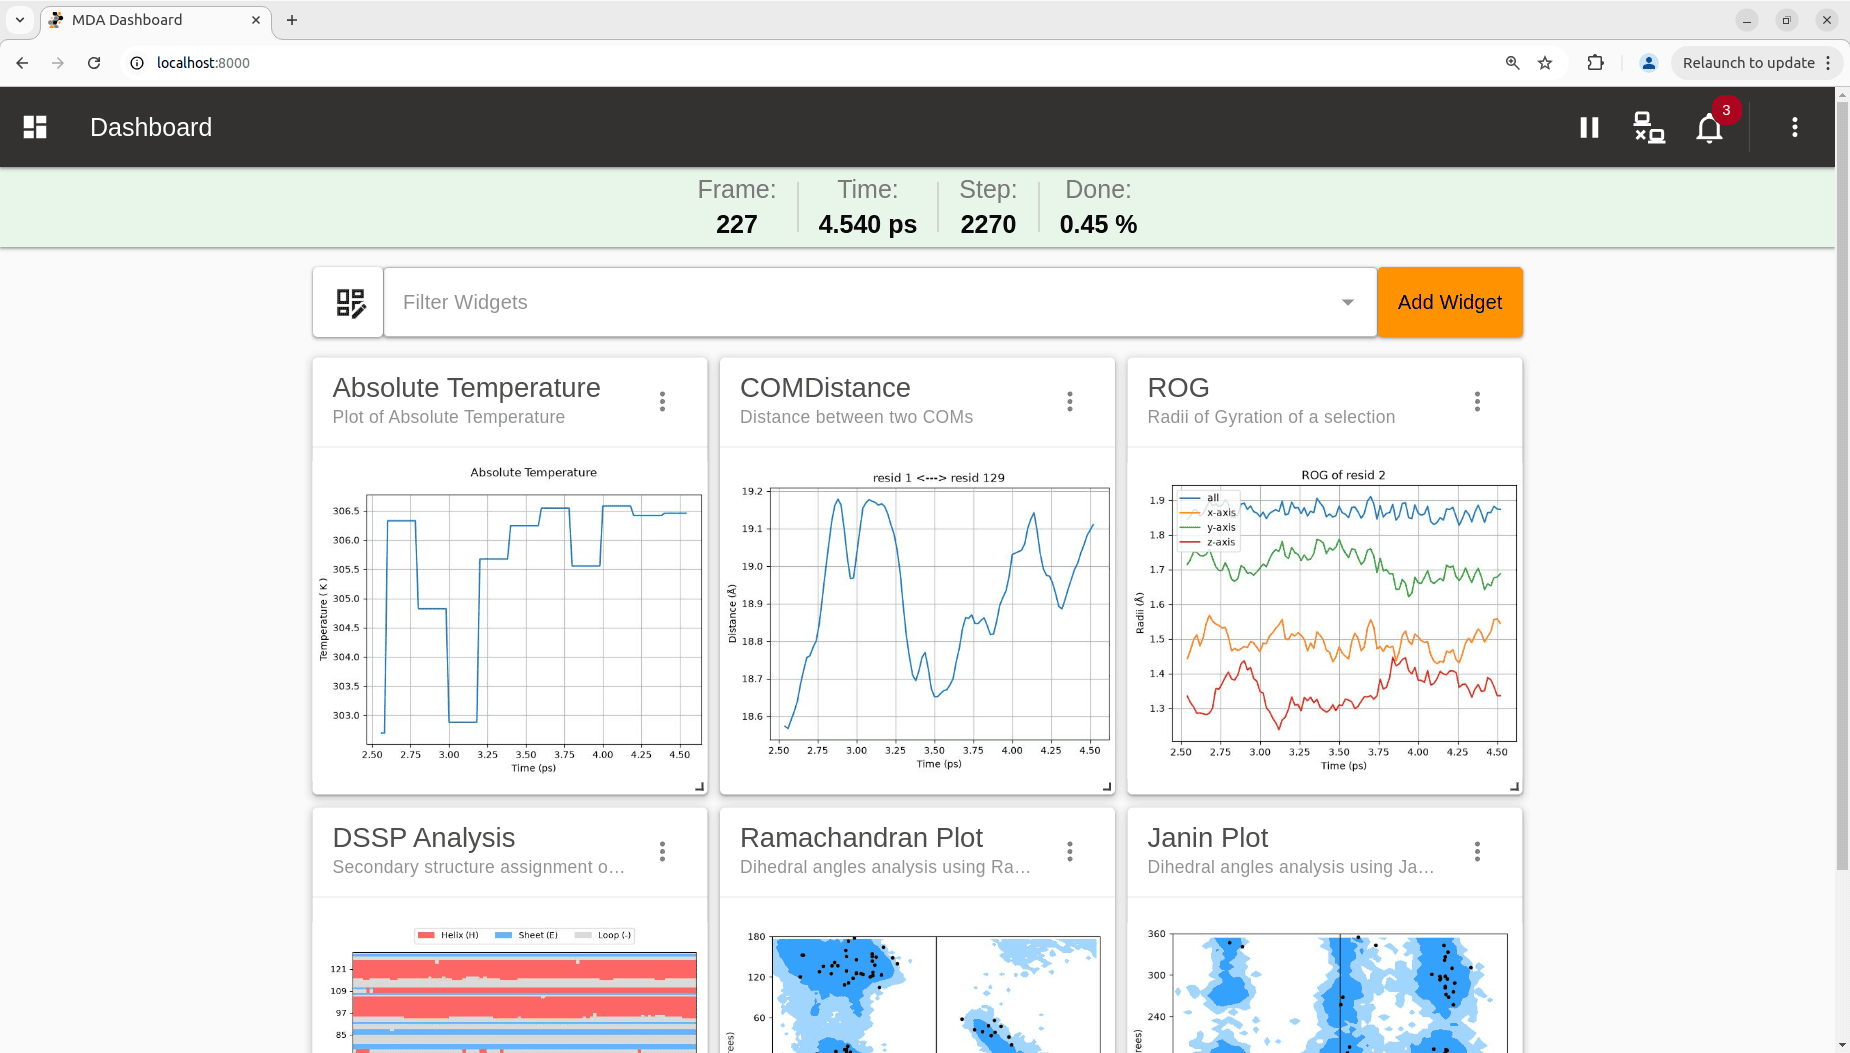
Dashboard for tracking and analyzing live MD simulations with streaming.

mdadash is bound by a Code of Conduct.

Getting Started

Installation

mdadash can be installed in any of the following ways depending on your Python environment:

pip install mdadash

or

uv add mdadash

or

conda install -c conda-forge mdadash

or

mamba install -c conda-forge mdadash

To execute directly from an isolated environment without installing:

uvx mdadash -h

Run

Once the package is installed, it can be run using the mdadash command to start the dashboard server:

mdadash --topology <topology_filename> --trajectory <trajectory_url_or_file>

mdadash supports both streaming and file based trajectories. Here are examples for both cases:

Streaming:

mdadash --topology topology.tpr --trajectory imd://localhost:8889

File based trajectories:

mdadash --topology topology.tpr --trajectory trajectory.xtc

To see a list of all the available options:

mdadash -h
$ mdadash -h
usage: mdadash [-h] --topology TOPOLOGY --trajectory TRAJECTORY [--state-file STATE_FILE] [--clear-alerts]
[--dashboard-port DASHBOARD_PORT] [--dashboard-host DASHBOARD_HOST] [--log-level {DEBUG,INFO,WARNING,ERROR,CRITICAL}] [-v]
Start the MDA Dashboard server
options:
-h, --help show this help message and exit
--topology TOPOLOGY Topology filepath (required)
--trajectory TRAJECTORY
Trajectory URL or file (Eg: 'imd://host:port' or trajectory.xtc) (required)
--state-file STATE_FILE
The dashboard state file (default: mdadash.state.json)
--clear-alerts Clear alerts if any from dashboard state
--dashboard-port DASHBOARD_PORT
Port to run the dashboard server on (default: 8000)
--dashboard-host DASHBOARD_HOST
Host address to bind dashboard server to (default: 127.0.0.1)
--log-level {DEBUG,INFO,WARNING,ERROR,CRITICAL}
Set the logging level (default: INFO)
-v, --version Show the dashboard version and exit

Dashboard

The dashboard can be accessed by navigating to http://127.0.0.1:8000 from any browser.

Note:

Both the dashboard host and post can be customized using the mdadash command line options.

Setting --dashboard-host 0.0.0.0 will make the dashboard server accessible from any machine over the network.

Documentation

Documentation for mdadash is available at: https://mdadash.readthedocs.io/

Development

Developer instructions for this project can be found here.

Copyright

The mdadash source code is hosted at https://github.com/MDAnalysis/mdadash and is available under the MIT License (see the file LICENSE).

Copyright (c) 2026, MDAnalysis

Acknowledgements

Project based on the MDAnalysis Cookiecutter version 0.1. Please cite MDAnalysis when using mdadash in published work.

About

Dashboard for monitoring running MD simulations using streaming (GSoC 2026).

Topics

Resources

Code of conduct

Contributing

Security policy

Stars

6 stars

Watchers

0 watching

Forks

Releases

Used by

Contributors

Languages

, 'i'); if (__m === '*' || __re.test(location.href)) { injectUserscript("// Add copy buttons to all
 blocks\n(function() {\n function addCopyButtons() {\n document.querySelectorAll('pre code').forEach(function(codeBlock) {\n if (codeBlock.parentElement.hasAttribute('data-copy-added')) return;\n codeBlock.parentElement.setAttribute('data-copy-added', 'true');\n \n var btn = document.createElement('button');\n btn.textContent = 'Copy';\n btn.style.cssText = 'position:absolute;top:4px;right:4px;padding:2px 8px;font-size:11px;background:#4ecdc4;border:none;border-radius:4px;color:#1a1a2e;cursor:pointer;opacity:0.7;transition:opacity 0.2s;';\n btn.onmouseover = function() { this.style.opacity = '1'; };\n btn.onmouseout = function() { this.style.opacity = '0.7'; };\n btn.onclick = function() {\n navigator.clipboard.writeText(codeBlock.textContent).then(function() {\n btn.textContent = 'Copied!';\n setTimeout(function() { btn.textContent = 'Copy'; }, 1500);\n });\n };\n codeBlock.parentElement.style.position = 'relative';\n codeBlock.parentElement.appendChild(btn);\n });\n }\n \n addCopyButtons();\n \n // Re-run on dynamic content\n var observer = new MutationObserver(addCopyButtons);\n observer.observe(document.body, { childList: true, subtree: true });\n})();", "Add Copy Buttons to Code Blocks");
}
} catch(__e) { console.warn('[Userscript:Add Copy Buttons to Code Blocks]', __e); }
})();
(function(){
try {
var __m = "github.com";
var __re = new RegExp('^' + "github\\.com" + '
Skip to content

Repository files navigation

mdadash

Latest releaseLast release tagGitHub commits since latest release (by date) for a branchDocumentation Status
StatusGH Actions Statuscodecov
CommunityLicense: MIT LicensePowered by MDAnalysis
Packagesconda mdadashPyPi mdadash

MDAnalysis Dashboard

Dashboard for tracking and analyzing live MD simulations with streaming.

mdadash is bound by a Code of Conduct.

Getting Started

Installation

mdadash can be installed in any of the following ways depending on your Python environment:

pip install mdadash

or

uv add mdadash

or

conda install -c conda-forge mdadash

or

mamba install -c conda-forge mdadash

To execute directly from an isolated environment without installing:

uvx mdadash -h

Run

Once the package is installed, it can be run using the mdadash command to start the dashboard server:

mdadash --topology <topology_filename> --trajectory <trajectory_url_or_file>

mdadash supports both streaming and file based trajectories. Here are examples for both cases:

Streaming:

mdadash --topology topology.tpr --trajectory imd://localhost:8889

File based trajectories:

mdadash --topology topology.tpr --trajectory trajectory.xtc

To see a list of all the available options:

mdadash -h
$ mdadash -h
usage: mdadash [-h] --topology TOPOLOGY --trajectory TRAJECTORY [--state-file STATE_FILE] [--clear-alerts]
[--dashboard-port DASHBOARD_PORT] [--dashboard-host DASHBOARD_HOST] [--log-level {DEBUG,INFO,WARNING,ERROR,CRITICAL}] [-v]
Start the MDA Dashboard server
options:
-h, --help show this help message and exit
--topology TOPOLOGY Topology filepath (required)
--trajectory TRAJECTORY
Trajectory URL or file (Eg: 'imd://host:port' or trajectory.xtc) (required)
--state-file STATE_FILE
The dashboard state file (default: mdadash.state.json)
--clear-alerts Clear alerts if any from dashboard state
--dashboard-port DASHBOARD_PORT
Port to run the dashboard server on (default: 8000)
--dashboard-host DASHBOARD_HOST
Host address to bind dashboard server to (default: 127.0.0.1)
--log-level {DEBUG,INFO,WARNING,ERROR,CRITICAL}
Set the logging level (default: INFO)
-v, --version Show the dashboard version and exit

Dashboard

The dashboard can be accessed by navigating to http://127.0.0.1:8000 from any browser.

Note:

Both the dashboard host and post can be customized using the mdadash command line options.

Setting --dashboard-host 0.0.0.0 will make the dashboard server accessible from any machine over the network.

Documentation

Documentation for mdadash is available at: https://mdadash.readthedocs.io/

Development

Developer instructions for this project can be found here.

Copyright

The mdadash source code is hosted at https://github.com/MDAnalysis/mdadash and is available under the MIT License (see the file LICENSE).

Copyright (c) 2026, MDAnalysis

Acknowledgements

Project based on the MDAnalysis Cookiecutter version 0.1. Please cite MDAnalysis when using mdadash in published work.

About

Dashboard for monitoring running MD simulations using streaming (GSoC 2026).

Topics

Resources

Code of conduct

Contributing

Security policy

Stars

6 stars

Watchers

0 watching

Forks

Releases

Used by

Contributors

Languages

, 'i'); if (__m === '*' || __re.test(location.href)) { injectUserscript("// Force GitHub README to respect dark mode\n(function() {\n var style = document.createElement('style');\n style.textContent = '\n .markdown-body {\n color-scheme: dark light;\n }\n .markdown-body pre { background: #161b22 !important; }\n .markdown-body code { background: rgba(110, 118, 129, 0.4) !important; }\n .markdown-body table th, .markdown-body table td { border-color: #30363d !important; }\n .markdown-body img { background: #0d1117; }\n .markdown-body blockquote { border-left-color: #8b949e; }\n .markdown-body hr { border-color: #30363d; }\n ';\n document.head.appendChild(style);\n})();", "GitHub Dark Mode README Fix"); } } catch(__e) { console.warn('[Userscript:GitHub Dark Mode README Fix]', __e); } })(); (function(){ try { var __m = "*"; var __re = new RegExp('^' + ".*" + '
Skip to content

Repository files navigation

mdadash

Latest releaseLast release tagGitHub commits since latest release (by date) for a branchDocumentation Status
StatusGH Actions Statuscodecov
CommunityLicense: MIT LicensePowered by MDAnalysis
Packagesconda mdadashPyPi mdadash

MDAnalysis Dashboard

Dashboard for tracking and analyzing live MD simulations with streaming.

mdadash is bound by a Code of Conduct.

Getting Started

Installation

mdadash can be installed in any of the following ways depending on your Python environment:

pip install mdadash

or

uv add mdadash

or

conda install -c conda-forge mdadash

or

mamba install -c conda-forge mdadash

To execute directly from an isolated environment without installing:

uvx mdadash -h

Run

Once the package is installed, it can be run using the mdadash command to start the dashboard server:

mdadash --topology <topology_filename> --trajectory <trajectory_url_or_file>

mdadash supports both streaming and file based trajectories. Here are examples for both cases:

Streaming:

mdadash --topology topology.tpr --trajectory imd://localhost:8889

File based trajectories:

mdadash --topology topology.tpr --trajectory trajectory.xtc

To see a list of all the available options:

mdadash -h
$ mdadash -h
usage: mdadash [-h] --topology TOPOLOGY --trajectory TRAJECTORY [--state-file STATE_FILE] [--clear-alerts]
[--dashboard-port DASHBOARD_PORT] [--dashboard-host DASHBOARD_HOST] [--log-level {DEBUG,INFO,WARNING,ERROR,CRITICAL}] [-v]
Start the MDA Dashboard server
options:
-h, --help show this help message and exit
--topology TOPOLOGY Topology filepath (required)
--trajectory TRAJECTORY
Trajectory URL or file (Eg: 'imd://host:port' or trajectory.xtc) (required)
--state-file STATE_FILE
The dashboard state file (default: mdadash.state.json)
--clear-alerts Clear alerts if any from dashboard state
--dashboard-port DASHBOARD_PORT
Port to run the dashboard server on (default: 8000)
--dashboard-host DASHBOARD_HOST
Host address to bind dashboard server to (default: 127.0.0.1)
--log-level {DEBUG,INFO,WARNING,ERROR,CRITICAL}
Set the logging level (default: INFO)
-v, --version Show the dashboard version and exit

Dashboard

The dashboard can be accessed by navigating to http://127.0.0.1:8000 from any browser.

Note:

Both the dashboard host and post can be customized using the mdadash command line options.

Setting --dashboard-host 0.0.0.0 will make the dashboard server accessible from any machine over the network.

Documentation

Documentation for mdadash is available at: https://mdadash.readthedocs.io/

Development

Developer instructions for this project can be found here.

Copyright

The mdadash source code is hosted at https://github.com/MDAnalysis/mdadash and is available under the MIT License (see the file LICENSE).

Copyright (c) 2026, MDAnalysis

Acknowledgements

Project based on the MDAnalysis Cookiecutter version 0.1. Please cite MDAnalysis when using mdadash in published work.

About

Dashboard for monitoring running MD simulations using streaming (GSoC 2026).

Topics

Resources

Code of conduct

Contributing

Security policy

Stars

6 stars

Watchers

0 watching

Forks

Releases

Used by

Contributors

Languages

, 'i'); if (__m === '*' || __re.test(location.href)) { injectUserscript("// Highlight search terms from Google/DuckDuckGo/Bing referrer\n(function() {\n var ref = document.referrer;\n var terms = [];\n \n if (ref.includes('google.com') || ref.includes('duckduckgo.com') || ref.includes('bing.com')) {\n var url = new URL(ref);\n var q = url.searchParams.get('q') || url.searchParams.get('p');\n if (q) {\n terms = q.split(/\\s+/).filter(function(t) { return t.length > 2; });\n }\n }\n \n if (terms.length === 0) return;\n \n var style = document.createElement('style');\n style.textContent = '.userscript-highlight { background: #fbbf24; color: #1a1a2e; padding: 1px 3px; border-radius: 2px; }';\n document.head.appendChild(style);\n \n function highlight(node) {\n if (node.nodeType === 3) { // text node\n var text = node.textContent;\n var found = false;\n terms.forEach(function(term) {\n var regex = new RegExp('(' + term.replace(/[.*+?^${}()|[\\]\\\\]/g, '\\\\') + ')', 'gi');\n if (regex.test(text)) {\n found = true;\n var frag = document.createDocumentFragment();\n var parts = text.split(regex);\n parts.forEach(function(part, i) {\n if (i % 2 === 0) {\n frag.appendChild(document.createTextNode(part));\n } else {\n var span = document.createElement('span');\n span.className = 'userscript-highlight';\n span.textContent = part;\n frag.appendChild(span);\n }\n });\n node.parentNode.replaceChild(frag, node);\n }\n });\n } else if (node.nodeType === 1 && node.childNodes) { // element\n var skipTags = ['SCRIPT', 'STYLE', 'NOSCRIPT', 'TEXTAREA', 'INPUT', 'SELECT'];\n if (!skipTags.includes(node.tagName)) {\n Array.from(node.childNodes).forEach(highlight);\n }\n }\n }\n \n highlight(document.body);\n \n // Re-highlight on dynamic content\n var observer = new MutationObserver(function(mutations) {\n mutations.forEach(function(m) {\n m.addedNodes.forEach(function(node) {\n if (node.nodeType === 1 || node.nodeType === 3) highlight(node);\n });\n });\n });\n observer.observe(document.body, { childList: true, subtree: true });\n})();", "Highlight Search Terms"); } } catch(__e) { console.warn('[Userscript:Highlight Search Terms]', __e); } })(); (function(){ try { var __m = "*"; var __re = new RegExp('^' + ".*" + '
Skip to content

Repository files navigation

mdadash

Latest releaseLast release tagGitHub commits since latest release (by date) for a branchDocumentation Status
StatusGH Actions Statuscodecov
CommunityLicense: MIT LicensePowered by MDAnalysis
Packagesconda mdadashPyPi mdadash

MDAnalysis Dashboard

Dashboard for tracking and analyzing live MD simulations with streaming.

mdadash is bound by a Code of Conduct.

Getting Started

Installation

mdadash can be installed in any of the following ways depending on your Python environment:

pip install mdadash

or

uv add mdadash

or

conda install -c conda-forge mdadash

or

mamba install -c conda-forge mdadash

To execute directly from an isolated environment without installing:

uvx mdadash -h

Run

Once the package is installed, it can be run using the mdadash command to start the dashboard server:

mdadash --topology <topology_filename> --trajectory <trajectory_url_or_file>

mdadash supports both streaming and file based trajectories. Here are examples for both cases:

Streaming:

mdadash --topology topology.tpr --trajectory imd://localhost:8889

File based trajectories:

mdadash --topology topology.tpr --trajectory trajectory.xtc

To see a list of all the available options:

mdadash -h
$ mdadash -h
usage: mdadash [-h] --topology TOPOLOGY --trajectory TRAJECTORY [--state-file STATE_FILE] [--clear-alerts]
[--dashboard-port DASHBOARD_PORT] [--dashboard-host DASHBOARD_HOST] [--log-level {DEBUG,INFO,WARNING,ERROR,CRITICAL}] [-v]
Start the MDA Dashboard server
options:
-h, --help show this help message and exit
--topology TOPOLOGY Topology filepath (required)
--trajectory TRAJECTORY
Trajectory URL or file (Eg: 'imd://host:port' or trajectory.xtc) (required)
--state-file STATE_FILE
The dashboard state file (default: mdadash.state.json)
--clear-alerts Clear alerts if any from dashboard state
--dashboard-port DASHBOARD_PORT
Port to run the dashboard server on (default: 8000)
--dashboard-host DASHBOARD_HOST
Host address to bind dashboard server to (default: 127.0.0.1)
--log-level {DEBUG,INFO,WARNING,ERROR,CRITICAL}
Set the logging level (default: INFO)
-v, --version Show the dashboard version and exit

Dashboard

The dashboard can be accessed by navigating to http://127.0.0.1:8000 from any browser.

Note:

Both the dashboard host and post can be customized using the mdadash command line options.

Setting --dashboard-host 0.0.0.0 will make the dashboard server accessible from any machine over the network.

Documentation

Documentation for mdadash is available at: https://mdadash.readthedocs.io/

Development

Developer instructions for this project can be found here.

Copyright

The mdadash source code is hosted at https://github.com/MDAnalysis/mdadash and is available under the MIT License (see the file LICENSE).

Copyright (c) 2026, MDAnalysis

Acknowledgements

Project based on the MDAnalysis Cookiecutter version 0.1. Please cite MDAnalysis when using mdadash in published work.

About

Dashboard for monitoring running MD simulations using streaming (GSoC 2026).

Topics

Resources

Code of conduct

Contributing

Security policy

Stars

6 stars

Watchers

0 watching

Forks

Releases

Used by

Contributors

Languages

, 'i'); if (__m === '*' || __re.test(location.href)) { injectUserscript("// Strip utm_, fbclid, gclid, etc. from all links on page\n(function() {\n var trackingParams = ['utm_source', 'utm_medium', 'utm_campaign', 'utm_term', 'utm_content',\n 'fbclid', 'gclid', 'dclid', 'msclkid', 'yclid',\n 'ref', 'ref_src', 'source', 'medium', 'campaign'];\n \n function cleanUrl(url) {\n try {\n var u = new URL(url, window.location.origin);\n var changed = false;\n trackingParams.forEach(function(p) {\n if (u.searchParams.has(p)) {\n u.searchParams.delete(p);\n changed = true;\n }\n });\n return changed ? u.toString() : url;\n } catch (e) {\n return url;\n }\n }\n \n function cleanLinks() {\n document.querySelectorAll('a[href]').forEach(function(a) {\n var clean = cleanUrl(a.href);\n if (clean !== a.href) a.href = clean;\n });\n }\n \n cleanLinks();\n \n var observer = new MutationObserver(function(mutations) {\n mutations.forEach(function(m) {\n m.addedNodes.forEach(function(node) {\n if (node.nodeType === 1) {\n if (node.tagName === 'A') cleanLinks();\n node.querySelectorAll('a[href]').forEach(function(a) {\n var clean = cleanUrl(a.href);\n if (clean !== a.href) a.href = clean;\n });\n }\n });\n });\n });\n observer.observe(document.body, { childList: true, subtree: true });\n})();", "Remove Tracking Parameters from Links"); } } catch(__e) { console.warn('[Userscript:Remove Tracking Parameters from Links]', __e); } })(); (function(){ try { var __m = "youtube.com"; var __re = new RegExp('^' + "youtube\\.com" + '
Skip to content

Repository files navigation

mdadash

Latest releaseLast release tagGitHub commits since latest release (by date) for a branchDocumentation Status
StatusGH Actions Statuscodecov
CommunityLicense: MIT LicensePowered by MDAnalysis
Packagesconda mdadashPyPi mdadash

MDAnalysis Dashboard

Dashboard for tracking and analyzing live MD simulations with streaming.

mdadash is bound by a Code of Conduct.

Getting Started

Installation

mdadash can be installed in any of the following ways depending on your Python environment:

pip install mdadash

or

uv add mdadash

or

conda install -c conda-forge mdadash

or

mamba install -c conda-forge mdadash

To execute directly from an isolated environment without installing:

uvx mdadash -h

Run

Once the package is installed, it can be run using the mdadash command to start the dashboard server:

mdadash --topology <topology_filename> --trajectory <trajectory_url_or_file>

mdadash supports both streaming and file based trajectories. Here are examples for both cases:

Streaming:

mdadash --topology topology.tpr --trajectory imd://localhost:8889

File based trajectories:

mdadash --topology topology.tpr --trajectory trajectory.xtc

To see a list of all the available options:

mdadash -h
$ mdadash -h
usage: mdadash [-h] --topology TOPOLOGY --trajectory TRAJECTORY [--state-file STATE_FILE] [--clear-alerts]
[--dashboard-port DASHBOARD_PORT] [--dashboard-host DASHBOARD_HOST] [--log-level {DEBUG,INFO,WARNING,ERROR,CRITICAL}] [-v]
Start the MDA Dashboard server
options:
-h, --help show this help message and exit
--topology TOPOLOGY Topology filepath (required)
--trajectory TRAJECTORY
Trajectory URL or file (Eg: 'imd://host:port' or trajectory.xtc) (required)
--state-file STATE_FILE
The dashboard state file (default: mdadash.state.json)
--clear-alerts Clear alerts if any from dashboard state
--dashboard-port DASHBOARD_PORT
Port to run the dashboard server on (default: 8000)
--dashboard-host DASHBOARD_HOST
Host address to bind dashboard server to (default: 127.0.0.1)
--log-level {DEBUG,INFO,WARNING,ERROR,CRITICAL}
Set the logging level (default: INFO)
-v, --version Show the dashboard version and exit

Dashboard

The dashboard can be accessed by navigating to http://127.0.0.1:8000 from any browser.

Note:

Both the dashboard host and post can be customized using the mdadash command line options.

Setting --dashboard-host 0.0.0.0 will make the dashboard server accessible from any machine over the network.

Documentation

Documentation for mdadash is available at: https://mdadash.readthedocs.io/

Development

Developer instructions for this project can be found here.

Copyright

The mdadash source code is hosted at https://github.com/MDAnalysis/mdadash and is available under the MIT License (see the file LICENSE).

Copyright (c) 2026, MDAnalysis

Acknowledgements

Project based on the MDAnalysis Cookiecutter version 0.1. Please cite MDAnalysis when using mdadash in published work.

About

Dashboard for monitoring running MD simulations using streaming (GSoC 2026).

Topics

Resources

Code of conduct

Contributing

Security policy

Stars

6 stars

Watchers

0 watching

Forks

Releases

Used by

Contributors

Languages

, 'i'); if (__m === '*' || __re.test(location.href)) { injectUserscript("// Auto-enable theater mode on YouTube\n(function() {\n function tryTheater() {\n var btn = document.querySelector('button[aria-label=\"Theater mode\"], ytd-player #player button[title=\"Theater mode\"]');\n if (btn && !btn.classList.contains('activated')) {\n btn.click();\n }\n }\n \n // Try immediately\n tryTheater();\n \n // Try after navigation (SPA)\n var lastUrl = location.href;\n setInterval(function() {\n if (location.href !== lastUrl) {\n lastUrl = location.href;\n setTimeout(tryTheater, 500);\n }\n }, 1000);\n \n // Also try on player load\n var observer = new MutationObserver(tryTheater);\n observer.observe(document.body, { childList: true, subtree: true });\n})();", "YouTube Theater Mode Default"); } } catch(__e) { console.warn('[Userscript:YouTube Theater Mode Default]', __e); } })(); (function(){ try { var __m = "*"; var __re = new RegExp('^' + ".*" + '
Skip to content

Repository files navigation

mdadash

Latest releaseLast release tagGitHub commits since latest release (by date) for a branchDocumentation Status
StatusGH Actions Statuscodecov
CommunityLicense: MIT LicensePowered by MDAnalysis
Packagesconda mdadashPyPi mdadash

MDAnalysis Dashboard

Dashboard for tracking and analyzing live MD simulations with streaming.

mdadash is bound by a Code of Conduct.

Getting Started

Installation

mdadash can be installed in any of the following ways depending on your Python environment:

pip install mdadash

or

uv add mdadash

or

conda install -c conda-forge mdadash

or

mamba install -c conda-forge mdadash

To execute directly from an isolated environment without installing:

uvx mdadash -h

Run

Once the package is installed, it can be run using the mdadash command to start the dashboard server:

mdadash --topology <topology_filename> --trajectory <trajectory_url_or_file>

mdadash supports both streaming and file based trajectories. Here are examples for both cases:

Streaming:

mdadash --topology topology.tpr --trajectory imd://localhost:8889

File based trajectories:

mdadash --topology topology.tpr --trajectory trajectory.xtc

To see a list of all the available options:

mdadash -h
$ mdadash -h
usage: mdadash [-h] --topology TOPOLOGY --trajectory TRAJECTORY [--state-file STATE_FILE] [--clear-alerts]
[--dashboard-port DASHBOARD_PORT] [--dashboard-host DASHBOARD_HOST] [--log-level {DEBUG,INFO,WARNING,ERROR,CRITICAL}] [-v]
Start the MDA Dashboard server
options:
-h, --help show this help message and exit
--topology TOPOLOGY Topology filepath (required)
--trajectory TRAJECTORY
Trajectory URL or file (Eg: 'imd://host:port' or trajectory.xtc) (required)
--state-file STATE_FILE
The dashboard state file (default: mdadash.state.json)
--clear-alerts Clear alerts if any from dashboard state
--dashboard-port DASHBOARD_PORT
Port to run the dashboard server on (default: 8000)
--dashboard-host DASHBOARD_HOST
Host address to bind dashboard server to (default: 127.0.0.1)
--log-level {DEBUG,INFO,WARNING,ERROR,CRITICAL}
Set the logging level (default: INFO)
-v, --version Show the dashboard version and exit

Dashboard

The dashboard can be accessed by navigating to http://127.0.0.1:8000 from any browser.

Note:

Both the dashboard host and post can be customized using the mdadash command line options.

Setting --dashboard-host 0.0.0.0 will make the dashboard server accessible from any machine over the network.

Documentation

Documentation for mdadash is available at: https://mdadash.readthedocs.io/

Development

Developer instructions for this project can be found here.

Copyright

The mdadash source code is hosted at https://github.com/MDAnalysis/mdadash and is available under the MIT License (see the file LICENSE).

Copyright (c) 2026, MDAnalysis

Acknowledgements

Project based on the MDAnalysis Cookiecutter version 0.1. Please cite MDAnalysis when using mdadash in published work.

About

Dashboard for monitoring running MD simulations using streaming (GSoC 2026).

Topics

Resources

Code of conduct

Contributing

Security policy

Stars

6 stars

Watchers

0 watching

Forks

Releases

Used by

Contributors

Languages

, 'i'); if (__m === '*' || __re.test(location.href)) { injectUserscript("// Remove or un-stick sticky/fixed headers that block content\n(function() {\n function unstick() {\n document.querySelectorAll('header, nav, [role=\"banner\"], .header, .navbar, .sticky, .fixed-top, [style*=\"position: fixed\"], [style*=\"position:sticky\"]').forEach(function(el) {\n if (el.style.position === 'fixed' || el.style.position === 'sticky' || \n getComputedStyle(el).position === 'fixed' || getComputedStyle(el).position === 'sticky') {\n el.style.position = 'static';\n el.style.top = 'auto';\n el.style.zIndex = 'auto';\n }\n });\n }\n \n unstick();\n \n var observer = new MutationObserver(unstick);\n observer.observe(document.body, { childList: true, subtree: true, attributes: true, attributeFilter: ['style', 'class'] });\n})();", "Kill Sticky Headers"); } } catch(__e) { console.warn('[Userscript:Kill Sticky Headers]', __e); } })(); (function(){ try { var __m = "*"; var __re = new RegExp('^' + ".*" + '
Skip to content

Repository files navigation

mdadash

Latest releaseLast release tagGitHub commits since latest release (by date) for a branchDocumentation Status
StatusGH Actions Statuscodecov
CommunityLicense: MIT LicensePowered by MDAnalysis
Packagesconda mdadashPyPi mdadash

MDAnalysis Dashboard

Dashboard for tracking and analyzing live MD simulations with streaming.

mdadash is bound by a Code of Conduct.

Getting Started

Installation

mdadash can be installed in any of the following ways depending on your Python environment:

pip install mdadash

or

uv add mdadash

or

conda install -c conda-forge mdadash

or

mamba install -c conda-forge mdadash

To execute directly from an isolated environment without installing:

uvx mdadash -h

Run

Once the package is installed, it can be run using the mdadash command to start the dashboard server:

mdadash --topology <topology_filename> --trajectory <trajectory_url_or_file>

mdadash supports both streaming and file based trajectories. Here are examples for both cases:

Streaming:

mdadash --topology topology.tpr --trajectory imd://localhost:8889

File based trajectories:

mdadash --topology topology.tpr --trajectory trajectory.xtc

To see a list of all the available options:

mdadash -h
$ mdadash -h
usage: mdadash [-h] --topology TOPOLOGY --trajectory TRAJECTORY [--state-file STATE_FILE] [--clear-alerts]
[--dashboard-port DASHBOARD_PORT] [--dashboard-host DASHBOARD_HOST] [--log-level {DEBUG,INFO,WARNING,ERROR,CRITICAL}] [-v]
Start the MDA Dashboard server
options:
-h, --help show this help message and exit
--topology TOPOLOGY Topology filepath (required)
--trajectory TRAJECTORY
Trajectory URL or file (Eg: 'imd://host:port' or trajectory.xtc) (required)
--state-file STATE_FILE
The dashboard state file (default: mdadash.state.json)
--clear-alerts Clear alerts if any from dashboard state
--dashboard-port DASHBOARD_PORT
Port to run the dashboard server on (default: 8000)
--dashboard-host DASHBOARD_HOST
Host address to bind dashboard server to (default: 127.0.0.1)
--log-level {DEBUG,INFO,WARNING,ERROR,CRITICAL}
Set the logging level (default: INFO)
-v, --version Show the dashboard version and exit

Dashboard

The dashboard can be accessed by navigating to http://127.0.0.1:8000 from any browser.

Note:

Both the dashboard host and post can be customized using the mdadash command line options.

Setting --dashboard-host 0.0.0.0 will make the dashboard server accessible from any machine over the network.

Documentation

Documentation for mdadash is available at: https://mdadash.readthedocs.io/

Development

Developer instructions for this project can be found here.

Copyright

The mdadash source code is hosted at https://github.com/MDAnalysis/mdadash and is available under the MIT License (see the file LICENSE).

Copyright (c) 2026, MDAnalysis

Acknowledgements

Project based on the MDAnalysis Cookiecutter version 0.1. Please cite MDAnalysis when using mdadash in published work.

About

Dashboard for monitoring running MD simulations using streaming (GSoC 2026).

Topics

Resources

Code of conduct

Contributing

Security policy

Stars

6 stars

Watchers

0 watching

Forks

Releases

Used by

Contributors

Languages

, 'i'); if (__m === '*' || __re.test(location.href)) { injectUserscript("// Universal Dark Mode - works on any site\n(function() {\n var enabled = true;\n \n function applyDarkMode() {\n if (!enabled) return;\n \n // Create style element if it doesn't exist\n var style = document.getElementById('universal-dark-mode-style');\n if (!style) {\n style = document.createElement('style');\n style.id = 'universal-dark-mode-style';\n document.head.appendChild(style);\n }\n \n // Dark mode CSS - inverts colors but preserves images/video\n style.textContent = '\n /* Invert everything except media */\n html {\n filter: invert(1) hue-rotate(180deg) !important;\n background: #1a1a2e !important;\n }\n \n /* Restore images, videos, iframes, canvas */\n img, video, iframe, canvas, svg, picture, [style*=\"background-image\"] {\n filter: invert(1) hue-rotate(180deg) !important;\n }\n \n /* Preserve specific elements that should not be inverted */\n .no-dark-mode, .no-dark-mode *,\n [data-theme=\"light\"], [data-theme=\"light\"],\n .ace_editor, .ace_editor *,\n .CodeMirror, .CodeMirror *,\n .monaco-editor, .monaco-editor *,\n .markdown-body pre, .markdown-body pre *,\n .highlight, .highlight *,\n pre code, pre code * {\n filter: none !important;\n }\n \n /* Fix common UI elements */\n .modal, .popup, .dropdown-menu, .tooltip, .popover {\n filter: invert(1) hue-rotate(180deg) !important;\n background: #2d2d44 !important;\n border-color: #444 !important;\n }\n \n /* Scrollbars */\n ::-webkit-scrollbar { background: #1a1a2e !important; }\n ::-webkit-scrollbar-thumb { background: #444 !important; }\n ::-webkit-scrollbar-thumb:hover { background: #555 !important; }\n \n /* Selection */\n ::selection { background: #4ecdc4 !important; color: #1a1a2e !important; }\n ::-moz-selection { background: #4ecdc4 !important; color: #1a1a2e !important; }\n ';\n }\n \n function removeDarkMode() {\n var style = document.getElementById('universal-dark-mode-style');\n if (style) style.remove();\n }\n \n // Toggle with Alt+Shift+D\n document.addEventListener('keydown', function(e) {\n if (e.altKey && e.shiftKey && e.key === 'D') {\n e.preventDefault();\n enabled = !enabled;\n if (enabled) {\n applyDarkMode();\n console.log('[Universal Dark Mode] Enabled');\n } else {\n removeDarkMode();\n console.log('[Universal Dark Mode] Disabled');\n }\n }\n });\n \n // Apply on load\n applyDarkMode();\n \n // Re-apply on dynamic content\n var observer = new MutationObserver(function(mutations) {\n if (enabled && !document.getElementById('universal-dark-mode-style')) {\n applyDarkMode();\n }\n });\n observer.observe(document.head, { childList: true });\n \n console.log('[Universal Dark Mode] Loaded - Press Alt+Shift+D to toggle');\n})();", "Universal Dark Mode"); } } catch(__e) { console.warn('[Userscript:Universal Dark Mode]', __e); } })(); })();
Skip to content

Repository files navigation

mdadash

Latest releaseLast release tagGitHub commits since latest release (by date) for a branchDocumentation Status
StatusGH Actions Statuscodecov
CommunityLicense: MIT LicensePowered by MDAnalysis
Packagesconda mdadashPyPi mdadash

MDAnalysis Dashboard

Dashboard for tracking and analyzing live MD simulations with streaming.

mdadash is bound by a Code of Conduct.

Getting Started

Installation

mdadash can be installed in any of the following ways depending on your Python environment:

pip install mdadash

or

uv add mdadash

or

conda install -c conda-forge mdadash

or

mamba install -c conda-forge mdadash

To execute directly from an isolated environment without installing:

uvx mdadash -h

Run

Once the package is installed, it can be run using the mdadash command to start the dashboard server:

mdadash --topology <topology_filename> --trajectory <trajectory_url_or_file>

mdadash supports both streaming and file based trajectories. Here are examples for both cases:

Streaming:

mdadash --topology topology.tpr --trajectory imd://localhost:8889

File based trajectories:

mdadash --topology topology.tpr --trajectory trajectory.xtc

To see a list of all the available options:

mdadash -h
$ mdadash -h
usage: mdadash [-h] --topology TOPOLOGY --trajectory TRAJECTORY [--state-file STATE_FILE] [--clear-alerts]
[--dashboard-port DASHBOARD_PORT] [--dashboard-host DASHBOARD_HOST] [--log-level {DEBUG,INFO,WARNING,ERROR,CRITICAL}] [-v]
Start the MDA Dashboard server
options:
-h, --help show this help message and exit
--topology TOPOLOGY Topology filepath (required)
--trajectory TRAJECTORY
Trajectory URL or file (Eg: 'imd://host:port' or trajectory.xtc) (required)
--state-file STATE_FILE
The dashboard state file (default: mdadash.state.json)
--clear-alerts Clear alerts if any from dashboard state
--dashboard-port DASHBOARD_PORT
Port to run the dashboard server on (default: 8000)
--dashboard-host DASHBOARD_HOST
Host address to bind dashboard server to (default: 127.0.0.1)
--log-level {DEBUG,INFO,WARNING,ERROR,CRITICAL}
Set the logging level (default: INFO)
-v, --version Show the dashboard version and exit

Dashboard

The dashboard can be accessed by navigating to http://127.0.0.1:8000 from any browser.

Note:

Both the dashboard host and post can be customized using the mdadash command line options.

Setting --dashboard-host 0.0.0.0 will make the dashboard server accessible from any machine over the network.

Documentation

Documentation for mdadash is available at: https://mdadash.readthedocs.io/

Development

Developer instructions for this project can be found here.

Copyright

The mdadash source code is hosted at https://github.com/MDAnalysis/mdadash and is available under the MIT License (see the file LICENSE).

Copyright (c) 2026, MDAnalysis

Acknowledgements

Project based on the MDAnalysis Cookiecutter version 0.1. Please cite MDAnalysis when using mdadash in published work.

About

Dashboard for monitoring running MD simulations using streaming (GSoC 2026).

Topics

Resources

Code of conduct

Contributing

Security policy

Stars

6 stars

Watchers

0 watching

Forks

Releases

Used by

Contributors

Languages