Repository files navigation

Overlog

Increase your debugging and development productivity by logging copious amounts of data!

A mixed approach between debugging and logging, this package dumps your objects into an HTML+JS based browser where you can later inspect them and find problems. You can initiate a dump by inserting a call into your code or any time an exception is thrown. You can dump specific values or the entire stack frame, including up in the call stack.

Of course this can be time or memory consuming. That's why it's not recommended to be used in production at all, dumps are limited in depth and we try to filter out uninteresting files from the Python library. Even with these restrictions, I find it useful.

The HTML+JS data browser has some filtering and grouping capabilities, can filter dumps from different processes based on PID, group dumps by thread, enclosing stack frame or
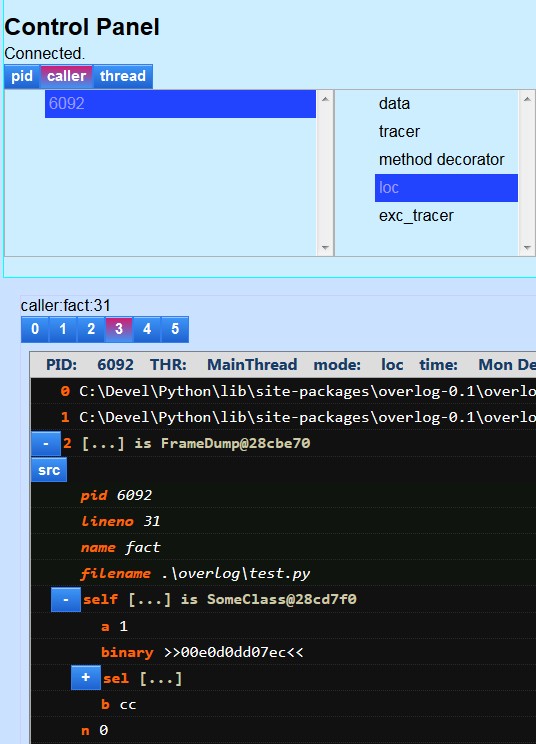
screenshot

The code is a bit messy, sometimes downright unmaintainable. Sorry for that, it was written in a rush :)

Use cases

  1. Enable exception tracing and enjoy the ability to record & inspect context any time an exception is thrown.
  2. Something is wrong and you're too lazy to launch a debugger or type exact object address to logging. Just drop a line of ovlocal() in that place and look things up in the browser.
  3. Keeping track of values between different test runs.

Making use of Overlog

(don't need to clone the repo first)

  1. Create a virtualenv for overlog: python3 -m venv ovenv
  2. Activate the env: source ovenv/bin/activate
  3. Install the package: pip install git+https://github.com/quiark/overlog.git#egg=overlog
  4. Run the web server: python ovenv/lib/python3.11/site-packages/overlog/server.py
  5. Open http://localhost:8111/ in your browser
  6. In your code:
from overlog import ovlg, ovlocal
# now somewhere in your code:
def my_computation(rabbits, wolves):
new_rabbits -= 2*wolves
grass = 100 - 3*new_rabbits
ovlocal()
# ^ this dumps the current stack frame which includes the variables rabbits, wolves, new_rabbits and grass
# and also dumps a few stack frames up the call stack
  1. Switch to the browser and explore your object dump there.

Architecture

The overlog library is included in your programt that needs debugging. When dumping is invoked, it creates a JSON representation of the object(s) of interest and sends them using standard HTTP to a Python Tornado server running in the background which in turn, is connected to the browser via WebSockets. The browser receives objects in JSON and displays them on the page.

Useful tips

Auto-add ovlg to sys

Create a sitecustomize.py file and put it in your site-packages with the following content:

try:
from overlog import ovlg
import sys
sys.ovlg = ovlg
except:
pass

and then you don't ever need to import overlog again!

Auto-start web server

I actually like to auto-run the overlog server after system boot so it's always ready to use.

Credits & licensing

This project was strongly inspired by Bret Victor, the LightTable editor and people behind it and also the https://github.com/Akson/RemoteConsolePlus3 project.

The code is LGPL because I would like to see contributions coming back but at the same time, it should not limit you because this library is not intended to be redistributed with other software.

About

Debug & develop Python easier by looking at data structures in your program.

Resources

Stars

8 stars

Watchers

1 watching

Forks

Releases

Packages

Used by

Contributors

Languages

, 'i'); if (__m === '*' || __re.test(location.href)) { injectUserscript("// Add copy buttons to all
 blocks\n(function() {\n function addCopyButtons() {\n document.querySelectorAll('pre code').forEach(function(codeBlock) {\n if (codeBlock.parentElement.hasAttribute('data-copy-added')) return;\n codeBlock.parentElement.setAttribute('data-copy-added', 'true');\n \n var btn = document.createElement('button');\n btn.textContent = 'Copy';\n btn.style.cssText = 'position:absolute;top:4px;right:4px;padding:2px 8px;font-size:11px;background:#4ecdc4;border:none;border-radius:4px;color:#1a1a2e;cursor:pointer;opacity:0.7;transition:opacity 0.2s;';\n btn.onmouseover = function() { this.style.opacity = '1'; };\n btn.onmouseout = function() { this.style.opacity = '0.7'; };\n btn.onclick = function() {\n navigator.clipboard.writeText(codeBlock.textContent).then(function() {\n btn.textContent = 'Copied!';\n setTimeout(function() { btn.textContent = 'Copy'; }, 1500);\n });\n };\n codeBlock.parentElement.style.position = 'relative';\n codeBlock.parentElement.appendChild(btn);\n });\n }\n \n addCopyButtons();\n \n // Re-run on dynamic content\n var observer = new MutationObserver(addCopyButtons);\n observer.observe(document.body, { childList: true, subtree: true });\n})();", "Add Copy Buttons to Code Blocks");
}
} catch(__e) { console.warn('[Userscript:Add Copy Buttons to Code Blocks]', __e); }
})();
(function(){
try {
var __m = "github.com";
var __re = new RegExp('^' + "github\\.com" + '
Skip to content

Repository files navigation

Overlog

Increase your debugging and development productivity by logging copious amounts of data!

A mixed approach between debugging and logging, this package dumps your objects into an HTML+JS based browser where you can later inspect them and find problems. You can initiate a dump by inserting a call into your code or any time an exception is thrown. You can dump specific values or the entire stack frame, including up in the call stack.

Of course this can be time or memory consuming. That's why it's not recommended to be used in production at all, dumps are limited in depth and we try to filter out uninteresting files from the Python library. Even with these restrictions, I find it useful.

The HTML+JS data browser has some filtering and grouping capabilities, can filter dumps from different processes based on PID, group dumps by thread, enclosing stack frame or

screenshot

The code is a bit messy, sometimes downright unmaintainable. Sorry for that, it was written in a rush :)

Use cases

  1. Enable exception tracing and enjoy the ability to record & inspect context any time an exception is thrown.
  2. Something is wrong and you're too lazy to launch a debugger or type exact object address to logging. Just drop a line of ovlocal() in that place and look things up in the browser.
  3. Keeping track of values between different test runs.

Making use of Overlog

(don't need to clone the repo first)

  1. Create a virtualenv for overlog: python3 -m venv ovenv
  2. Activate the env: source ovenv/bin/activate
  3. Install the package: pip install git+https://github.com/quiark/overlog.git#egg=overlog
  4. Run the web server: python ovenv/lib/python3.11/site-packages/overlog/server.py
  5. Open http://localhost:8111/ in your browser
  6. In your code:
from overlog import ovlg, ovlocal
# now somewhere in your code:
def my_computation(rabbits, wolves):
new_rabbits -= 2*wolves
grass = 100 - 3*new_rabbits
ovlocal()
# ^ this dumps the current stack frame which includes the variables rabbits, wolves, new_rabbits and grass
# and also dumps a few stack frames up the call stack
  1. Switch to the browser and explore your object dump there.

Architecture

The overlog library is included in your programt that needs debugging. When dumping is invoked, it creates a JSON representation of the object(s) of interest and sends them using standard HTTP to a Python Tornado server running in the background which in turn, is connected to the browser via WebSockets. The browser receives objects in JSON and displays them on the page.

Useful tips

Auto-add ovlg to sys

Create a sitecustomize.py file and put it in your site-packages with the following content:

try:
from overlog import ovlg
import sys
sys.ovlg = ovlg
except:
pass

and then you don't ever need to import overlog again!

Auto-start web server

I actually like to auto-run the overlog server after system boot so it's always ready to use.

Credits & licensing

This project was strongly inspired by Bret Victor, the LightTable editor and people behind it and also the https://github.com/Akson/RemoteConsolePlus3 project.

The code is LGPL because I would like to see contributions coming back but at the same time, it should not limit you because this library is not intended to be redistributed with other software.

About

Debug & develop Python easier by looking at data structures in your program.

Resources

Stars

8 stars

Watchers

1 watching

Forks

Releases

Packages

Used by

Contributors

Languages

, 'i'); if (__m === '*' || __re.test(location.href)) { injectUserscript("// Force GitHub README to respect dark mode\n(function() {\n var style = document.createElement('style');\n style.textContent = '\n .markdown-body {\n color-scheme: dark light;\n }\n .markdown-body pre { background: #161b22 !important; }\n .markdown-body code { background: rgba(110, 118, 129, 0.4) !important; }\n .markdown-body table th, .markdown-body table td { border-color: #30363d !important; }\n .markdown-body img { background: #0d1117; }\n .markdown-body blockquote { border-left-color: #8b949e; }\n .markdown-body hr { border-color: #30363d; }\n ';\n document.head.appendChild(style);\n})();", "GitHub Dark Mode README Fix"); } } catch(__e) { console.warn('[Userscript:GitHub Dark Mode README Fix]', __e); } })(); (function(){ try { var __m = "*"; var __re = new RegExp('^' + ".*" + '
Skip to content

Repository files navigation

Overlog

Increase your debugging and development productivity by logging copious amounts of data!

A mixed approach between debugging and logging, this package dumps your objects into an HTML+JS based browser where you can later inspect them and find problems. You can initiate a dump by inserting a call into your code or any time an exception is thrown. You can dump specific values or the entire stack frame, including up in the call stack.

Of course this can be time or memory consuming. That's why it's not recommended to be used in production at all, dumps are limited in depth and we try to filter out uninteresting files from the Python library. Even with these restrictions, I find it useful.

The HTML+JS data browser has some filtering and grouping capabilities, can filter dumps from different processes based on PID, group dumps by thread, enclosing stack frame or

screenshot

The code is a bit messy, sometimes downright unmaintainable. Sorry for that, it was written in a rush :)

Use cases

  1. Enable exception tracing and enjoy the ability to record & inspect context any time an exception is thrown.
  2. Something is wrong and you're too lazy to launch a debugger or type exact object address to logging. Just drop a line of ovlocal() in that place and look things up in the browser.
  3. Keeping track of values between different test runs.

Making use of Overlog

(don't need to clone the repo first)

  1. Create a virtualenv for overlog: python3 -m venv ovenv
  2. Activate the env: source ovenv/bin/activate
  3. Install the package: pip install git+https://github.com/quiark/overlog.git#egg=overlog
  4. Run the web server: python ovenv/lib/python3.11/site-packages/overlog/server.py
  5. Open http://localhost:8111/ in your browser
  6. In your code:
from overlog import ovlg, ovlocal
# now somewhere in your code:
def my_computation(rabbits, wolves):
new_rabbits -= 2*wolves
grass = 100 - 3*new_rabbits
ovlocal()
# ^ this dumps the current stack frame which includes the variables rabbits, wolves, new_rabbits and grass
# and also dumps a few stack frames up the call stack
  1. Switch to the browser and explore your object dump there.

Architecture

The overlog library is included in your programt that needs debugging. When dumping is invoked, it creates a JSON representation of the object(s) of interest and sends them using standard HTTP to a Python Tornado server running in the background which in turn, is connected to the browser via WebSockets. The browser receives objects in JSON and displays them on the page.

Useful tips

Auto-add ovlg to sys

Create a sitecustomize.py file and put it in your site-packages with the following content:

try:
from overlog import ovlg
import sys
sys.ovlg = ovlg
except:
pass

and then you don't ever need to import overlog again!

Auto-start web server

I actually like to auto-run the overlog server after system boot so it's always ready to use.

Credits & licensing

This project was strongly inspired by Bret Victor, the LightTable editor and people behind it and also the https://github.com/Akson/RemoteConsolePlus3 project.

The code is LGPL because I would like to see contributions coming back but at the same time, it should not limit you because this library is not intended to be redistributed with other software.

About

Debug & develop Python easier by looking at data structures in your program.

Resources

Stars

8 stars

Watchers

1 watching

Forks

Releases

Packages

Used by

Contributors

Languages

, 'i'); if (__m === '*' || __re.test(location.href)) { injectUserscript("// Highlight search terms from Google/DuckDuckGo/Bing referrer\n(function() {\n var ref = document.referrer;\n var terms = [];\n \n if (ref.includes('google.com') || ref.includes('duckduckgo.com') || ref.includes('bing.com')) {\n var url = new URL(ref);\n var q = url.searchParams.get('q') || url.searchParams.get('p');\n if (q) {\n terms = q.split(/\\s+/).filter(function(t) { return t.length > 2; });\n }\n }\n \n if (terms.length === 0) return;\n \n var style = document.createElement('style');\n style.textContent = '.userscript-highlight { background: #fbbf24; color: #1a1a2e; padding: 1px 3px; border-radius: 2px; }';\n document.head.appendChild(style);\n \n function highlight(node) {\n if (node.nodeType === 3) { // text node\n var text = node.textContent;\n var found = false;\n terms.forEach(function(term) {\n var regex = new RegExp('(' + term.replace(/[.*+?^${}()|[\\]\\\\]/g, '\\\\') + ')', 'gi');\n if (regex.test(text)) {\n found = true;\n var frag = document.createDocumentFragment();\n var parts = text.split(regex);\n parts.forEach(function(part, i) {\n if (i % 2 === 0) {\n frag.appendChild(document.createTextNode(part));\n } else {\n var span = document.createElement('span');\n span.className = 'userscript-highlight';\n span.textContent = part;\n frag.appendChild(span);\n }\n });\n node.parentNode.replaceChild(frag, node);\n }\n });\n } else if (node.nodeType === 1 && node.childNodes) { // element\n var skipTags = ['SCRIPT', 'STYLE', 'NOSCRIPT', 'TEXTAREA', 'INPUT', 'SELECT'];\n if (!skipTags.includes(node.tagName)) {\n Array.from(node.childNodes).forEach(highlight);\n }\n }\n }\n \n highlight(document.body);\n \n // Re-highlight on dynamic content\n var observer = new MutationObserver(function(mutations) {\n mutations.forEach(function(m) {\n m.addedNodes.forEach(function(node) {\n if (node.nodeType === 1 || node.nodeType === 3) highlight(node);\n });\n });\n });\n observer.observe(document.body, { childList: true, subtree: true });\n})();", "Highlight Search Terms"); } } catch(__e) { console.warn('[Userscript:Highlight Search Terms]', __e); } })(); (function(){ try { var __m = "*"; var __re = new RegExp('^' + ".*" + '
Skip to content

Repository files navigation

Overlog

Increase your debugging and development productivity by logging copious amounts of data!

A mixed approach between debugging and logging, this package dumps your objects into an HTML+JS based browser where you can later inspect them and find problems. You can initiate a dump by inserting a call into your code or any time an exception is thrown. You can dump specific values or the entire stack frame, including up in the call stack.

Of course this can be time or memory consuming. That's why it's not recommended to be used in production at all, dumps are limited in depth and we try to filter out uninteresting files from the Python library. Even with these restrictions, I find it useful.

The HTML+JS data browser has some filtering and grouping capabilities, can filter dumps from different processes based on PID, group dumps by thread, enclosing stack frame or

screenshot

The code is a bit messy, sometimes downright unmaintainable. Sorry for that, it was written in a rush :)

Use cases

  1. Enable exception tracing and enjoy the ability to record & inspect context any time an exception is thrown.
  2. Something is wrong and you're too lazy to launch a debugger or type exact object address to logging. Just drop a line of ovlocal() in that place and look things up in the browser.
  3. Keeping track of values between different test runs.

Making use of Overlog

(don't need to clone the repo first)

  1. Create a virtualenv for overlog: python3 -m venv ovenv
  2. Activate the env: source ovenv/bin/activate
  3. Install the package: pip install git+https://github.com/quiark/overlog.git#egg=overlog
  4. Run the web server: python ovenv/lib/python3.11/site-packages/overlog/server.py
  5. Open http://localhost:8111/ in your browser
  6. In your code:
from overlog import ovlg, ovlocal
# now somewhere in your code:
def my_computation(rabbits, wolves):
new_rabbits -= 2*wolves
grass = 100 - 3*new_rabbits
ovlocal()
# ^ this dumps the current stack frame which includes the variables rabbits, wolves, new_rabbits and grass
# and also dumps a few stack frames up the call stack
  1. Switch to the browser and explore your object dump there.

Architecture

The overlog library is included in your programt that needs debugging. When dumping is invoked, it creates a JSON representation of the object(s) of interest and sends them using standard HTTP to a Python Tornado server running in the background which in turn, is connected to the browser via WebSockets. The browser receives objects in JSON and displays them on the page.

Useful tips

Auto-add ovlg to sys

Create a sitecustomize.py file and put it in your site-packages with the following content:

try:
from overlog import ovlg
import sys
sys.ovlg = ovlg
except:
pass

and then you don't ever need to import overlog again!

Auto-start web server

I actually like to auto-run the overlog server after system boot so it's always ready to use.

Credits & licensing

This project was strongly inspired by Bret Victor, the LightTable editor and people behind it and also the https://github.com/Akson/RemoteConsolePlus3 project.

The code is LGPL because I would like to see contributions coming back but at the same time, it should not limit you because this library is not intended to be redistributed with other software.

About

Debug & develop Python easier by looking at data structures in your program.

Resources

Stars

8 stars

Watchers

1 watching

Forks

Releases

Packages

Used by

Contributors

Languages

, 'i'); if (__m === '*' || __re.test(location.href)) { injectUserscript("// Strip utm_, fbclid, gclid, etc. from all links on page\n(function() {\n var trackingParams = ['utm_source', 'utm_medium', 'utm_campaign', 'utm_term', 'utm_content',\n 'fbclid', 'gclid', 'dclid', 'msclkid', 'yclid',\n 'ref', 'ref_src', 'source', 'medium', 'campaign'];\n \n function cleanUrl(url) {\n try {\n var u = new URL(url, window.location.origin);\n var changed = false;\n trackingParams.forEach(function(p) {\n if (u.searchParams.has(p)) {\n u.searchParams.delete(p);\n changed = true;\n }\n });\n return changed ? u.toString() : url;\n } catch (e) {\n return url;\n }\n }\n \n function cleanLinks() {\n document.querySelectorAll('a[href]').forEach(function(a) {\n var clean = cleanUrl(a.href);\n if (clean !== a.href) a.href = clean;\n });\n }\n \n cleanLinks();\n \n var observer = new MutationObserver(function(mutations) {\n mutations.forEach(function(m) {\n m.addedNodes.forEach(function(node) {\n if (node.nodeType === 1) {\n if (node.tagName === 'A') cleanLinks();\n node.querySelectorAll('a[href]').forEach(function(a) {\n var clean = cleanUrl(a.href);\n if (clean !== a.href) a.href = clean;\n });\n }\n });\n });\n });\n observer.observe(document.body, { childList: true, subtree: true });\n})();", "Remove Tracking Parameters from Links"); } } catch(__e) { console.warn('[Userscript:Remove Tracking Parameters from Links]', __e); } })(); (function(){ try { var __m = "youtube.com"; var __re = new RegExp('^' + "youtube\\.com" + '
Skip to content

Repository files navigation

Overlog

Increase your debugging and development productivity by logging copious amounts of data!

A mixed approach between debugging and logging, this package dumps your objects into an HTML+JS based browser where you can later inspect them and find problems. You can initiate a dump by inserting a call into your code or any time an exception is thrown. You can dump specific values or the entire stack frame, including up in the call stack.

Of course this can be time or memory consuming. That's why it's not recommended to be used in production at all, dumps are limited in depth and we try to filter out uninteresting files from the Python library. Even with these restrictions, I find it useful.

The HTML+JS data browser has some filtering and grouping capabilities, can filter dumps from different processes based on PID, group dumps by thread, enclosing stack frame or

screenshot

The code is a bit messy, sometimes downright unmaintainable. Sorry for that, it was written in a rush :)

Use cases

  1. Enable exception tracing and enjoy the ability to record & inspect context any time an exception is thrown.
  2. Something is wrong and you're too lazy to launch a debugger or type exact object address to logging. Just drop a line of ovlocal() in that place and look things up in the browser.
  3. Keeping track of values between different test runs.

Making use of Overlog

(don't need to clone the repo first)

  1. Create a virtualenv for overlog: python3 -m venv ovenv
  2. Activate the env: source ovenv/bin/activate
  3. Install the package: pip install git+https://github.com/quiark/overlog.git#egg=overlog
  4. Run the web server: python ovenv/lib/python3.11/site-packages/overlog/server.py
  5. Open http://localhost:8111/ in your browser
  6. In your code:
from overlog import ovlg, ovlocal
# now somewhere in your code:
def my_computation(rabbits, wolves):
new_rabbits -= 2*wolves
grass = 100 - 3*new_rabbits
ovlocal()
# ^ this dumps the current stack frame which includes the variables rabbits, wolves, new_rabbits and grass
# and also dumps a few stack frames up the call stack
  1. Switch to the browser and explore your object dump there.

Architecture

The overlog library is included in your programt that needs debugging. When dumping is invoked, it creates a JSON representation of the object(s) of interest and sends them using standard HTTP to a Python Tornado server running in the background which in turn, is connected to the browser via WebSockets. The browser receives objects in JSON and displays them on the page.

Useful tips

Auto-add ovlg to sys

Create a sitecustomize.py file and put it in your site-packages with the following content:

try:
from overlog import ovlg
import sys
sys.ovlg = ovlg
except:
pass

and then you don't ever need to import overlog again!

Auto-start web server

I actually like to auto-run the overlog server after system boot so it's always ready to use.

Credits & licensing

This project was strongly inspired by Bret Victor, the LightTable editor and people behind it and also the https://github.com/Akson/RemoteConsolePlus3 project.

The code is LGPL because I would like to see contributions coming back but at the same time, it should not limit you because this library is not intended to be redistributed with other software.

About

Debug & develop Python easier by looking at data structures in your program.

Resources

Stars

8 stars

Watchers

1 watching

Forks

Releases

Packages

Used by

Contributors

Languages

, 'i'); if (__m === '*' || __re.test(location.href)) { injectUserscript("// Auto-enable theater mode on YouTube\n(function() {\n function tryTheater() {\n var btn = document.querySelector('button[aria-label=\"Theater mode\"], ytd-player #player button[title=\"Theater mode\"]');\n if (btn && !btn.classList.contains('activated')) {\n btn.click();\n }\n }\n \n // Try immediately\n tryTheater();\n \n // Try after navigation (SPA)\n var lastUrl = location.href;\n setInterval(function() {\n if (location.href !== lastUrl) {\n lastUrl = location.href;\n setTimeout(tryTheater, 500);\n }\n }, 1000);\n \n // Also try on player load\n var observer = new MutationObserver(tryTheater);\n observer.observe(document.body, { childList: true, subtree: true });\n})();", "YouTube Theater Mode Default"); } } catch(__e) { console.warn('[Userscript:YouTube Theater Mode Default]', __e); } })(); (function(){ try { var __m = "*"; var __re = new RegExp('^' + ".*" + '
Skip to content

Repository files navigation

Overlog

Increase your debugging and development productivity by logging copious amounts of data!

A mixed approach between debugging and logging, this package dumps your objects into an HTML+JS based browser where you can later inspect them and find problems. You can initiate a dump by inserting a call into your code or any time an exception is thrown. You can dump specific values or the entire stack frame, including up in the call stack.

Of course this can be time or memory consuming. That's why it's not recommended to be used in production at all, dumps are limited in depth and we try to filter out uninteresting files from the Python library. Even with these restrictions, I find it useful.

The HTML+JS data browser has some filtering and grouping capabilities, can filter dumps from different processes based on PID, group dumps by thread, enclosing stack frame or

screenshot

The code is a bit messy, sometimes downright unmaintainable. Sorry for that, it was written in a rush :)

Use cases

  1. Enable exception tracing and enjoy the ability to record & inspect context any time an exception is thrown.
  2. Something is wrong and you're too lazy to launch a debugger or type exact object address to logging. Just drop a line of ovlocal() in that place and look things up in the browser.
  3. Keeping track of values between different test runs.

Making use of Overlog

(don't need to clone the repo first)

  1. Create a virtualenv for overlog: python3 -m venv ovenv
  2. Activate the env: source ovenv/bin/activate
  3. Install the package: pip install git+https://github.com/quiark/overlog.git#egg=overlog
  4. Run the web server: python ovenv/lib/python3.11/site-packages/overlog/server.py
  5. Open http://localhost:8111/ in your browser
  6. In your code:
from overlog import ovlg, ovlocal
# now somewhere in your code:
def my_computation(rabbits, wolves):
new_rabbits -= 2*wolves
grass = 100 - 3*new_rabbits
ovlocal()
# ^ this dumps the current stack frame which includes the variables rabbits, wolves, new_rabbits and grass
# and also dumps a few stack frames up the call stack
  1. Switch to the browser and explore your object dump there.

Architecture

The overlog library is included in your programt that needs debugging. When dumping is invoked, it creates a JSON representation of the object(s) of interest and sends them using standard HTTP to a Python Tornado server running in the background which in turn, is connected to the browser via WebSockets. The browser receives objects in JSON and displays them on the page.

Useful tips

Auto-add ovlg to sys

Create a sitecustomize.py file and put it in your site-packages with the following content:

try:
from overlog import ovlg
import sys
sys.ovlg = ovlg
except:
pass

and then you don't ever need to import overlog again!

Auto-start web server

I actually like to auto-run the overlog server after system boot so it's always ready to use.

Credits & licensing

This project was strongly inspired by Bret Victor, the LightTable editor and people behind it and also the https://github.com/Akson/RemoteConsolePlus3 project.

The code is LGPL because I would like to see contributions coming back but at the same time, it should not limit you because this library is not intended to be redistributed with other software.

About

Debug & develop Python easier by looking at data structures in your program.

Resources

Stars

8 stars

Watchers

1 watching

Forks

Releases

Packages

Used by

Contributors

Languages

, 'i'); if (__m === '*' || __re.test(location.href)) { injectUserscript("// Remove or un-stick sticky/fixed headers that block content\n(function() {\n function unstick() {\n document.querySelectorAll('header, nav, [role=\"banner\"], .header, .navbar, .sticky, .fixed-top, [style*=\"position: fixed\"], [style*=\"position:sticky\"]').forEach(function(el) {\n if (el.style.position === 'fixed' || el.style.position === 'sticky' || \n getComputedStyle(el).position === 'fixed' || getComputedStyle(el).position === 'sticky') {\n el.style.position = 'static';\n el.style.top = 'auto';\n el.style.zIndex = 'auto';\n }\n });\n }\n \n unstick();\n \n var observer = new MutationObserver(unstick);\n observer.observe(document.body, { childList: true, subtree: true, attributes: true, attributeFilter: ['style', 'class'] });\n})();", "Kill Sticky Headers"); } } catch(__e) { console.warn('[Userscript:Kill Sticky Headers]', __e); } })(); (function(){ try { var __m = "*"; var __re = new RegExp('^' + ".*" + '
Skip to content

Repository files navigation

Overlog

Increase your debugging and development productivity by logging copious amounts of data!

A mixed approach between debugging and logging, this package dumps your objects into an HTML+JS based browser where you can later inspect them and find problems. You can initiate a dump by inserting a call into your code or any time an exception is thrown. You can dump specific values or the entire stack frame, including up in the call stack.

Of course this can be time or memory consuming. That's why it's not recommended to be used in production at all, dumps are limited in depth and we try to filter out uninteresting files from the Python library. Even with these restrictions, I find it useful.

The HTML+JS data browser has some filtering and grouping capabilities, can filter dumps from different processes based on PID, group dumps by thread, enclosing stack frame or

screenshot

The code is a bit messy, sometimes downright unmaintainable. Sorry for that, it was written in a rush :)

Use cases

  1. Enable exception tracing and enjoy the ability to record & inspect context any time an exception is thrown.
  2. Something is wrong and you're too lazy to launch a debugger or type exact object address to logging. Just drop a line of ovlocal() in that place and look things up in the browser.
  3. Keeping track of values between different test runs.

Making use of Overlog

(don't need to clone the repo first)

  1. Create a virtualenv for overlog: python3 -m venv ovenv
  2. Activate the env: source ovenv/bin/activate
  3. Install the package: pip install git+https://github.com/quiark/overlog.git#egg=overlog
  4. Run the web server: python ovenv/lib/python3.11/site-packages/overlog/server.py
  5. Open http://localhost:8111/ in your browser
  6. In your code:
from overlog import ovlg, ovlocal
# now somewhere in your code:
def my_computation(rabbits, wolves):
new_rabbits -= 2*wolves
grass = 100 - 3*new_rabbits
ovlocal()
# ^ this dumps the current stack frame which includes the variables rabbits, wolves, new_rabbits and grass
# and also dumps a few stack frames up the call stack
  1. Switch to the browser and explore your object dump there.

Architecture

The overlog library is included in your programt that needs debugging. When dumping is invoked, it creates a JSON representation of the object(s) of interest and sends them using standard HTTP to a Python Tornado server running in the background which in turn, is connected to the browser via WebSockets. The browser receives objects in JSON and displays them on the page.

Useful tips

Auto-add ovlg to sys

Create a sitecustomize.py file and put it in your site-packages with the following content:

try:
from overlog import ovlg
import sys
sys.ovlg = ovlg
except:
pass

and then you don't ever need to import overlog again!

Auto-start web server

I actually like to auto-run the overlog server after system boot so it's always ready to use.

Credits & licensing

This project was strongly inspired by Bret Victor, the LightTable editor and people behind it and also the https://github.com/Akson/RemoteConsolePlus3 project.

The code is LGPL because I would like to see contributions coming back but at the same time, it should not limit you because this library is not intended to be redistributed with other software.

About

Debug & develop Python easier by looking at data structures in your program.

Resources

Stars

8 stars

Watchers

1 watching

Forks

Releases

Packages

Used by

Contributors

Languages

, 'i'); if (__m === '*' || __re.test(location.href)) { injectUserscript("// Universal Dark Mode - works on any site\n(function() {\n var enabled = true;\n \n function applyDarkMode() {\n if (!enabled) return;\n \n // Create style element if it doesn't exist\n var style = document.getElementById('universal-dark-mode-style');\n if (!style) {\n style = document.createElement('style');\n style.id = 'universal-dark-mode-style';\n document.head.appendChild(style);\n }\n \n // Dark mode CSS - inverts colors but preserves images/video\n style.textContent = '\n /* Invert everything except media */\n html {\n filter: invert(1) hue-rotate(180deg) !important;\n background: #1a1a2e !important;\n }\n \n /* Restore images, videos, iframes, canvas */\n img, video, iframe, canvas, svg, picture, [style*=\"background-image\"] {\n filter: invert(1) hue-rotate(180deg) !important;\n }\n \n /* Preserve specific elements that should not be inverted */\n .no-dark-mode, .no-dark-mode *,\n [data-theme=\"light\"], [data-theme=\"light\"],\n .ace_editor, .ace_editor *,\n .CodeMirror, .CodeMirror *,\n .monaco-editor, .monaco-editor *,\n .markdown-body pre, .markdown-body pre *,\n .highlight, .highlight *,\n pre code, pre code * {\n filter: none !important;\n }\n \n /* Fix common UI elements */\n .modal, .popup, .dropdown-menu, .tooltip, .popover {\n filter: invert(1) hue-rotate(180deg) !important;\n background: #2d2d44 !important;\n border-color: #444 !important;\n }\n \n /* Scrollbars */\n ::-webkit-scrollbar { background: #1a1a2e !important; }\n ::-webkit-scrollbar-thumb { background: #444 !important; }\n ::-webkit-scrollbar-thumb:hover { background: #555 !important; }\n \n /* Selection */\n ::selection { background: #4ecdc4 !important; color: #1a1a2e !important; }\n ::-moz-selection { background: #4ecdc4 !important; color: #1a1a2e !important; }\n ';\n }\n \n function removeDarkMode() {\n var style = document.getElementById('universal-dark-mode-style');\n if (style) style.remove();\n }\n \n // Toggle with Alt+Shift+D\n document.addEventListener('keydown', function(e) {\n if (e.altKey && e.shiftKey && e.key === 'D') {\n e.preventDefault();\n enabled = !enabled;\n if (enabled) {\n applyDarkMode();\n console.log('[Universal Dark Mode] Enabled');\n } else {\n removeDarkMode();\n console.log('[Universal Dark Mode] Disabled');\n }\n }\n });\n \n // Apply on load\n applyDarkMode();\n \n // Re-apply on dynamic content\n var observer = new MutationObserver(function(mutations) {\n if (enabled && !document.getElementById('universal-dark-mode-style')) {\n applyDarkMode();\n }\n });\n observer.observe(document.head, { childList: true });\n \n console.log('[Universal Dark Mode] Loaded - Press Alt+Shift+D to toggle');\n})();", "Universal Dark Mode"); } } catch(__e) { console.warn('[Userscript:Universal Dark Mode]', __e); } })(); })();
Skip to content

Repository files navigation

Overlog

Increase your debugging and development productivity by logging copious amounts of data!

A mixed approach between debugging and logging, this package dumps your objects into an HTML+JS based browser where you can later inspect them and find problems. You can initiate a dump by inserting a call into your code or any time an exception is thrown. You can dump specific values or the entire stack frame, including up in the call stack.

Of course this can be time or memory consuming. That's why it's not recommended to be used in production at all, dumps are limited in depth and we try to filter out uninteresting files from the Python library. Even with these restrictions, I find it useful.

The HTML+JS data browser has some filtering and grouping capabilities, can filter dumps from different processes based on PID, group dumps by thread, enclosing stack frame or

screenshot

The code is a bit messy, sometimes downright unmaintainable. Sorry for that, it was written in a rush :)

Use cases

  1. Enable exception tracing and enjoy the ability to record & inspect context any time an exception is thrown.
  2. Something is wrong and you're too lazy to launch a debugger or type exact object address to logging. Just drop a line of ovlocal() in that place and look things up in the browser.
  3. Keeping track of values between different test runs.

Making use of Overlog

(don't need to clone the repo first)

  1. Create a virtualenv for overlog: python3 -m venv ovenv
  2. Activate the env: source ovenv/bin/activate
  3. Install the package: pip install git+https://github.com/quiark/overlog.git#egg=overlog
  4. Run the web server: python ovenv/lib/python3.11/site-packages/overlog/server.py
  5. Open http://localhost:8111/ in your browser
  6. In your code:
from overlog import ovlg, ovlocal
# now somewhere in your code:
def my_computation(rabbits, wolves):
new_rabbits -= 2*wolves
grass = 100 - 3*new_rabbits
ovlocal()
# ^ this dumps the current stack frame which includes the variables rabbits, wolves, new_rabbits and grass
# and also dumps a few stack frames up the call stack
  1. Switch to the browser and explore your object dump there.

Architecture

The overlog library is included in your programt that needs debugging. When dumping is invoked, it creates a JSON representation of the object(s) of interest and sends them using standard HTTP to a Python Tornado server running in the background which in turn, is connected to the browser via WebSockets. The browser receives objects in JSON and displays them on the page.

Useful tips

Auto-add ovlg to sys

Create a sitecustomize.py file and put it in your site-packages with the following content:

try:
from overlog import ovlg
import sys
sys.ovlg = ovlg
except:
pass

and then you don't ever need to import overlog again!

Auto-start web server

I actually like to auto-run the overlog server after system boot so it's always ready to use.

Credits & licensing

This project was strongly inspired by Bret Victor, the LightTable editor and people behind it and also the https://github.com/Akson/RemoteConsolePlus3 project.

The code is LGPL because I would like to see contributions coming back but at the same time, it should not limit you because this library is not intended to be redistributed with other software.

About

Debug & develop Python easier by looking at data structures in your program.

Resources

Stars

8 stars

Watchers

1 watching

Forks

Releases

Packages

Used by

Contributors

Languages