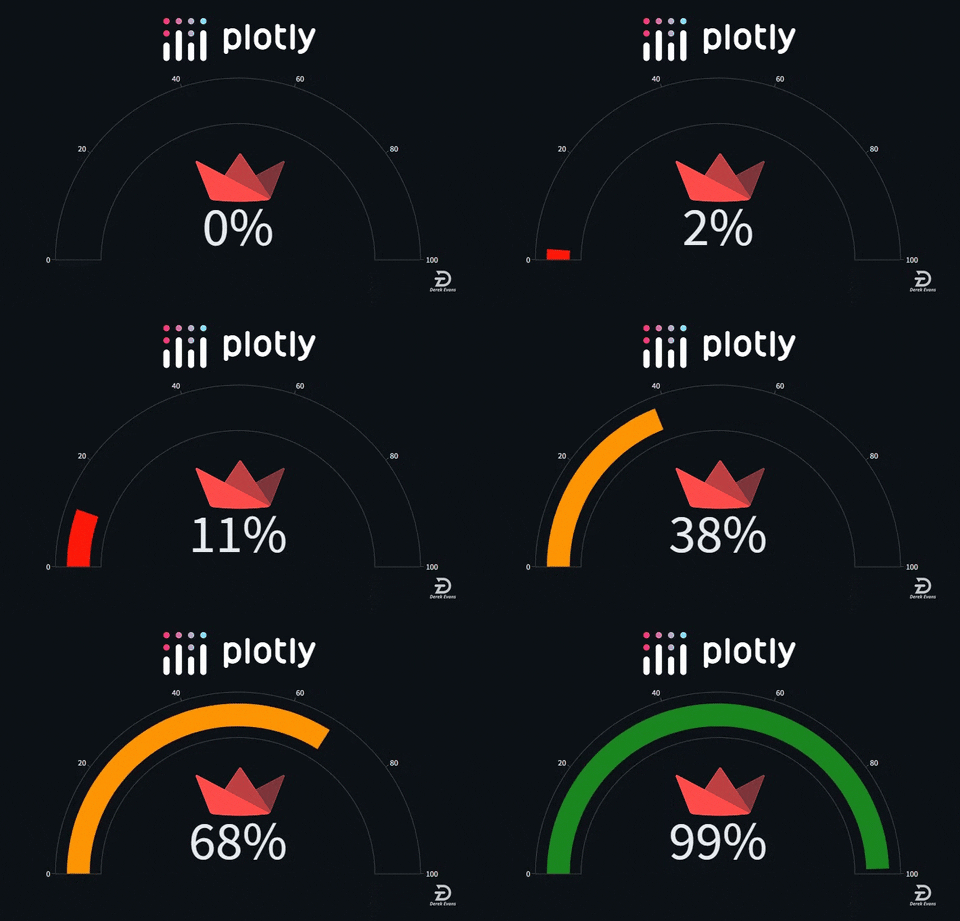

Custom Plotly visualizations for Streamlit
Open a terminal and run:
$ pip install streamviz
| Library | Language | Link |
|---|---|---|
| Streamlit | Python | https://github.com/streamlit/streamlit |
| Plotly | Python | https://github.com/plotly/plotly.py |
| Name | Data Type | Short Desc | Options |
|---|---|---|---|
| gVal | "integer, float" | gauge Value (required) | |
| gTitle | string | gauge Title (default '') | |
| gMode | string | gauge Mode (default gauge+number) | "gauge+number, gauge, number" |
| gSize | String | gauge Size (default FULL) | "SML, MED, LRG, FULL, CUST" |
| grLow | "integer, float" | Low gauge Range (default 0.30) | |
| grMid | "integer, float" | Middle gauge Range (default 0.70) | |
| gcLow | string | Low gauge Color (default #FF1708) | |
| gcMid | string | Middle gauge Color (default #FF9400) | |
| gcHigh | string | High gauge Color (default #1B8720) | |
| sFix | string | gauge Value Suffix (default 0.0) | % |
| gTheme | string | Gauge theme color (default Black) |