scFeatures: Multi-view representations of single-cell and spatial data for disease outcome prediction

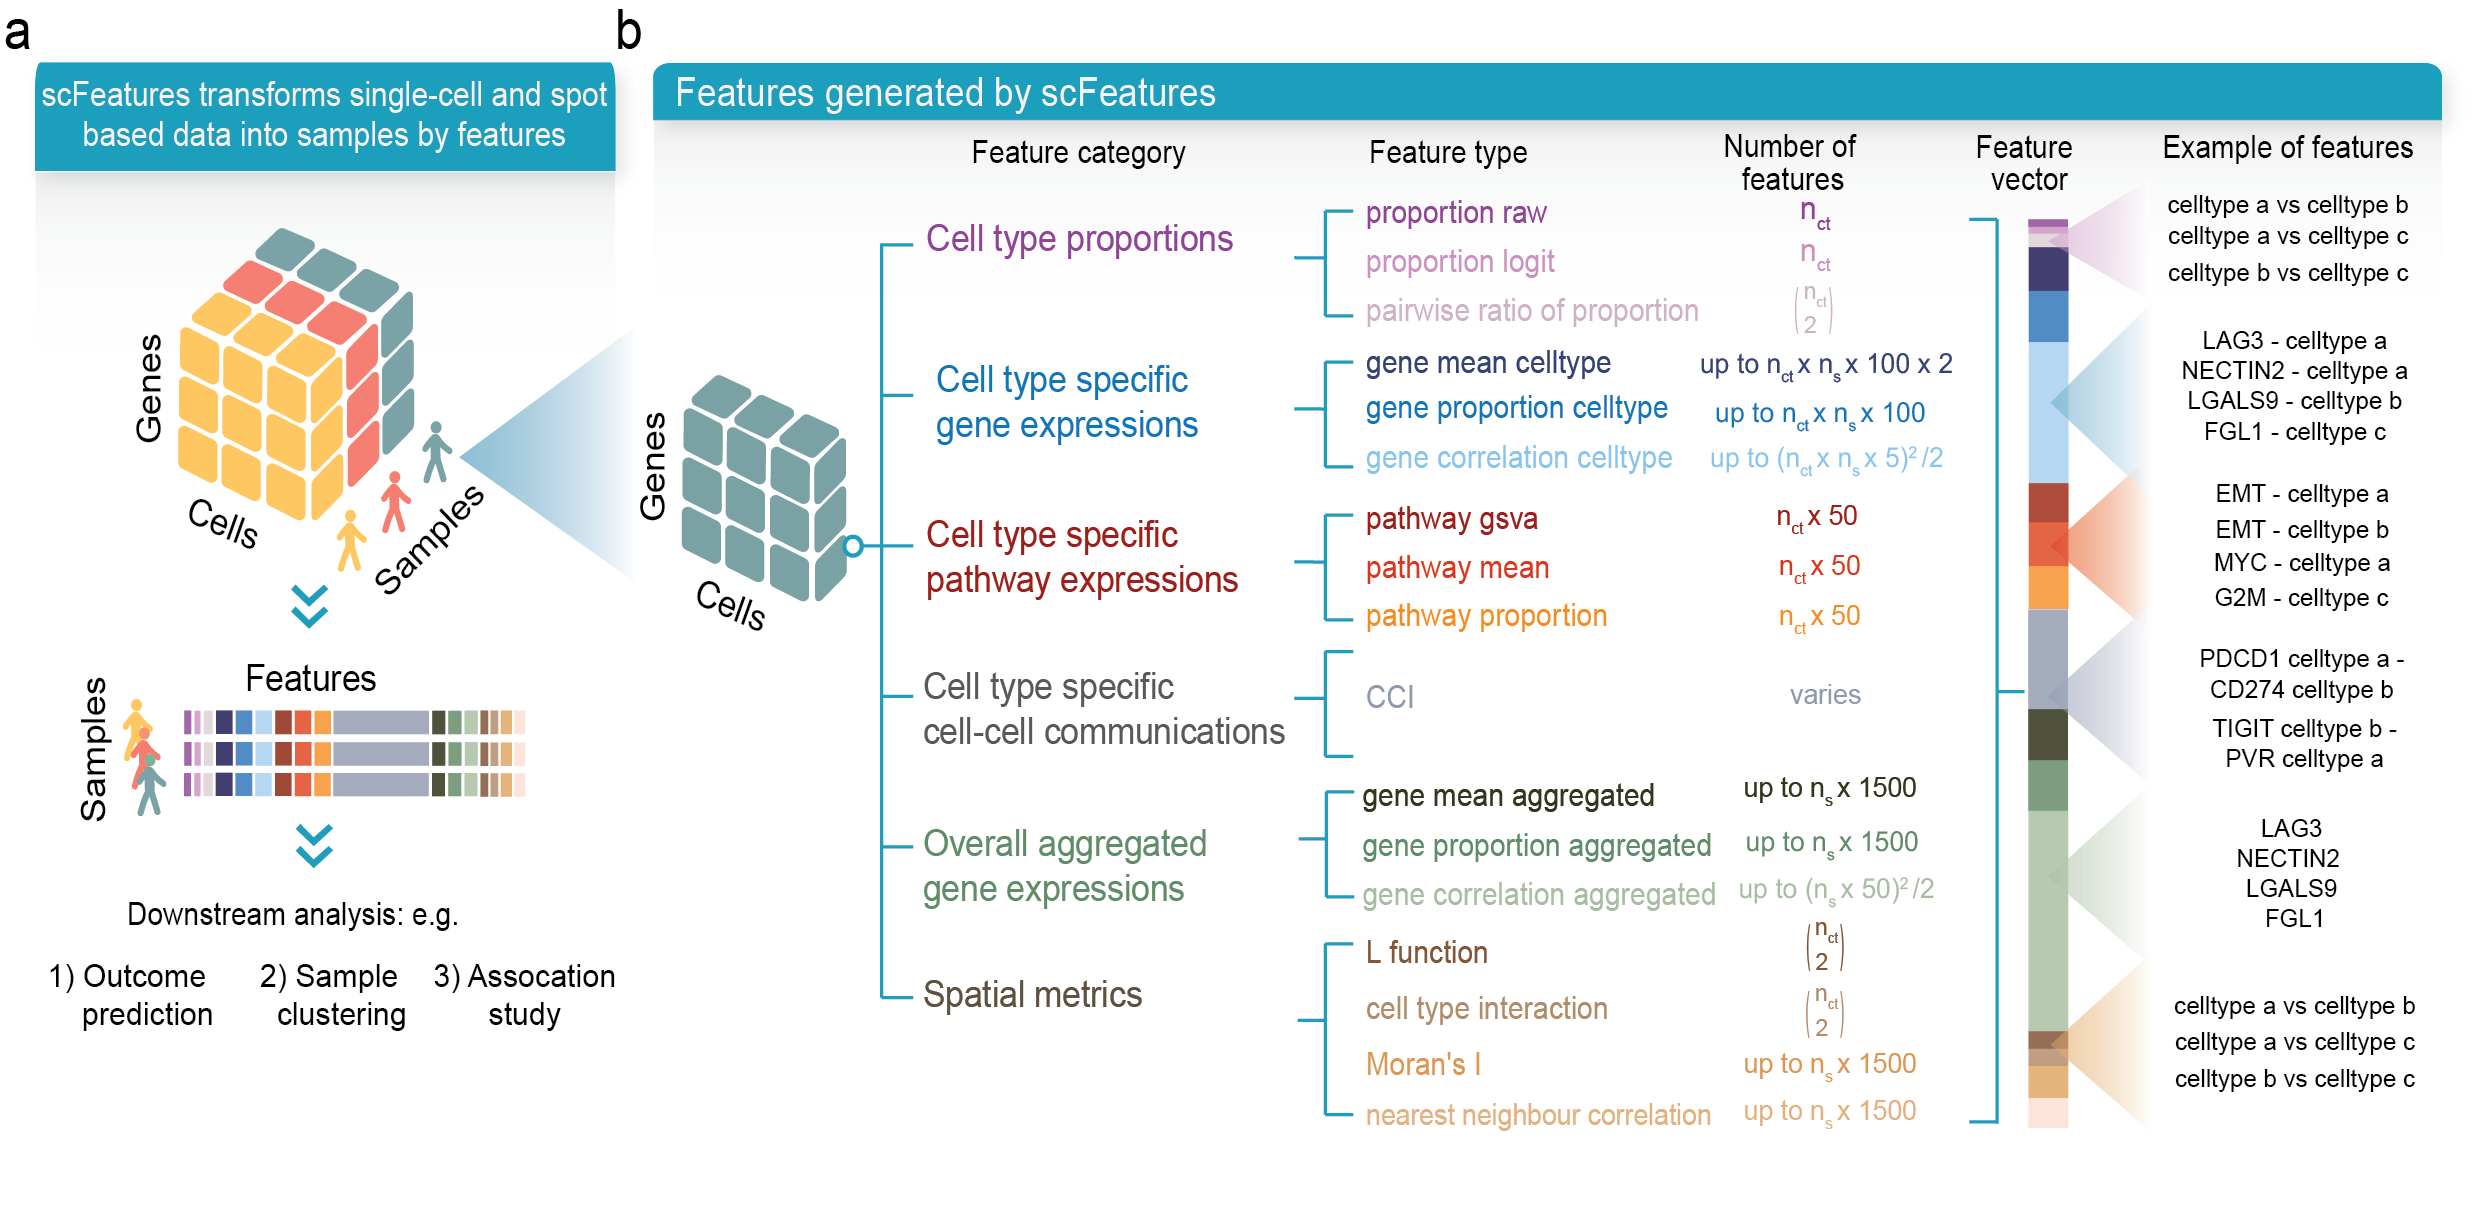
scFeatures is a tool that generates multi-view representations of single-cell and spatial data through the construction of a total of 17 feature types belonging to the following six categories.
- cell type proportions
- cell type specific gene expressions
- cell type specific pathway expressions
- cell type specific cell-cell interaction (CCI) scores
- overall aggregated gene expressions
- spatial metrics
The latest scFeatures can be installed using devtools:
library(devtools)
devtools::install_github("SydneyBioX/scFeatures")
The following dependency is needed for running the cell-cell communication feature type.
devtools::install_github("immunogenomics/presto")
devtools::install_github("jinworks/CellChat")
scFeatures can be run using one line of code
scfeatures_result <- scFeatures(data = data, sample = sample, celltype = celltype)
which generates a list of dataframes containing all feature types in the form of samples x features.
Currently, scFeatures support scRNA-seq, spatial proteomics and spatial transcriptomics.
For scRNA-seq, run:
data("example_scrnaseq" , package = "scFeatures")
data <- example_scrnaseq
scfeatures_result <- scFeatures(data = data@assays$RNA@data, sample = data$sample, celltype = data$celltype,
type = "scrna", ncores = 8, species = "Homo sapiens")
For spatial proteomics, run:
# note, spatial data requires spatial coordinates of each cell. spatialCoords <- list( sample( 1:ncol(data), ncol(data)) , sample( 1:ncol(data), ncol(data) )) # generate fake coordinates
scfeatures_result <- scFeatures(data = data@assays$RNA@data, sample = data$sample, celltype = data$celltype,
type = "spatial_p", spatialCoords = spatialCoords, ncores = 8, species = "Homo sapiens")
For spatial transcriptomics, run:
# note, spatial data requires spatial coordinates of each cell. spatialCoords <- list( sample( 1:ncol(data), ncol(data)) , sample( 1:ncol(data), ncol(data) )) # as well as predicted probability of cell types in each spot spotProbability <- t(gtools::rdirichlet( ncol(data), rep(1, 5))) # simulate the cell type prediction result based on 5 cell types rownames( spotProbability) <- c("Cell type A", "Cell type B" , "Cell type C", "Cell type D", "Cell type E")
colnames( spotProbability ) <- colnames(data)
scfeatures_result <- scFeatures(data = data@assays$RNA@data, sample = data$sample, celltype = data$celltype,
type = "spatial_t", spatialCoords = spatialCoords, spotProbability = spotProbability, ncores = 8, species = "Homo sapiens")
Please see https://sydneybiox.github.io/scFeatures/articles/scFeatures_overview.html.
Cao, Y., Lin, Y., Patrick, E., Yang, P., & Yang, J. Y. H. (2022). scFeatures: multi-view representations of single-cell and spatial data for disease outcome prediction. In O. Vitek (Ed.), Bioinformatics (Vol. 38, Issue 20, pp. 4745–4753). Oxford University Press (OUP). https://doi.org/10.1093/bioinformatics/btac590