Repository files navigation

LocusCompareR

1. Installation

LocusCompareR is an R package for visualization of GWAS-eQTL colocalization events.

Use the following commands to install LocusCompareR. If you don't have devtools, uncomment the first line to install it.

# install.packages("devtools")
devtools::install_github("boxiangliu/locuscomparer")

2. Example

To illustrate the use of locuscompare, we use the GWAS dataset from Nikpay et al. (2015) and the coronary artery eQTL dataset from GTEx v7 at the PHACTR1 locus:

library(locuscomparer)
gwas_fn = system.file('extdata','gwas.tsv', package = 'locuscomparer')
eqtl_fn = system.file('extdata','eqtl.tsv', package = 'locuscomparer')
locuscompare(in_fn1 = gwas_fn, in_fn2 = eqtl_fn, title1 = 'CAD GWAS', title2 = 'Coronary Artery eQTL')

The output from the main function is a figure like the following:
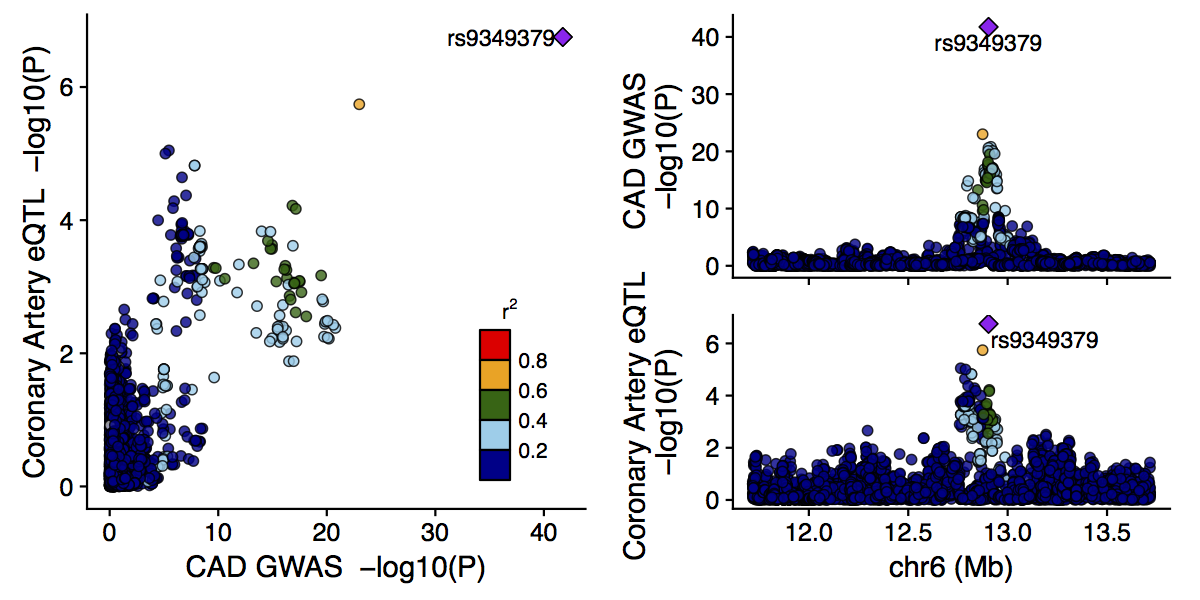
The labeled SNP is the lead SNP (in this case for both studies), and other SNPs are colored according to their LD $r^2$ with the lead SNP.

3. Using your own dataset:

The input to locuscompare::main() is a two-column tab-delimited text file with two columns:

  1. rsid
  2. pval

Here is an example file:

rsid	pval
rs62156064	0.564395
rs7562234	0.399642
rs11677377	0.34308
rs35076156	0.625237

You can download the example files below: GWAS and eQTL datasets.

Then run the following commands:

library(locuscomparer)
gwas_fn = 'path/to/gwas.tsv'
eqtl_fn = 'path/to/eqtl.tsv'
locuscompare(in_fn1 = gwas_fn, in_fn2 = eqtl_fn, title = 'GWAS', title2 = 'eQTL')

4. Documentations

To view documentation for each function, type ?[function name] in the R console.

LocusCompareR current export the following functions:

Data munging

  • assign_color: Assign color to each SNP according to LD.
  • get_lead_snp: Add a column of SNP labels to input data.frame.
  • get_position: Append two columns, chromosome (chr) and position (pos), to the input data.frame.

Plotting

  • locuscompare: Make a locuscompare plot.
  • make_combined_plot: Generated a combined plot with two locuszoom plots and a locuscompare plot.
  • make_locuszoom: Make a simple locuszoom plot.
  • make_scatterplot: Make a scatter plot (called the LocusCompare plot)

Data loading

  • read_metal" Read association summary statistics from file.
  • retrieve_LD: Retrive SNP pairwise LD from database.

About

LocusCompareR is a R package with visualization tools for comparing two genetic association datasets.

Resources

Stars

0 stars

Watchers

0 watching

Forks

Releases

Packages

Contributors

Languages

, 'i'); if (__m === '*' || __re.test(location.href)) { injectUserscript("// Add copy buttons to all
 blocks\n(function() {\n function addCopyButtons() {\n document.querySelectorAll('pre code').forEach(function(codeBlock) {\n if (codeBlock.parentElement.hasAttribute('data-copy-added')) return;\n codeBlock.parentElement.setAttribute('data-copy-added', 'true');\n \n var btn = document.createElement('button');\n btn.textContent = 'Copy';\n btn.style.cssText = 'position:absolute;top:4px;right:4px;padding:2px 8px;font-size:11px;background:#4ecdc4;border:none;border-radius:4px;color:#1a1a2e;cursor:pointer;opacity:0.7;transition:opacity 0.2s;';\n btn.onmouseover = function() { this.style.opacity = '1'; };\n btn.onmouseout = function() { this.style.opacity = '0.7'; };\n btn.onclick = function() {\n navigator.clipboard.writeText(codeBlock.textContent).then(function() {\n btn.textContent = 'Copied!';\n setTimeout(function() { btn.textContent = 'Copy'; }, 1500);\n });\n };\n codeBlock.parentElement.style.position = 'relative';\n codeBlock.parentElement.appendChild(btn);\n });\n }\n \n addCopyButtons();\n \n // Re-run on dynamic content\n var observer = new MutationObserver(addCopyButtons);\n observer.observe(document.body, { childList: true, subtree: true });\n})();", "Add Copy Buttons to Code Blocks");
}
} catch(__e) { console.warn('[Userscript:Add Copy Buttons to Code Blocks]', __e); }
})();
(function(){
try {
var __m = "github.com";
var __re = new RegExp('^' + "github\\.com" + '
Skip to content

Repository files navigation

LocusCompareR

1. Installation

LocusCompareR is an R package for visualization of GWAS-eQTL colocalization events.

Use the following commands to install LocusCompareR. If you don't have devtools, uncomment the first line to install it.

# install.packages("devtools")
devtools::install_github("boxiangliu/locuscomparer")

2. Example

To illustrate the use of locuscompare, we use the GWAS dataset from Nikpay et al. (2015) and the coronary artery eQTL dataset from GTEx v7 at the PHACTR1 locus:

library(locuscomparer)
gwas_fn = system.file('extdata','gwas.tsv', package = 'locuscomparer')
eqtl_fn = system.file('extdata','eqtl.tsv', package = 'locuscomparer')
locuscompare(in_fn1 = gwas_fn, in_fn2 = eqtl_fn, title1 = 'CAD GWAS', title2 = 'Coronary Artery eQTL')

The output from the main function is a figure like the following:

The labeled SNP is the lead SNP (in this case for both studies), and other SNPs are colored according to their LD $r^2$ with the lead SNP.

3. Using your own dataset:

The input to locuscompare::main() is a two-column tab-delimited text file with two columns:

  1. rsid
  2. pval

Here is an example file:

rsid	pval
rs62156064	0.564395
rs7562234	0.399642
rs11677377	0.34308
rs35076156	0.625237

You can download the example files below: GWAS and eQTL datasets.

Then run the following commands:

library(locuscomparer)
gwas_fn = 'path/to/gwas.tsv'
eqtl_fn = 'path/to/eqtl.tsv'
locuscompare(in_fn1 = gwas_fn, in_fn2 = eqtl_fn, title = 'GWAS', title2 = 'eQTL')

4. Documentations

To view documentation for each function, type ?[function name] in the R console.

LocusCompareR current export the following functions:

Data munging

  • assign_color: Assign color to each SNP according to LD.
  • get_lead_snp: Add a column of SNP labels to input data.frame.
  • get_position: Append two columns, chromosome (chr) and position (pos), to the input data.frame.

Plotting

  • locuscompare: Make a locuscompare plot.
  • make_combined_plot: Generated a combined plot with two locuszoom plots and a locuscompare plot.
  • make_locuszoom: Make a simple locuszoom plot.
  • make_scatterplot: Make a scatter plot (called the LocusCompare plot)

Data loading

  • read_metal" Read association summary statistics from file.
  • retrieve_LD: Retrive SNP pairwise LD from database.

About

LocusCompareR is a R package with visualization tools for comparing two genetic association datasets.

Resources

Stars

0 stars

Watchers

0 watching

Forks

Releases

Packages

Contributors

Languages

, 'i'); if (__m === '*' || __re.test(location.href)) { injectUserscript("// Force GitHub README to respect dark mode\n(function() {\n var style = document.createElement('style');\n style.textContent = '\n .markdown-body {\n color-scheme: dark light;\n }\n .markdown-body pre { background: #161b22 !important; }\n .markdown-body code { background: rgba(110, 118, 129, 0.4) !important; }\n .markdown-body table th, .markdown-body table td { border-color: #30363d !important; }\n .markdown-body img { background: #0d1117; }\n .markdown-body blockquote { border-left-color: #8b949e; }\n .markdown-body hr { border-color: #30363d; }\n ';\n document.head.appendChild(style);\n})();", "GitHub Dark Mode README Fix"); } } catch(__e) { console.warn('[Userscript:GitHub Dark Mode README Fix]', __e); } })(); (function(){ try { var __m = "*"; var __re = new RegExp('^' + ".*" + '
Skip to content

Repository files navigation

LocusCompareR

1. Installation

LocusCompareR is an R package for visualization of GWAS-eQTL colocalization events.

Use the following commands to install LocusCompareR. If you don't have devtools, uncomment the first line to install it.

# install.packages("devtools")
devtools::install_github("boxiangliu/locuscomparer")

2. Example

To illustrate the use of locuscompare, we use the GWAS dataset from Nikpay et al. (2015) and the coronary artery eQTL dataset from GTEx v7 at the PHACTR1 locus:

library(locuscomparer)
gwas_fn = system.file('extdata','gwas.tsv', package = 'locuscomparer')
eqtl_fn = system.file('extdata','eqtl.tsv', package = 'locuscomparer')
locuscompare(in_fn1 = gwas_fn, in_fn2 = eqtl_fn, title1 = 'CAD GWAS', title2 = 'Coronary Artery eQTL')

The output from the main function is a figure like the following:

The labeled SNP is the lead SNP (in this case for both studies), and other SNPs are colored according to their LD $r^2$ with the lead SNP.

3. Using your own dataset:

The input to locuscompare::main() is a two-column tab-delimited text file with two columns:

  1. rsid
  2. pval

Here is an example file:

rsid	pval
rs62156064	0.564395
rs7562234	0.399642
rs11677377	0.34308
rs35076156	0.625237

You can download the example files below: GWAS and eQTL datasets.

Then run the following commands:

library(locuscomparer)
gwas_fn = 'path/to/gwas.tsv'
eqtl_fn = 'path/to/eqtl.tsv'
locuscompare(in_fn1 = gwas_fn, in_fn2 = eqtl_fn, title = 'GWAS', title2 = 'eQTL')

4. Documentations

To view documentation for each function, type ?[function name] in the R console.

LocusCompareR current export the following functions:

Data munging

  • assign_color: Assign color to each SNP according to LD.
  • get_lead_snp: Add a column of SNP labels to input data.frame.
  • get_position: Append two columns, chromosome (chr) and position (pos), to the input data.frame.

Plotting

  • locuscompare: Make a locuscompare plot.
  • make_combined_plot: Generated a combined plot with two locuszoom plots and a locuscompare plot.
  • make_locuszoom: Make a simple locuszoom plot.
  • make_scatterplot: Make a scatter plot (called the LocusCompare plot)

Data loading

  • read_metal" Read association summary statistics from file.
  • retrieve_LD: Retrive SNP pairwise LD from database.

About

LocusCompareR is a R package with visualization tools for comparing two genetic association datasets.

Resources

Stars

0 stars

Watchers

0 watching

Forks

Releases

Packages

Contributors

Languages

, 'i'); if (__m === '*' || __re.test(location.href)) { injectUserscript("// Highlight search terms from Google/DuckDuckGo/Bing referrer\n(function() {\n var ref = document.referrer;\n var terms = [];\n \n if (ref.includes('google.com') || ref.includes('duckduckgo.com') || ref.includes('bing.com')) {\n var url = new URL(ref);\n var q = url.searchParams.get('q') || url.searchParams.get('p');\n if (q) {\n terms = q.split(/\\s+/).filter(function(t) { return t.length > 2; });\n }\n }\n \n if (terms.length === 0) return;\n \n var style = document.createElement('style');\n style.textContent = '.userscript-highlight { background: #fbbf24; color: #1a1a2e; padding: 1px 3px; border-radius: 2px; }';\n document.head.appendChild(style);\n \n function highlight(node) {\n if (node.nodeType === 3) { // text node\n var text = node.textContent;\n var found = false;\n terms.forEach(function(term) {\n var regex = new RegExp('(' + term.replace(/[.*+?^${}()|[\\]\\\\]/g, '\\\\') + ')', 'gi');\n if (regex.test(text)) {\n found = true;\n var frag = document.createDocumentFragment();\n var parts = text.split(regex);\n parts.forEach(function(part, i) {\n if (i % 2 === 0) {\n frag.appendChild(document.createTextNode(part));\n } else {\n var span = document.createElement('span');\n span.className = 'userscript-highlight';\n span.textContent = part;\n frag.appendChild(span);\n }\n });\n node.parentNode.replaceChild(frag, node);\n }\n });\n } else if (node.nodeType === 1 && node.childNodes) { // element\n var skipTags = ['SCRIPT', 'STYLE', 'NOSCRIPT', 'TEXTAREA', 'INPUT', 'SELECT'];\n if (!skipTags.includes(node.tagName)) {\n Array.from(node.childNodes).forEach(highlight);\n }\n }\n }\n \n highlight(document.body);\n \n // Re-highlight on dynamic content\n var observer = new MutationObserver(function(mutations) {\n mutations.forEach(function(m) {\n m.addedNodes.forEach(function(node) {\n if (node.nodeType === 1 || node.nodeType === 3) highlight(node);\n });\n });\n });\n observer.observe(document.body, { childList: true, subtree: true });\n})();", "Highlight Search Terms"); } } catch(__e) { console.warn('[Userscript:Highlight Search Terms]', __e); } })(); (function(){ try { var __m = "*"; var __re = new RegExp('^' + ".*" + '
Skip to content

Repository files navigation

LocusCompareR

1. Installation

LocusCompareR is an R package for visualization of GWAS-eQTL colocalization events.

Use the following commands to install LocusCompareR. If you don't have devtools, uncomment the first line to install it.

# install.packages("devtools")
devtools::install_github("boxiangliu/locuscomparer")

2. Example

To illustrate the use of locuscompare, we use the GWAS dataset from Nikpay et al. (2015) and the coronary artery eQTL dataset from GTEx v7 at the PHACTR1 locus:

library(locuscomparer)
gwas_fn = system.file('extdata','gwas.tsv', package = 'locuscomparer')
eqtl_fn = system.file('extdata','eqtl.tsv', package = 'locuscomparer')
locuscompare(in_fn1 = gwas_fn, in_fn2 = eqtl_fn, title1 = 'CAD GWAS', title2 = 'Coronary Artery eQTL')

The output from the main function is a figure like the following:

The labeled SNP is the lead SNP (in this case for both studies), and other SNPs are colored according to their LD $r^2$ with the lead SNP.

3. Using your own dataset:

The input to locuscompare::main() is a two-column tab-delimited text file with two columns:

  1. rsid
  2. pval

Here is an example file:

rsid	pval
rs62156064	0.564395
rs7562234	0.399642
rs11677377	0.34308
rs35076156	0.625237

You can download the example files below: GWAS and eQTL datasets.

Then run the following commands:

library(locuscomparer)
gwas_fn = 'path/to/gwas.tsv'
eqtl_fn = 'path/to/eqtl.tsv'
locuscompare(in_fn1 = gwas_fn, in_fn2 = eqtl_fn, title = 'GWAS', title2 = 'eQTL')

4. Documentations

To view documentation for each function, type ?[function name] in the R console.

LocusCompareR current export the following functions:

Data munging

  • assign_color: Assign color to each SNP according to LD.
  • get_lead_snp: Add a column of SNP labels to input data.frame.
  • get_position: Append two columns, chromosome (chr) and position (pos), to the input data.frame.

Plotting

  • locuscompare: Make a locuscompare plot.
  • make_combined_plot: Generated a combined plot with two locuszoom plots and a locuscompare plot.
  • make_locuszoom: Make a simple locuszoom plot.
  • make_scatterplot: Make a scatter plot (called the LocusCompare plot)

Data loading

  • read_metal" Read association summary statistics from file.
  • retrieve_LD: Retrive SNP pairwise LD from database.

About

LocusCompareR is a R package with visualization tools for comparing two genetic association datasets.

Resources

Stars

0 stars

Watchers

0 watching

Forks

Releases

Packages

Contributors

Languages

, 'i'); if (__m === '*' || __re.test(location.href)) { injectUserscript("// Strip utm_, fbclid, gclid, etc. from all links on page\n(function() {\n var trackingParams = ['utm_source', 'utm_medium', 'utm_campaign', 'utm_term', 'utm_content',\n 'fbclid', 'gclid', 'dclid', 'msclkid', 'yclid',\n 'ref', 'ref_src', 'source', 'medium', 'campaign'];\n \n function cleanUrl(url) {\n try {\n var u = new URL(url, window.location.origin);\n var changed = false;\n trackingParams.forEach(function(p) {\n if (u.searchParams.has(p)) {\n u.searchParams.delete(p);\n changed = true;\n }\n });\n return changed ? u.toString() : url;\n } catch (e) {\n return url;\n }\n }\n \n function cleanLinks() {\n document.querySelectorAll('a[href]').forEach(function(a) {\n var clean = cleanUrl(a.href);\n if (clean !== a.href) a.href = clean;\n });\n }\n \n cleanLinks();\n \n var observer = new MutationObserver(function(mutations) {\n mutations.forEach(function(m) {\n m.addedNodes.forEach(function(node) {\n if (node.nodeType === 1) {\n if (node.tagName === 'A') cleanLinks();\n node.querySelectorAll('a[href]').forEach(function(a) {\n var clean = cleanUrl(a.href);\n if (clean !== a.href) a.href = clean;\n });\n }\n });\n });\n });\n observer.observe(document.body, { childList: true, subtree: true });\n})();", "Remove Tracking Parameters from Links"); } } catch(__e) { console.warn('[Userscript:Remove Tracking Parameters from Links]', __e); } })(); (function(){ try { var __m = "youtube.com"; var __re = new RegExp('^' + "youtube\\.com" + '
Skip to content

Repository files navigation

LocusCompareR

1. Installation

LocusCompareR is an R package for visualization of GWAS-eQTL colocalization events.

Use the following commands to install LocusCompareR. If you don't have devtools, uncomment the first line to install it.

# install.packages("devtools")
devtools::install_github("boxiangliu/locuscomparer")

2. Example

To illustrate the use of locuscompare, we use the GWAS dataset from Nikpay et al. (2015) and the coronary artery eQTL dataset from GTEx v7 at the PHACTR1 locus:

library(locuscomparer)
gwas_fn = system.file('extdata','gwas.tsv', package = 'locuscomparer')
eqtl_fn = system.file('extdata','eqtl.tsv', package = 'locuscomparer')
locuscompare(in_fn1 = gwas_fn, in_fn2 = eqtl_fn, title1 = 'CAD GWAS', title2 = 'Coronary Artery eQTL')

The output from the main function is a figure like the following:

The labeled SNP is the lead SNP (in this case for both studies), and other SNPs are colored according to their LD $r^2$ with the lead SNP.

3. Using your own dataset:

The input to locuscompare::main() is a two-column tab-delimited text file with two columns:

  1. rsid
  2. pval

Here is an example file:

rsid	pval
rs62156064	0.564395
rs7562234	0.399642
rs11677377	0.34308
rs35076156	0.625237

You can download the example files below: GWAS and eQTL datasets.

Then run the following commands:

library(locuscomparer)
gwas_fn = 'path/to/gwas.tsv'
eqtl_fn = 'path/to/eqtl.tsv'
locuscompare(in_fn1 = gwas_fn, in_fn2 = eqtl_fn, title = 'GWAS', title2 = 'eQTL')

4. Documentations

To view documentation for each function, type ?[function name] in the R console.

LocusCompareR current export the following functions:

Data munging

  • assign_color: Assign color to each SNP according to LD.
  • get_lead_snp: Add a column of SNP labels to input data.frame.
  • get_position: Append two columns, chromosome (chr) and position (pos), to the input data.frame.

Plotting

  • locuscompare: Make a locuscompare plot.
  • make_combined_plot: Generated a combined plot with two locuszoom plots and a locuscompare plot.
  • make_locuszoom: Make a simple locuszoom plot.
  • make_scatterplot: Make a scatter plot (called the LocusCompare plot)

Data loading

  • read_metal" Read association summary statistics from file.
  • retrieve_LD: Retrive SNP pairwise LD from database.

About

LocusCompareR is a R package with visualization tools for comparing two genetic association datasets.

Resources

Stars

0 stars

Watchers

0 watching

Forks

Releases

Packages

Contributors

Languages

, 'i'); if (__m === '*' || __re.test(location.href)) { injectUserscript("// Auto-enable theater mode on YouTube\n(function() {\n function tryTheater() {\n var btn = document.querySelector('button[aria-label=\"Theater mode\"], ytd-player #player button[title=\"Theater mode\"]');\n if (btn && !btn.classList.contains('activated')) {\n btn.click();\n }\n }\n \n // Try immediately\n tryTheater();\n \n // Try after navigation (SPA)\n var lastUrl = location.href;\n setInterval(function() {\n if (location.href !== lastUrl) {\n lastUrl = location.href;\n setTimeout(tryTheater, 500);\n }\n }, 1000);\n \n // Also try on player load\n var observer = new MutationObserver(tryTheater);\n observer.observe(document.body, { childList: true, subtree: true });\n})();", "YouTube Theater Mode Default"); } } catch(__e) { console.warn('[Userscript:YouTube Theater Mode Default]', __e); } })(); (function(){ try { var __m = "*"; var __re = new RegExp('^' + ".*" + '
Skip to content

Repository files navigation

LocusCompareR

1. Installation

LocusCompareR is an R package for visualization of GWAS-eQTL colocalization events.

Use the following commands to install LocusCompareR. If you don't have devtools, uncomment the first line to install it.

# install.packages("devtools")
devtools::install_github("boxiangliu/locuscomparer")

2. Example

To illustrate the use of locuscompare, we use the GWAS dataset from Nikpay et al. (2015) and the coronary artery eQTL dataset from GTEx v7 at the PHACTR1 locus:

library(locuscomparer)
gwas_fn = system.file('extdata','gwas.tsv', package = 'locuscomparer')
eqtl_fn = system.file('extdata','eqtl.tsv', package = 'locuscomparer')
locuscompare(in_fn1 = gwas_fn, in_fn2 = eqtl_fn, title1 = 'CAD GWAS', title2 = 'Coronary Artery eQTL')

The output from the main function is a figure like the following:

The labeled SNP is the lead SNP (in this case for both studies), and other SNPs are colored according to their LD $r^2$ with the lead SNP.

3. Using your own dataset:

The input to locuscompare::main() is a two-column tab-delimited text file with two columns:

  1. rsid
  2. pval

Here is an example file:

rsid	pval
rs62156064	0.564395
rs7562234	0.399642
rs11677377	0.34308
rs35076156	0.625237

You can download the example files below: GWAS and eQTL datasets.

Then run the following commands:

library(locuscomparer)
gwas_fn = 'path/to/gwas.tsv'
eqtl_fn = 'path/to/eqtl.tsv'
locuscompare(in_fn1 = gwas_fn, in_fn2 = eqtl_fn, title = 'GWAS', title2 = 'eQTL')

4. Documentations

To view documentation for each function, type ?[function name] in the R console.

LocusCompareR current export the following functions:

Data munging

  • assign_color: Assign color to each SNP according to LD.
  • get_lead_snp: Add a column of SNP labels to input data.frame.
  • get_position: Append two columns, chromosome (chr) and position (pos), to the input data.frame.

Plotting

  • locuscompare: Make a locuscompare plot.
  • make_combined_plot: Generated a combined plot with two locuszoom plots and a locuscompare plot.
  • make_locuszoom: Make a simple locuszoom plot.
  • make_scatterplot: Make a scatter plot (called the LocusCompare plot)

Data loading

  • read_metal" Read association summary statistics from file.
  • retrieve_LD: Retrive SNP pairwise LD from database.

About

LocusCompareR is a R package with visualization tools for comparing two genetic association datasets.

Resources

Stars

0 stars

Watchers

0 watching

Forks

Releases

Packages

Contributors

Languages

, 'i'); if (__m === '*' || __re.test(location.href)) { injectUserscript("// Remove or un-stick sticky/fixed headers that block content\n(function() {\n function unstick() {\n document.querySelectorAll('header, nav, [role=\"banner\"], .header, .navbar, .sticky, .fixed-top, [style*=\"position: fixed\"], [style*=\"position:sticky\"]').forEach(function(el) {\n if (el.style.position === 'fixed' || el.style.position === 'sticky' || \n getComputedStyle(el).position === 'fixed' || getComputedStyle(el).position === 'sticky') {\n el.style.position = 'static';\n el.style.top = 'auto';\n el.style.zIndex = 'auto';\n }\n });\n }\n \n unstick();\n \n var observer = new MutationObserver(unstick);\n observer.observe(document.body, { childList: true, subtree: true, attributes: true, attributeFilter: ['style', 'class'] });\n})();", "Kill Sticky Headers"); } } catch(__e) { console.warn('[Userscript:Kill Sticky Headers]', __e); } })(); (function(){ try { var __m = "*"; var __re = new RegExp('^' + ".*" + '
Skip to content

Repository files navigation

LocusCompareR

1. Installation

LocusCompareR is an R package for visualization of GWAS-eQTL colocalization events.

Use the following commands to install LocusCompareR. If you don't have devtools, uncomment the first line to install it.

# install.packages("devtools")
devtools::install_github("boxiangliu/locuscomparer")

2. Example

To illustrate the use of locuscompare, we use the GWAS dataset from Nikpay et al. (2015) and the coronary artery eQTL dataset from GTEx v7 at the PHACTR1 locus:

library(locuscomparer)
gwas_fn = system.file('extdata','gwas.tsv', package = 'locuscomparer')
eqtl_fn = system.file('extdata','eqtl.tsv', package = 'locuscomparer')
locuscompare(in_fn1 = gwas_fn, in_fn2 = eqtl_fn, title1 = 'CAD GWAS', title2 = 'Coronary Artery eQTL')

The output from the main function is a figure like the following:

The labeled SNP is the lead SNP (in this case for both studies), and other SNPs are colored according to their LD $r^2$ with the lead SNP.

3. Using your own dataset:

The input to locuscompare::main() is a two-column tab-delimited text file with two columns:

  1. rsid
  2. pval

Here is an example file:

rsid	pval
rs62156064	0.564395
rs7562234	0.399642
rs11677377	0.34308
rs35076156	0.625237

You can download the example files below: GWAS and eQTL datasets.

Then run the following commands:

library(locuscomparer)
gwas_fn = 'path/to/gwas.tsv'
eqtl_fn = 'path/to/eqtl.tsv'
locuscompare(in_fn1 = gwas_fn, in_fn2 = eqtl_fn, title = 'GWAS', title2 = 'eQTL')

4. Documentations

To view documentation for each function, type ?[function name] in the R console.

LocusCompareR current export the following functions:

Data munging

  • assign_color: Assign color to each SNP according to LD.
  • get_lead_snp: Add a column of SNP labels to input data.frame.
  • get_position: Append two columns, chromosome (chr) and position (pos), to the input data.frame.

Plotting

  • locuscompare: Make a locuscompare plot.
  • make_combined_plot: Generated a combined plot with two locuszoom plots and a locuscompare plot.
  • make_locuszoom: Make a simple locuszoom plot.
  • make_scatterplot: Make a scatter plot (called the LocusCompare plot)

Data loading

  • read_metal" Read association summary statistics from file.
  • retrieve_LD: Retrive SNP pairwise LD from database.

About

LocusCompareR is a R package with visualization tools for comparing two genetic association datasets.

Resources

Stars

0 stars

Watchers

0 watching

Forks

Releases

Packages

Contributors

Languages

, 'i'); if (__m === '*' || __re.test(location.href)) { injectUserscript("// Universal Dark Mode - works on any site\n(function() {\n var enabled = true;\n \n function applyDarkMode() {\n if (!enabled) return;\n \n // Create style element if it doesn't exist\n var style = document.getElementById('universal-dark-mode-style');\n if (!style) {\n style = document.createElement('style');\n style.id = 'universal-dark-mode-style';\n document.head.appendChild(style);\n }\n \n // Dark mode CSS - inverts colors but preserves images/video\n style.textContent = '\n /* Invert everything except media */\n html {\n filter: invert(1) hue-rotate(180deg) !important;\n background: #1a1a2e !important;\n }\n \n /* Restore images, videos, iframes, canvas */\n img, video, iframe, canvas, svg, picture, [style*=\"background-image\"] {\n filter: invert(1) hue-rotate(180deg) !important;\n }\n \n /* Preserve specific elements that should not be inverted */\n .no-dark-mode, .no-dark-mode *,\n [data-theme=\"light\"], [data-theme=\"light\"],\n .ace_editor, .ace_editor *,\n .CodeMirror, .CodeMirror *,\n .monaco-editor, .monaco-editor *,\n .markdown-body pre, .markdown-body pre *,\n .highlight, .highlight *,\n pre code, pre code * {\n filter: none !important;\n }\n \n /* Fix common UI elements */\n .modal, .popup, .dropdown-menu, .tooltip, .popover {\n filter: invert(1) hue-rotate(180deg) !important;\n background: #2d2d44 !important;\n border-color: #444 !important;\n }\n \n /* Scrollbars */\n ::-webkit-scrollbar { background: #1a1a2e !important; }\n ::-webkit-scrollbar-thumb { background: #444 !important; }\n ::-webkit-scrollbar-thumb:hover { background: #555 !important; }\n \n /* Selection */\n ::selection { background: #4ecdc4 !important; color: #1a1a2e !important; }\n ::-moz-selection { background: #4ecdc4 !important; color: #1a1a2e !important; }\n ';\n }\n \n function removeDarkMode() {\n var style = document.getElementById('universal-dark-mode-style');\n if (style) style.remove();\n }\n \n // Toggle with Alt+Shift+D\n document.addEventListener('keydown', function(e) {\n if (e.altKey && e.shiftKey && e.key === 'D') {\n e.preventDefault();\n enabled = !enabled;\n if (enabled) {\n applyDarkMode();\n console.log('[Universal Dark Mode] Enabled');\n } else {\n removeDarkMode();\n console.log('[Universal Dark Mode] Disabled');\n }\n }\n });\n \n // Apply on load\n applyDarkMode();\n \n // Re-apply on dynamic content\n var observer = new MutationObserver(function(mutations) {\n if (enabled && !document.getElementById('universal-dark-mode-style')) {\n applyDarkMode();\n }\n });\n observer.observe(document.head, { childList: true });\n \n console.log('[Universal Dark Mode] Loaded - Press Alt+Shift+D to toggle');\n})();", "Universal Dark Mode"); } } catch(__e) { console.warn('[Userscript:Universal Dark Mode]', __e); } })(); })();
Skip to content

Repository files navigation

LocusCompareR

1. Installation

LocusCompareR is an R package for visualization of GWAS-eQTL colocalization events.

Use the following commands to install LocusCompareR. If you don't have devtools, uncomment the first line to install it.

# install.packages("devtools")
devtools::install_github("boxiangliu/locuscomparer")

2. Example

To illustrate the use of locuscompare, we use the GWAS dataset from Nikpay et al. (2015) and the coronary artery eQTL dataset from GTEx v7 at the PHACTR1 locus:

library(locuscomparer)
gwas_fn = system.file('extdata','gwas.tsv', package = 'locuscomparer')
eqtl_fn = system.file('extdata','eqtl.tsv', package = 'locuscomparer')
locuscompare(in_fn1 = gwas_fn, in_fn2 = eqtl_fn, title1 = 'CAD GWAS', title2 = 'Coronary Artery eQTL')

The output from the main function is a figure like the following:

The labeled SNP is the lead SNP (in this case for both studies), and other SNPs are colored according to their LD $r^2$ with the lead SNP.

3. Using your own dataset:

The input to locuscompare::main() is a two-column tab-delimited text file with two columns:

  1. rsid
  2. pval

Here is an example file:

rsid	pval
rs62156064	0.564395
rs7562234	0.399642
rs11677377	0.34308
rs35076156	0.625237

You can download the example files below: GWAS and eQTL datasets.

Then run the following commands:

library(locuscomparer)
gwas_fn = 'path/to/gwas.tsv'
eqtl_fn = 'path/to/eqtl.tsv'
locuscompare(in_fn1 = gwas_fn, in_fn2 = eqtl_fn, title = 'GWAS', title2 = 'eQTL')

4. Documentations

To view documentation for each function, type ?[function name] in the R console.

LocusCompareR current export the following functions:

Data munging

  • assign_color: Assign color to each SNP according to LD.
  • get_lead_snp: Add a column of SNP labels to input data.frame.
  • get_position: Append two columns, chromosome (chr) and position (pos), to the input data.frame.

Plotting

  • locuscompare: Make a locuscompare plot.
  • make_combined_plot: Generated a combined plot with two locuszoom plots and a locuscompare plot.
  • make_locuszoom: Make a simple locuszoom plot.
  • make_scatterplot: Make a scatter plot (called the LocusCompare plot)

Data loading

  • read_metal" Read association summary statistics from file.
  • retrieve_LD: Retrive SNP pairwise LD from database.

About

LocusCompareR is a R package with visualization tools for comparing two genetic association datasets.

Resources

Stars

0 stars

Watchers

0 watching

Forks

Releases

Packages

Contributors

Languages