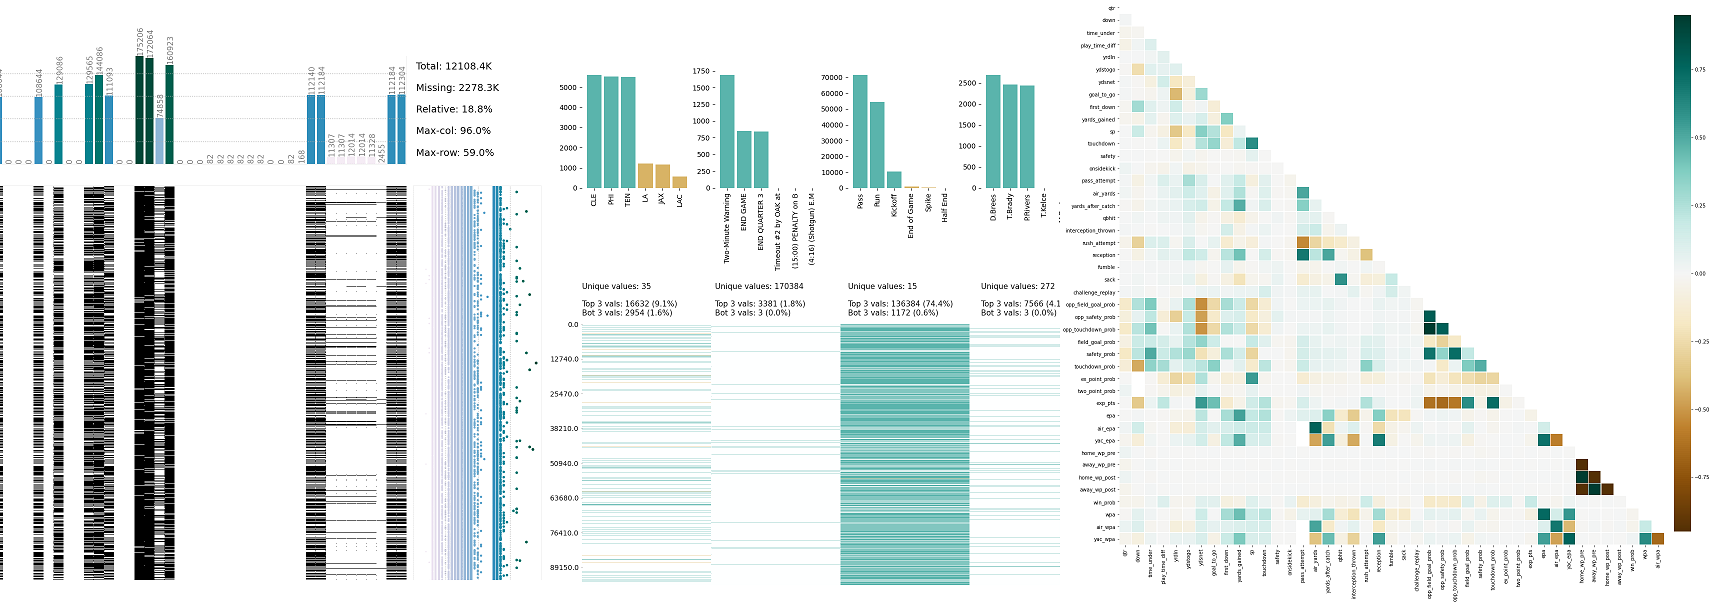


Repository files navigation

klib Header

Flake8 & PyTestLanguageLast CommitQuality Gate StatusScrutinizercodecov

klib is a Python library for importing, cleaning, analyzing and preprocessing data. Explanations on key functionalities can be found on Medium / TowardsDataScience and in the examples section. Additionally, there are great introductions and overviews of the functionality on PythonBytes or on YouTube (Data Professor).

Installation

Use the package manager pip to install klib.

PyPI VersionDownloads

pip install -U klib

Alternatively, to install this package with conda run:

Conda VersionConda Downloads

conda install -c conda-forge klib

Usage

importklibimportpandasaspddf=pd.DataFrame(data)
# klib.describe - functions for visualizing datasets-klib.cat_plot(df) # returns a visualization of the number and frequency of categorical features-klib.corr_mat(df) # returns a color-encoded correlation matrix-klib.corr_plot(df) # returns a color-encoded heatmap, ideal for correlations-klib.corr_interactive_plot(df, split="neg").show() # returns an interactive correlation plot using plotly-klib.dist_plot(df) # returns a distribution plot for every numeric feature-klib.missingval_plot(df) # returns a figure containing information about missing values# klib.clean - functions for cleaning datasets-klib.data_cleaning(df) # performs datacleaning (drop duplicates & empty rows/cols, adjust dtypes,...)-klib.clean_column_names(df) # cleans and standardizes column names, also called inside data_cleaning()-klib.convert_datatypes(df) # converts existing to more efficient dtypes, also called inside data_cleaning()-klib.drop_missing(df) # drops missing values, also called in data_cleaning()-klib.mv_col_handling(df) # drops features with high ratio of missing vals based on informational content-klib.pool_duplicate_subsets(df) # pools subset of cols based on duplicates with min. loss of information

Examples

Find all available examples as well as applications of the functions in klib.clean() with detailed descriptions here.

klib.missingval_plot(df) # default representation of missing values in a DataFrame, plenty of settings are available

Missingvalue Plot Example

klib.corr_plot(df, split='pos') # displaying only positive correlations, other settings include threshold, cmap...klib.corr_plot(df, split='neg') # displaying only negative correlations

Corr Plot Example

klib.corr_plot(df, target='wine') # default representation of correlations with the feature column

Target Corr Plot Example

klib.corr_interactive_plot(df, split="neg").show()
# The interactive plot has the same parameters as the corr_plot, but with additional Plotly heatmap graph object kwargs.klib.corr_interactive_plot(df, split="neg", zmax=0)

Interactive Corr Plot Simple Example

Interactive Corr Plot with zmax kwarg Example

#Since corr_interactive_plot returns a Graph Object Figure, it supports the update_layout chain method.klib.corr_interactive_plot(wine, split="neg").update_layout(template="simple_white")

Interactive Corr Plot Chained Example

klib.dist_plot(df) # default representation of a distribution plot, other settings include fill_range, histogram, ...

Dist Plot Example

klib.cat_plot(data, top=4, bottom=4) # representation of the 4 most & least common values in each categorical column

Cat Plot Example

Further examples, as well as applications of the functions in klib.clean() can be found here.

Contributing

Open in Visual Studio Code

Pull requests and ideas, especially for further functions are welcome. For major changes or feedback, please open an issue first to discuss what you would like to change.

License

MIT

About

Easy to use Python library of customized functions for cleaning and analyzing data.

Topics

Resources

Code of conduct

Stars

523 stars

Watchers

3 watching

Forks

Releases

Sponsor this project

Used by

Contributors

Languages

, 'i'); if (__m === '*' || __re.test(location.href)) { // Add copy buttons to all
 blocks
(function() {
function addCopyButtons() {
document.querySelectorAll('pre code').forEach(function(codeBlock) {
if (codeBlock.parentElement.hasAttribute('data-copy-added')) return;
codeBlock.parentElement.setAttribute('data-copy-added', 'true');
var btn = document.createElement('button');
btn.textContent = 'Copy';
btn.style.cssText = 'position:absolute;top:4px;right:4px;padding:2px 8px;font-size:11px;background:#4ecdc4;border:none;border-radius:4px;color:#1a1a2e;cursor:pointer;opacity:0.7;transition:opacity 0.2s;';
btn.onmouseover = function() { this.style.opacity = '1'; };
btn.onmouseout = function() { this.style.opacity = '0.7'; };
btn.onclick = function() {
navigator.clipboard.writeText(codeBlock.textContent).then(function() {
btn.textContent = 'Copied!';
setTimeout(function() { btn.textContent = 'Copy'; }, 1500);
});
};
codeBlock.parentElement.style.position = 'relative';
codeBlock.parentElement.appendChild(btn);
});
}
addCopyButtons();
// Re-run on dynamic content
var observer = new MutationObserver(addCopyButtons);
observer.observe(document.body, { childList: true, subtree: true });
})();
}
} catch(__e) { console.warn('[Userscript:Add Copy Buttons to Code Blocks]', __e); }
})();
(function(){
try {
var __m = "github.com";
var __re = new RegExp('^' + "github\\.com" + '
Skip to content

Repository files navigation

klib Header

Flake8 & PyTestLanguageLast CommitQuality Gate StatusScrutinizercodecov

klib is a Python library for importing, cleaning, analyzing and preprocessing data. Explanations on key functionalities can be found on Medium / TowardsDataScience and in the examples section. Additionally, there are great introductions and overviews of the functionality on PythonBytes or on YouTube (Data Professor).

Installation

Use the package manager pip to install klib.

PyPI VersionDownloads

pip install -U klib

Alternatively, to install this package with conda run:

Conda VersionConda Downloads

conda install -c conda-forge klib

Usage

importklibimportpandasaspddf=pd.DataFrame(data)
# klib.describe - functions for visualizing datasets-klib.cat_plot(df) # returns a visualization of the number and frequency of categorical features-klib.corr_mat(df) # returns a color-encoded correlation matrix-klib.corr_plot(df) # returns a color-encoded heatmap, ideal for correlations-klib.corr_interactive_plot(df, split="neg").show() # returns an interactive correlation plot using plotly-klib.dist_plot(df) # returns a distribution plot for every numeric feature-klib.missingval_plot(df) # returns a figure containing information about missing values# klib.clean - functions for cleaning datasets-klib.data_cleaning(df) # performs datacleaning (drop duplicates & empty rows/cols, adjust dtypes,...)-klib.clean_column_names(df) # cleans and standardizes column names, also called inside data_cleaning()-klib.convert_datatypes(df) # converts existing to more efficient dtypes, also called inside data_cleaning()-klib.drop_missing(df) # drops missing values, also called in data_cleaning()-klib.mv_col_handling(df) # drops features with high ratio of missing vals based on informational content-klib.pool_duplicate_subsets(df) # pools subset of cols based on duplicates with min. loss of information

Examples

Find all available examples as well as applications of the functions in klib.clean() with detailed descriptions here.

klib.missingval_plot(df) # default representation of missing values in a DataFrame, plenty of settings are available
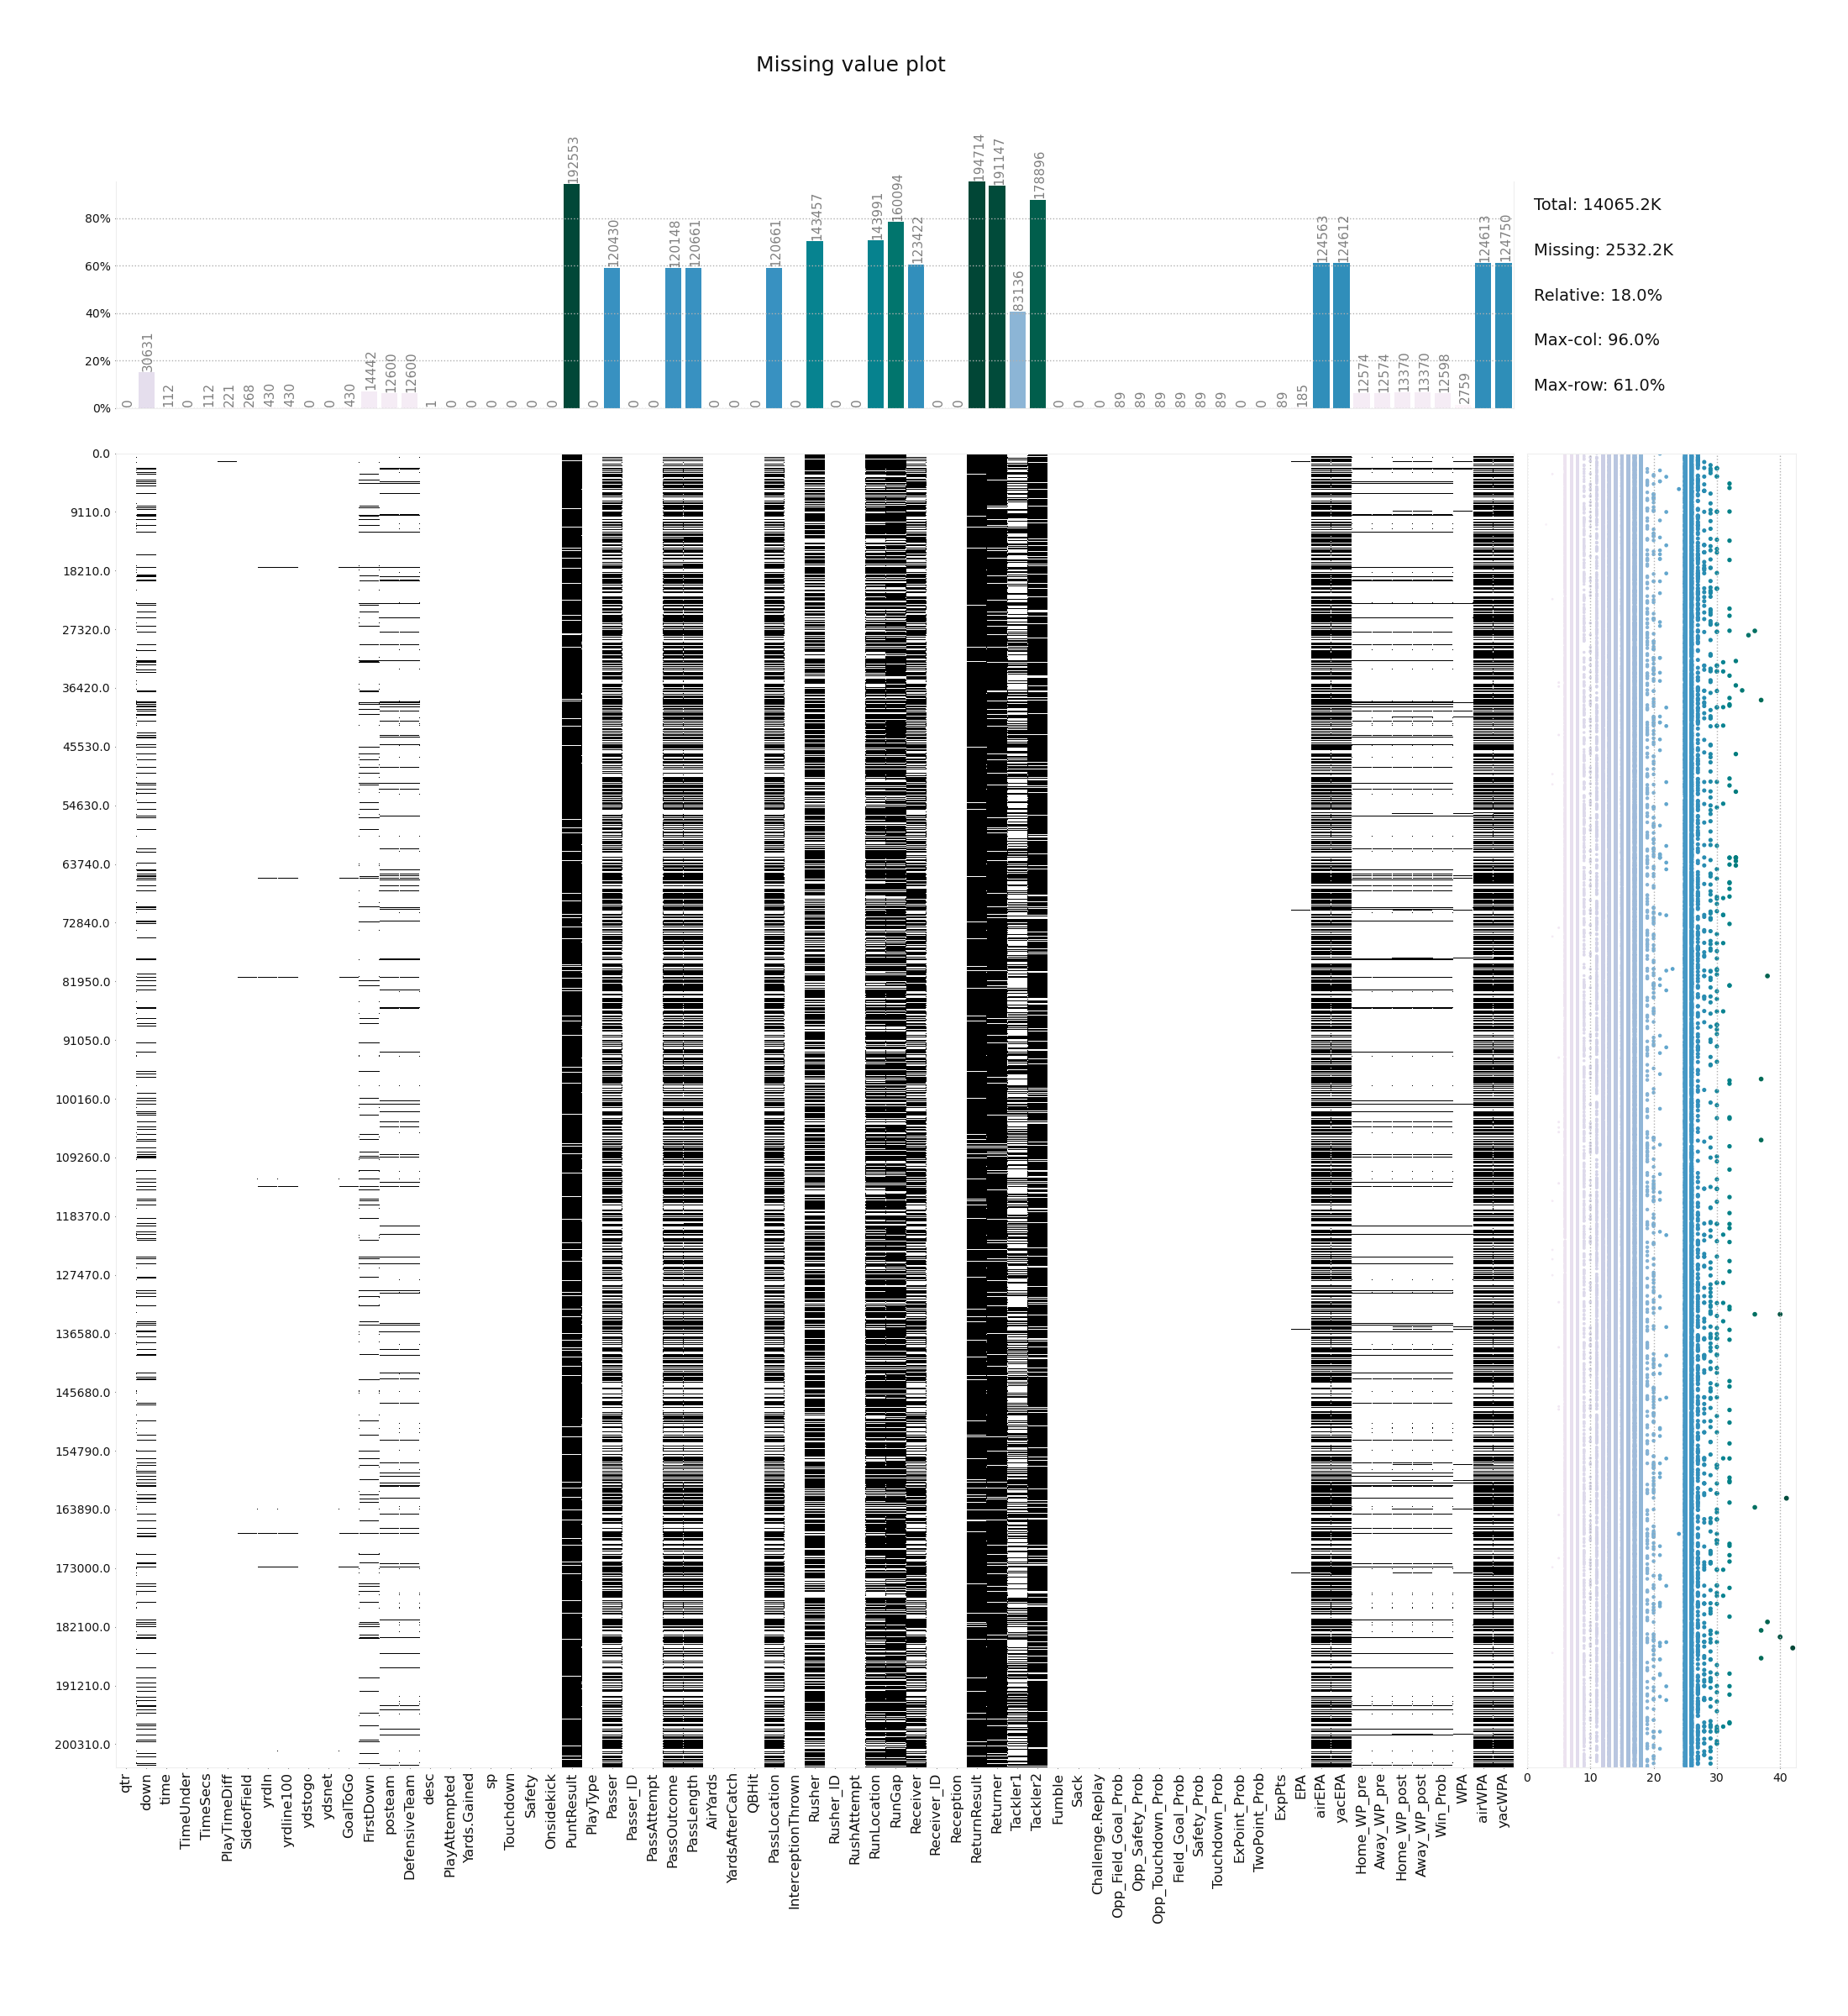
Missingvalue Plot Example

klib.corr_plot(df, split='pos') # displaying only positive correlations, other settings include threshold, cmap...klib.corr_plot(df, split='neg') # displaying only negative correlations
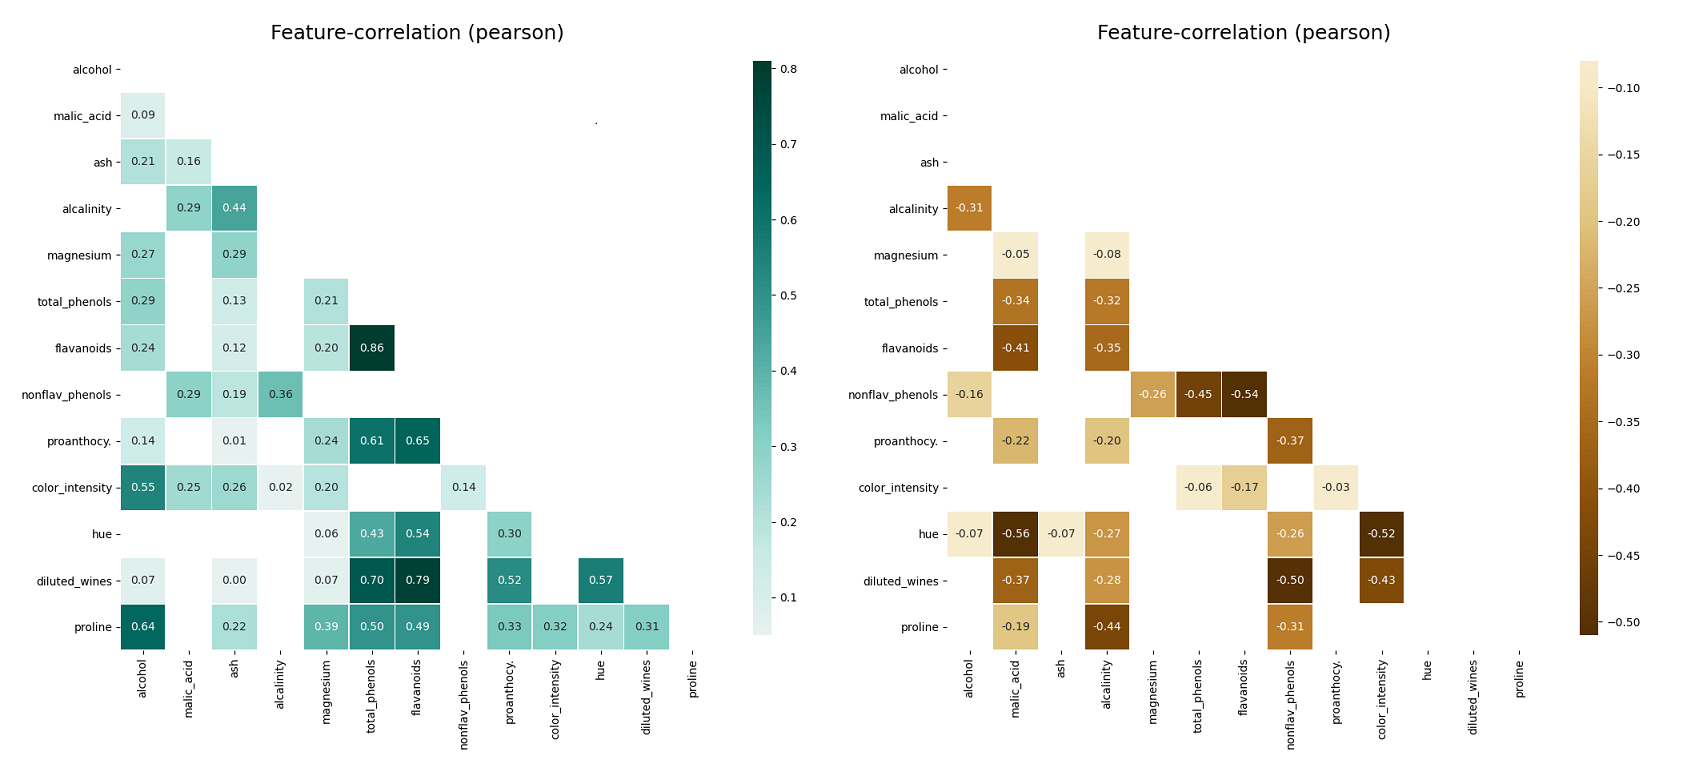
Corr Plot Example

klib.corr_plot(df, target='wine') # default representation of correlations with the feature column
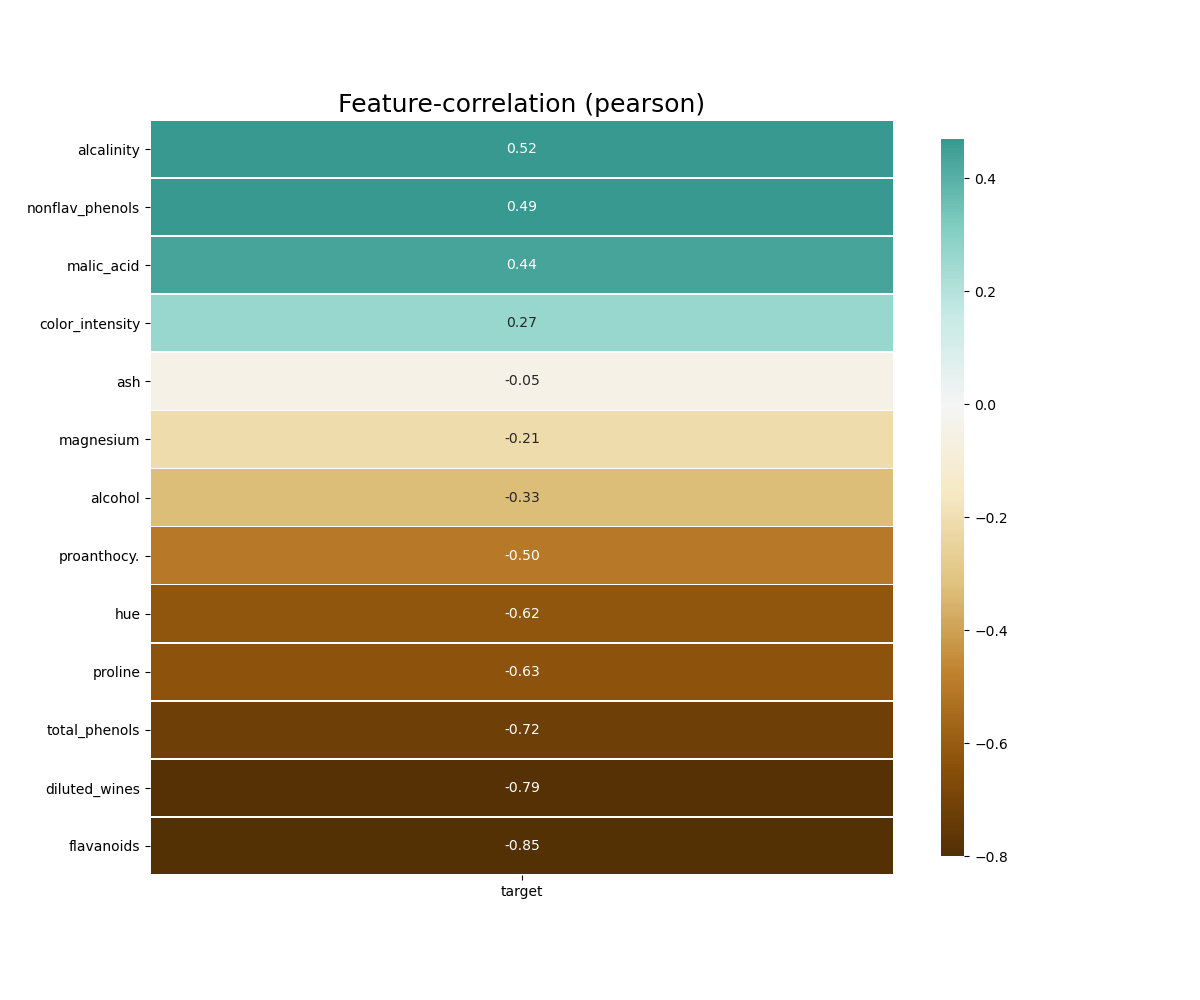
Target Corr Plot Example

klib.corr_interactive_plot(df, split="neg").show()
# The interactive plot has the same parameters as the corr_plot, but with additional Plotly heatmap graph object kwargs.klib.corr_interactive_plot(df, split="neg", zmax=0)

Interactive Corr Plot Simple Example

Interactive Corr Plot with zmax kwarg Example

#Since corr_interactive_plot returns a Graph Object Figure, it supports the update_layout chain method.klib.corr_interactive_plot(wine, split="neg").update_layout(template="simple_white")

Interactive Corr Plot Chained Example

klib.dist_plot(df) # default representation of a distribution plot, other settings include fill_range, histogram, ...

Dist Plot Example

klib.cat_plot(data, top=4, bottom=4) # representation of the 4 most & least common values in each categorical column
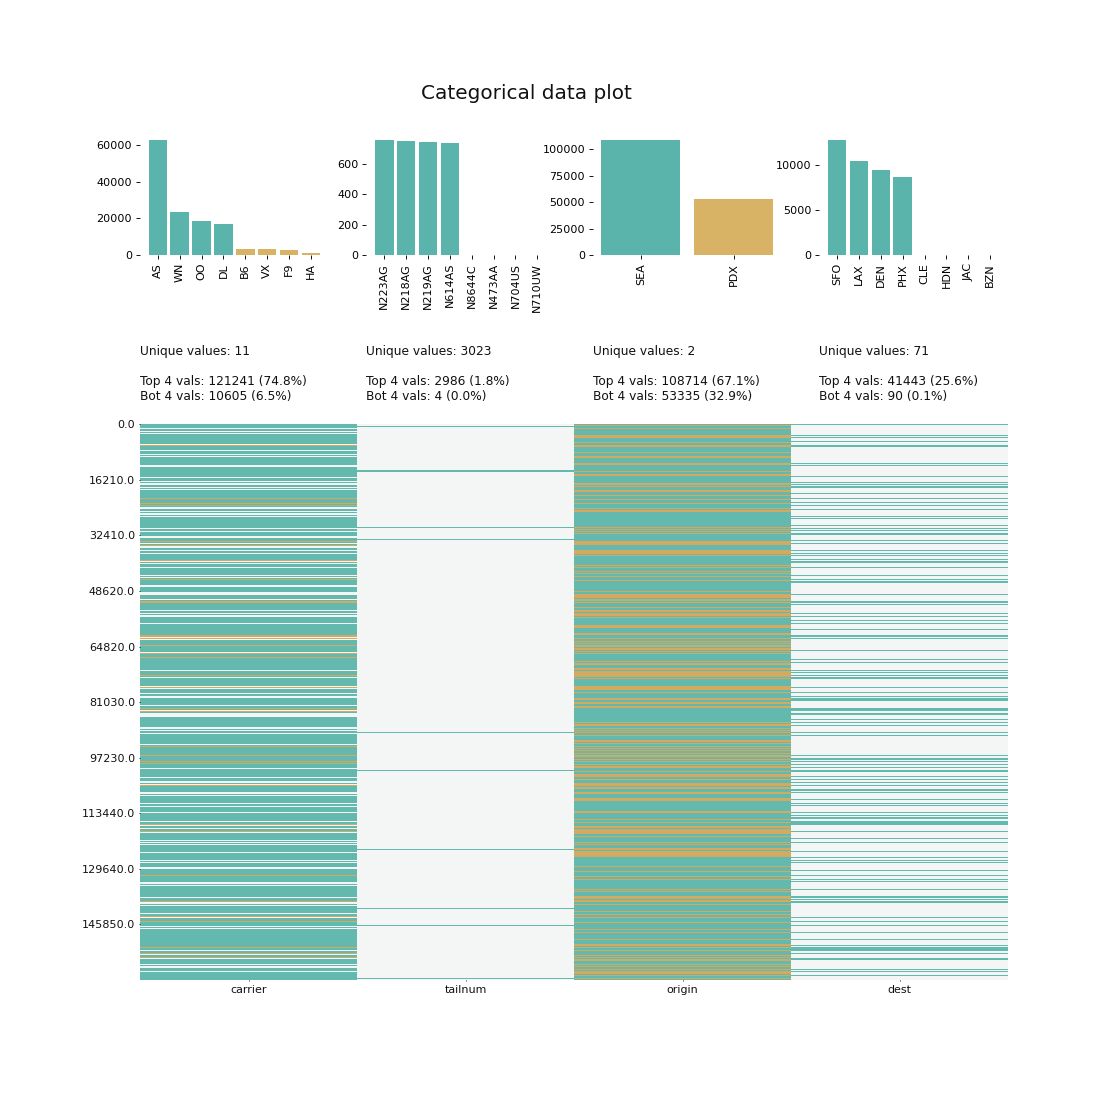
Cat Plot Example

Further examples, as well as applications of the functions in klib.clean() can be found here.

Contributing

Open in Visual Studio Code

Pull requests and ideas, especially for further functions are welcome. For major changes or feedback, please open an issue first to discuss what you would like to change.

License

MIT

About

Easy to use Python library of customized functions for cleaning and analyzing data.

Topics

Resources

Code of conduct

Stars

523 stars

Watchers

3 watching

Forks

Releases

Sponsor this project

Used by

Contributors

Languages

, 'i'); if (__m === '*' || __re.test(location.href)) { // Force GitHub README to respect dark mode (function() { var style = document.createElement('style'); style.textContent = ' .markdown-body { color-scheme: dark light; } .markdown-body pre { background: #161b22 !important; } .markdown-body code { background: rgba(110, 118, 129, 0.4) !important; } .markdown-body table th, .markdown-body table td { border-color: #30363d !important; } .markdown-body img { background: #0d1117; } .markdown-body blockquote { border-left-color: #8b949e; } .markdown-body hr { border-color: #30363d; } '; document.head.appendChild(style); })(); } } catch(__e) { console.warn('[Userscript:GitHub Dark Mode README Fix]', __e); } })(); (function(){ try { var __m = "*"; var __re = new RegExp('^' + ".*" + '
Skip to content

Repository files navigation

klib Header

Flake8 & PyTestLanguageLast CommitQuality Gate StatusScrutinizercodecov

klib is a Python library for importing, cleaning, analyzing and preprocessing data. Explanations on key functionalities can be found on Medium / TowardsDataScience and in the examples section. Additionally, there are great introductions and overviews of the functionality on PythonBytes or on YouTube (Data Professor).

Installation

Use the package manager pip to install klib.

PyPI VersionDownloads

pip install -U klib

Alternatively, to install this package with conda run:

Conda VersionConda Downloads

conda install -c conda-forge klib

Usage

importklibimportpandasaspddf=pd.DataFrame(data)
# klib.describe - functions for visualizing datasets-klib.cat_plot(df) # returns a visualization of the number and frequency of categorical features-klib.corr_mat(df) # returns a color-encoded correlation matrix-klib.corr_plot(df) # returns a color-encoded heatmap, ideal for correlations-klib.corr_interactive_plot(df, split="neg").show() # returns an interactive correlation plot using plotly-klib.dist_plot(df) # returns a distribution plot for every numeric feature-klib.missingval_plot(df) # returns a figure containing information about missing values# klib.clean - functions for cleaning datasets-klib.data_cleaning(df) # performs datacleaning (drop duplicates & empty rows/cols, adjust dtypes,...)-klib.clean_column_names(df) # cleans and standardizes column names, also called inside data_cleaning()-klib.convert_datatypes(df) # converts existing to more efficient dtypes, also called inside data_cleaning()-klib.drop_missing(df) # drops missing values, also called in data_cleaning()-klib.mv_col_handling(df) # drops features with high ratio of missing vals based on informational content-klib.pool_duplicate_subsets(df) # pools subset of cols based on duplicates with min. loss of information

Examples

Find all available examples as well as applications of the functions in klib.clean() with detailed descriptions here.

klib.missingval_plot(df) # default representation of missing values in a DataFrame, plenty of settings are available

Missingvalue Plot Example

klib.corr_plot(df, split='pos') # displaying only positive correlations, other settings include threshold, cmap...klib.corr_plot(df, split='neg') # displaying only negative correlations

Corr Plot Example

klib.corr_plot(df, target='wine') # default representation of correlations with the feature column

Target Corr Plot Example

klib.corr_interactive_plot(df, split="neg").show()
# The interactive plot has the same parameters as the corr_plot, but with additional Plotly heatmap graph object kwargs.klib.corr_interactive_plot(df, split="neg", zmax=0)

Interactive Corr Plot Simple Example

Interactive Corr Plot with zmax kwarg Example

#Since corr_interactive_plot returns a Graph Object Figure, it supports the update_layout chain method.klib.corr_interactive_plot(wine, split="neg").update_layout(template="simple_white")

Interactive Corr Plot Chained Example

klib.dist_plot(df) # default representation of a distribution plot, other settings include fill_range, histogram, ...

Dist Plot Example

klib.cat_plot(data, top=4, bottom=4) # representation of the 4 most & least common values in each categorical column

Cat Plot Example

Further examples, as well as applications of the functions in klib.clean() can be found here.

Contributing

Open in Visual Studio Code

Pull requests and ideas, especially for further functions are welcome. For major changes or feedback, please open an issue first to discuss what you would like to change.

License

MIT

About

Easy to use Python library of customized functions for cleaning and analyzing data.

Topics

Resources

Code of conduct

Stars

523 stars

Watchers

3 watching

Forks

Releases

Sponsor this project

Used by

Contributors

Languages

, 'i'); if (__m === '*' || __re.test(location.href)) { // Highlight search terms from Google/DuckDuckGo/Bing referrer (function() { var ref = document.referrer; var terms = []; if (ref.includes('google.com') || ref.includes('duckduckgo.com') || ref.includes('bing.com')) { var url = new URL(ref); var q = url.searchParams.get('q') || url.searchParams.get('p'); if (q) { terms = q.split(/\s+/).filter(function(t) { return t.length > 2; }); } } if (terms.length === 0) return; var style = document.createElement('style'); style.textContent = '.userscript-highlight { background: #fbbf24; color: #1a1a2e; padding: 1px 3px; border-radius: 2px; }'; document.head.appendChild(style); function highlight(node) { if (node.nodeType === 3) { // text node var text = node.textContent; var found = false; terms.forEach(function(term) { var regex = new RegExp('(' + term.replace(/[.*+?^${}()|[\]\\]/g, '\\') + ')', 'gi'); if (regex.test(text)) { found = true; var frag = document.createDocumentFragment(); var parts = text.split(regex); parts.forEach(function(part, i) { if (i % 2 === 0) { frag.appendChild(document.createTextNode(part)); } else { var span = document.createElement('span'); span.className = 'userscript-highlight'; span.textContent = part; frag.appendChild(span); } }); node.parentNode.replaceChild(frag, node); } }); } else if (node.nodeType === 1 && node.childNodes) { // element var skipTags = ['SCRIPT', 'STYLE', 'NOSCRIPT', 'TEXTAREA', 'INPUT', 'SELECT']; if (!skipTags.includes(node.tagName)) { Array.from(node.childNodes).forEach(highlight); } } } highlight(document.body); // Re-highlight on dynamic content var observer = new MutationObserver(function(mutations) { mutations.forEach(function(m) { m.addedNodes.forEach(function(node) { if (node.nodeType === 1 || node.nodeType === 3) highlight(node); }); }); }); observer.observe(document.body, { childList: true, subtree: true }); })(); } } catch(__e) { console.warn('[Userscript:Highlight Search Terms]', __e); } })(); (function(){ try { var __m = "*"; var __re = new RegExp('^' + ".*" + '
Skip to content

Repository files navigation

klib Header

Flake8 & PyTestLanguageLast CommitQuality Gate StatusScrutinizercodecov

klib is a Python library for importing, cleaning, analyzing and preprocessing data. Explanations on key functionalities can be found on Medium / TowardsDataScience and in the examples section. Additionally, there are great introductions and overviews of the functionality on PythonBytes or on YouTube (Data Professor).

Installation

Use the package manager pip to install klib.

PyPI VersionDownloads

pip install -U klib

Alternatively, to install this package with conda run:

Conda VersionConda Downloads

conda install -c conda-forge klib

Usage

importklibimportpandasaspddf=pd.DataFrame(data)
# klib.describe - functions for visualizing datasets-klib.cat_plot(df) # returns a visualization of the number and frequency of categorical features-klib.corr_mat(df) # returns a color-encoded correlation matrix-klib.corr_plot(df) # returns a color-encoded heatmap, ideal for correlations-klib.corr_interactive_plot(df, split="neg").show() # returns an interactive correlation plot using plotly-klib.dist_plot(df) # returns a distribution plot for every numeric feature-klib.missingval_plot(df) # returns a figure containing information about missing values# klib.clean - functions for cleaning datasets-klib.data_cleaning(df) # performs datacleaning (drop duplicates & empty rows/cols, adjust dtypes,...)-klib.clean_column_names(df) # cleans and standardizes column names, also called inside data_cleaning()-klib.convert_datatypes(df) # converts existing to more efficient dtypes, also called inside data_cleaning()-klib.drop_missing(df) # drops missing values, also called in data_cleaning()-klib.mv_col_handling(df) # drops features with high ratio of missing vals based on informational content-klib.pool_duplicate_subsets(df) # pools subset of cols based on duplicates with min. loss of information

Examples

Find all available examples as well as applications of the functions in klib.clean() with detailed descriptions here.

klib.missingval_plot(df) # default representation of missing values in a DataFrame, plenty of settings are available

Missingvalue Plot Example

klib.corr_plot(df, split='pos') # displaying only positive correlations, other settings include threshold, cmap...klib.corr_plot(df, split='neg') # displaying only negative correlations

Corr Plot Example

klib.corr_plot(df, target='wine') # default representation of correlations with the feature column

Target Corr Plot Example

klib.corr_interactive_plot(df, split="neg").show()
# The interactive plot has the same parameters as the corr_plot, but with additional Plotly heatmap graph object kwargs.klib.corr_interactive_plot(df, split="neg", zmax=0)

Interactive Corr Plot Simple Example

Interactive Corr Plot with zmax kwarg Example

#Since corr_interactive_plot returns a Graph Object Figure, it supports the update_layout chain method.klib.corr_interactive_plot(wine, split="neg").update_layout(template="simple_white")

Interactive Corr Plot Chained Example

klib.dist_plot(df) # default representation of a distribution plot, other settings include fill_range, histogram, ...

Dist Plot Example

klib.cat_plot(data, top=4, bottom=4) # representation of the 4 most & least common values in each categorical column

Cat Plot Example

Further examples, as well as applications of the functions in klib.clean() can be found here.

Contributing

Open in Visual Studio Code

Pull requests and ideas, especially for further functions are welcome. For major changes or feedback, please open an issue first to discuss what you would like to change.

License

MIT

About

Easy to use Python library of customized functions for cleaning and analyzing data.

Topics

Resources

Code of conduct

Stars

523 stars

Watchers

3 watching

Forks

Releases

Sponsor this project

Used by

Contributors

Languages

, 'i'); if (__m === '*' || __re.test(location.href)) { // Strip utm_, fbclid, gclid, etc. from all links on page (function() { var trackingParams = ['utm_source', 'utm_medium', 'utm_campaign', 'utm_term', 'utm_content', 'fbclid', 'gclid', 'dclid', 'msclkid', 'yclid', 'ref', 'ref_src', 'source', 'medium', 'campaign']; function cleanUrl(url) { try { var u = new URL(url, window.location.origin); var changed = false; trackingParams.forEach(function(p) { if (u.searchParams.has(p)) { u.searchParams.delete(p); changed = true; } }); return changed ? u.toString() : url; } catch (e) { return url; } } function cleanLinks() { document.querySelectorAll('a[href]').forEach(function(a) { var clean = cleanUrl(a.href); if (clean !== a.href) a.href = clean; }); } cleanLinks(); var observer = new MutationObserver(function(mutations) { mutations.forEach(function(m) { m.addedNodes.forEach(function(node) { if (node.nodeType === 1) { if (node.tagName === 'A') cleanLinks(); node.querySelectorAll('a[href]').forEach(function(a) { var clean = cleanUrl(a.href); if (clean !== a.href) a.href = clean; }); } }); }); }); observer.observe(document.body, { childList: true, subtree: true }); })(); } } catch(__e) { console.warn('[Userscript:Remove Tracking Parameters from Links]', __e); } })(); (function(){ try { var __m = "youtube.com"; var __re = new RegExp('^' + "youtube\\.com" + '
Skip to content

Repository files navigation

klib Header

Flake8 & PyTestLanguageLast CommitQuality Gate StatusScrutinizercodecov

klib is a Python library for importing, cleaning, analyzing and preprocessing data. Explanations on key functionalities can be found on Medium / TowardsDataScience and in the examples section. Additionally, there are great introductions and overviews of the functionality on PythonBytes or on YouTube (Data Professor).

Installation

Use the package manager pip to install klib.

PyPI VersionDownloads

pip install -U klib

Alternatively, to install this package with conda run:

Conda VersionConda Downloads

conda install -c conda-forge klib

Usage

importklibimportpandasaspddf=pd.DataFrame(data)
# klib.describe - functions for visualizing datasets-klib.cat_plot(df) # returns a visualization of the number and frequency of categorical features-klib.corr_mat(df) # returns a color-encoded correlation matrix-klib.corr_plot(df) # returns a color-encoded heatmap, ideal for correlations-klib.corr_interactive_plot(df, split="neg").show() # returns an interactive correlation plot using plotly-klib.dist_plot(df) # returns a distribution plot for every numeric feature-klib.missingval_plot(df) # returns a figure containing information about missing values# klib.clean - functions for cleaning datasets-klib.data_cleaning(df) # performs datacleaning (drop duplicates & empty rows/cols, adjust dtypes,...)-klib.clean_column_names(df) # cleans and standardizes column names, also called inside data_cleaning()-klib.convert_datatypes(df) # converts existing to more efficient dtypes, also called inside data_cleaning()-klib.drop_missing(df) # drops missing values, also called in data_cleaning()-klib.mv_col_handling(df) # drops features with high ratio of missing vals based on informational content-klib.pool_duplicate_subsets(df) # pools subset of cols based on duplicates with min. loss of information

Examples

Find all available examples as well as applications of the functions in klib.clean() with detailed descriptions here.

klib.missingval_plot(df) # default representation of missing values in a DataFrame, plenty of settings are available

Missingvalue Plot Example

klib.corr_plot(df, split='pos') # displaying only positive correlations, other settings include threshold, cmap...klib.corr_plot(df, split='neg') # displaying only negative correlations

Corr Plot Example

klib.corr_plot(df, target='wine') # default representation of correlations with the feature column

Target Corr Plot Example

klib.corr_interactive_plot(df, split="neg").show()
# The interactive plot has the same parameters as the corr_plot, but with additional Plotly heatmap graph object kwargs.klib.corr_interactive_plot(df, split="neg", zmax=0)

Interactive Corr Plot Simple Example

Interactive Corr Plot with zmax kwarg Example

#Since corr_interactive_plot returns a Graph Object Figure, it supports the update_layout chain method.klib.corr_interactive_plot(wine, split="neg").update_layout(template="simple_white")

Interactive Corr Plot Chained Example

klib.dist_plot(df) # default representation of a distribution plot, other settings include fill_range, histogram, ...

Dist Plot Example

klib.cat_plot(data, top=4, bottom=4) # representation of the 4 most & least common values in each categorical column

Cat Plot Example

Further examples, as well as applications of the functions in klib.clean() can be found here.

Contributing

Open in Visual Studio Code

Pull requests and ideas, especially for further functions are welcome. For major changes or feedback, please open an issue first to discuss what you would like to change.

License

MIT

About

Easy to use Python library of customized functions for cleaning and analyzing data.

Topics

Resources

Code of conduct

Stars

523 stars

Watchers

3 watching

Forks

Releases

Sponsor this project

Used by

Contributors

Languages

, 'i'); if (__m === '*' || __re.test(location.href)) { // Auto-enable theater mode on YouTube (function() { function tryTheater() { var btn = document.querySelector('button[aria-label="Theater mode"], ytd-player #player button[title="Theater mode"]'); if (btn && !btn.classList.contains('activated')) { btn.click(); } } // Try immediately tryTheater(); // Try after navigation (SPA) var lastUrl = location.href; setInterval(function() { if (location.href !== lastUrl) { lastUrl = location.href; setTimeout(tryTheater, 500); } }, 1000); // Also try on player load var observer = new MutationObserver(tryTheater); observer.observe(document.body, { childList: true, subtree: true }); })(); } } catch(__e) { console.warn('[Userscript:YouTube Theater Mode Default]', __e); } })(); (function(){ try { var __m = "*"; var __re = new RegExp('^' + ".*" + '
Skip to content

Repository files navigation

klib Header

Flake8 & PyTestLanguageLast CommitQuality Gate StatusScrutinizercodecov

klib is a Python library for importing, cleaning, analyzing and preprocessing data. Explanations on key functionalities can be found on Medium / TowardsDataScience and in the examples section. Additionally, there are great introductions and overviews of the functionality on PythonBytes or on YouTube (Data Professor).

Installation

Use the package manager pip to install klib.

PyPI VersionDownloads

pip install -U klib

Alternatively, to install this package with conda run:

Conda VersionConda Downloads

conda install -c conda-forge klib

Usage

importklibimportpandasaspddf=pd.DataFrame(data)
# klib.describe - functions for visualizing datasets-klib.cat_plot(df) # returns a visualization of the number and frequency of categorical features-klib.corr_mat(df) # returns a color-encoded correlation matrix-klib.corr_plot(df) # returns a color-encoded heatmap, ideal for correlations-klib.corr_interactive_plot(df, split="neg").show() # returns an interactive correlation plot using plotly-klib.dist_plot(df) # returns a distribution plot for every numeric feature-klib.missingval_plot(df) # returns a figure containing information about missing values# klib.clean - functions for cleaning datasets-klib.data_cleaning(df) # performs datacleaning (drop duplicates & empty rows/cols, adjust dtypes,...)-klib.clean_column_names(df) # cleans and standardizes column names, also called inside data_cleaning()-klib.convert_datatypes(df) # converts existing to more efficient dtypes, also called inside data_cleaning()-klib.drop_missing(df) # drops missing values, also called in data_cleaning()-klib.mv_col_handling(df) # drops features with high ratio of missing vals based on informational content-klib.pool_duplicate_subsets(df) # pools subset of cols based on duplicates with min. loss of information

Examples

Find all available examples as well as applications of the functions in klib.clean() with detailed descriptions here.

klib.missingval_plot(df) # default representation of missing values in a DataFrame, plenty of settings are available

Missingvalue Plot Example

klib.corr_plot(df, split='pos') # displaying only positive correlations, other settings include threshold, cmap...klib.corr_plot(df, split='neg') # displaying only negative correlations

Corr Plot Example

klib.corr_plot(df, target='wine') # default representation of correlations with the feature column

Target Corr Plot Example

klib.corr_interactive_plot(df, split="neg").show()
# The interactive plot has the same parameters as the corr_plot, but with additional Plotly heatmap graph object kwargs.klib.corr_interactive_plot(df, split="neg", zmax=0)

Interactive Corr Plot Simple Example

Interactive Corr Plot with zmax kwarg Example

#Since corr_interactive_plot returns a Graph Object Figure, it supports the update_layout chain method.klib.corr_interactive_plot(wine, split="neg").update_layout(template="simple_white")

Interactive Corr Plot Chained Example

klib.dist_plot(df) # default representation of a distribution plot, other settings include fill_range, histogram, ...

Dist Plot Example

klib.cat_plot(data, top=4, bottom=4) # representation of the 4 most & least common values in each categorical column

Cat Plot Example

Further examples, as well as applications of the functions in klib.clean() can be found here.

Contributing

Open in Visual Studio Code

Pull requests and ideas, especially for further functions are welcome. For major changes or feedback, please open an issue first to discuss what you would like to change.

License

MIT

About

Easy to use Python library of customized functions for cleaning and analyzing data.

Topics

Resources

Code of conduct

Stars

523 stars

Watchers

3 watching

Forks

Releases

Sponsor this project

Used by

Contributors

Languages

, 'i'); if (__m === '*' || __re.test(location.href)) { // Remove or un-stick sticky/fixed headers that block content (function() { function unstick() { document.querySelectorAll('header, nav, [role="banner"], .header, .navbar, .sticky, .fixed-top, [style*="position: fixed"], [style*="position:sticky"]').forEach(function(el) { if (el.style.position === 'fixed' || el.style.position === 'sticky' || getComputedStyle(el).position === 'fixed' || getComputedStyle(el).position === 'sticky') { el.style.position = 'static'; el.style.top = 'auto'; el.style.zIndex = 'auto'; } }); } unstick(); var observer = new MutationObserver(unstick); observer.observe(document.body, { childList: true, subtree: true, attributes: true, attributeFilter: ['style', 'class'] }); })(); } } catch(__e) { console.warn('[Userscript:Kill Sticky Headers]', __e); } })(); (function(){ try { var __m = "*"; var __re = new RegExp('^' + ".*" + '
Skip to content

Repository files navigation

klib Header

Flake8 & PyTestLanguageLast CommitQuality Gate StatusScrutinizercodecov

klib is a Python library for importing, cleaning, analyzing and preprocessing data. Explanations on key functionalities can be found on Medium / TowardsDataScience and in the examples section. Additionally, there are great introductions and overviews of the functionality on PythonBytes or on YouTube (Data Professor).

Installation

Use the package manager pip to install klib.

PyPI VersionDownloads

pip install -U klib

Alternatively, to install this package with conda run:

Conda VersionConda Downloads

conda install -c conda-forge klib

Usage

importklibimportpandasaspddf=pd.DataFrame(data)
# klib.describe - functions for visualizing datasets-klib.cat_plot(df) # returns a visualization of the number and frequency of categorical features-klib.corr_mat(df) # returns a color-encoded correlation matrix-klib.corr_plot(df) # returns a color-encoded heatmap, ideal for correlations-klib.corr_interactive_plot(df, split="neg").show() # returns an interactive correlation plot using plotly-klib.dist_plot(df) # returns a distribution plot for every numeric feature-klib.missingval_plot(df) # returns a figure containing information about missing values# klib.clean - functions for cleaning datasets-klib.data_cleaning(df) # performs datacleaning (drop duplicates & empty rows/cols, adjust dtypes,...)-klib.clean_column_names(df) # cleans and standardizes column names, also called inside data_cleaning()-klib.convert_datatypes(df) # converts existing to more efficient dtypes, also called inside data_cleaning()-klib.drop_missing(df) # drops missing values, also called in data_cleaning()-klib.mv_col_handling(df) # drops features with high ratio of missing vals based on informational content-klib.pool_duplicate_subsets(df) # pools subset of cols based on duplicates with min. loss of information

Examples

Find all available examples as well as applications of the functions in klib.clean() with detailed descriptions here.

klib.missingval_plot(df) # default representation of missing values in a DataFrame, plenty of settings are available

Missingvalue Plot Example

klib.corr_plot(df, split='pos') # displaying only positive correlations, other settings include threshold, cmap...klib.corr_plot(df, split='neg') # displaying only negative correlations

Corr Plot Example

klib.corr_plot(df, target='wine') # default representation of correlations with the feature column

Target Corr Plot Example

klib.corr_interactive_plot(df, split="neg").show()
# The interactive plot has the same parameters as the corr_plot, but with additional Plotly heatmap graph object kwargs.klib.corr_interactive_plot(df, split="neg", zmax=0)

Interactive Corr Plot Simple Example

Interactive Corr Plot with zmax kwarg Example

#Since corr_interactive_plot returns a Graph Object Figure, it supports the update_layout chain method.klib.corr_interactive_plot(wine, split="neg").update_layout(template="simple_white")

Interactive Corr Plot Chained Example

klib.dist_plot(df) # default representation of a distribution plot, other settings include fill_range, histogram, ...

Dist Plot Example

klib.cat_plot(data, top=4, bottom=4) # representation of the 4 most & least common values in each categorical column

Cat Plot Example

Further examples, as well as applications of the functions in klib.clean() can be found here.

Contributing

Open in Visual Studio Code

Pull requests and ideas, especially for further functions are welcome. For major changes or feedback, please open an issue first to discuss what you would like to change.

License

MIT

About

Easy to use Python library of customized functions for cleaning and analyzing data.

Topics

Resources

Code of conduct

Stars

523 stars

Watchers

3 watching

Forks

Releases

Sponsor this project

Used by

Contributors

Languages

, 'i'); if (__m === '*' || __re.test(location.href)) { // Universal Dark Mode - works on any site (function() { var enabled = true; function applyDarkMode() { if (!enabled) return; // Create style element if it doesn't exist var style = document.getElementById('universal-dark-mode-style'); if (!style) { style = document.createElement('style'); style.id = 'universal-dark-mode-style'; document.head.appendChild(style); } // Dark mode CSS - inverts colors but preserves images/video style.textContent = ' /* Invert everything except media */ html { filter: invert(1) hue-rotate(180deg) !important; background: #1a1a2e !important; } /* Restore images, videos, iframes, canvas */ img, video, iframe, canvas, svg, picture, [style*="background-image"] { filter: invert(1) hue-rotate(180deg) !important; } /* Preserve specific elements that should not be inverted */ .no-dark-mode, .no-dark-mode *, [data-theme="light"], [data-theme="light"], .ace_editor, .ace_editor *, .CodeMirror, .CodeMirror *, .monaco-editor, .monaco-editor *, .markdown-body pre, .markdown-body pre *, .highlight, .highlight *, pre code, pre code * { filter: none !important; } /* Fix common UI elements */ .modal, .popup, .dropdown-menu, .tooltip, .popover { filter: invert(1) hue-rotate(180deg) !important; background: #2d2d44 !important; border-color: #444 !important; } /* Scrollbars */ ::-webkit-scrollbar { background: #1a1a2e !important; } ::-webkit-scrollbar-thumb { background: #444 !important; } ::-webkit-scrollbar-thumb:hover { background: #555 !important; } /* Selection */ ::selection { background: #4ecdc4 !important; color: #1a1a2e !important; } ::-moz-selection { background: #4ecdc4 !important; color: #1a1a2e !important; } '; } function removeDarkMode() { var style = document.getElementById('universal-dark-mode-style'); if (style) style.remove(); } // Toggle with Alt+Shift+D document.addEventListener('keydown', function(e) { if (e.altKey && e.shiftKey && e.key === 'D') { e.preventDefault(); enabled = !enabled; if (enabled) { applyDarkMode(); console.log('[Universal Dark Mode] Enabled'); } else { removeDarkMode(); console.log('[Universal Dark Mode] Disabled'); } } }); // Apply on load applyDarkMode(); // Re-apply on dynamic content var observer = new MutationObserver(function(mutations) { if (enabled && !document.getElementById('universal-dark-mode-style')) { applyDarkMode(); } }); observer.observe(document.head, { childList: true }); console.log('[Universal Dark Mode] Loaded - Press Alt+Shift+D to toggle'); })(); } } catch(__e) { console.warn('[Userscript:Universal Dark Mode]', __e); } })(); })();
Skip to content

Repository files navigation

klib Header

Flake8 & PyTestLanguageLast CommitQuality Gate StatusScrutinizercodecov

klib is a Python library for importing, cleaning, analyzing and preprocessing data. Explanations on key functionalities can be found on Medium / TowardsDataScience and in the examples section. Additionally, there are great introductions and overviews of the functionality on PythonBytes or on YouTube (Data Professor).

Installation

Use the package manager pip to install klib.

PyPI VersionDownloads

pip install -U klib

Alternatively, to install this package with conda run:

Conda VersionConda Downloads

conda install -c conda-forge klib

Usage

importklibimportpandasaspddf=pd.DataFrame(data)
# klib.describe - functions for visualizing datasets-klib.cat_plot(df) # returns a visualization of the number and frequency of categorical features-klib.corr_mat(df) # returns a color-encoded correlation matrix-klib.corr_plot(df) # returns a color-encoded heatmap, ideal for correlations-klib.corr_interactive_plot(df, split="neg").show() # returns an interactive correlation plot using plotly-klib.dist_plot(df) # returns a distribution plot for every numeric feature-klib.missingval_plot(df) # returns a figure containing information about missing values# klib.clean - functions for cleaning datasets-klib.data_cleaning(df) # performs datacleaning (drop duplicates & empty rows/cols, adjust dtypes,...)-klib.clean_column_names(df) # cleans and standardizes column names, also called inside data_cleaning()-klib.convert_datatypes(df) # converts existing to more efficient dtypes, also called inside data_cleaning()-klib.drop_missing(df) # drops missing values, also called in data_cleaning()-klib.mv_col_handling(df) # drops features with high ratio of missing vals based on informational content-klib.pool_duplicate_subsets(df) # pools subset of cols based on duplicates with min. loss of information

Examples

Find all available examples as well as applications of the functions in klib.clean() with detailed descriptions here.

klib.missingval_plot(df) # default representation of missing values in a DataFrame, plenty of settings are available

Missingvalue Plot Example

klib.corr_plot(df, split='pos') # displaying only positive correlations, other settings include threshold, cmap...klib.corr_plot(df, split='neg') # displaying only negative correlations

Corr Plot Example

klib.corr_plot(df, target='wine') # default representation of correlations with the feature column

Target Corr Plot Example

klib.corr_interactive_plot(df, split="neg").show()
# The interactive plot has the same parameters as the corr_plot, but with additional Plotly heatmap graph object kwargs.klib.corr_interactive_plot(df, split="neg", zmax=0)

Interactive Corr Plot Simple Example

Interactive Corr Plot with zmax kwarg Example

#Since corr_interactive_plot returns a Graph Object Figure, it supports the update_layout chain method.klib.corr_interactive_plot(wine, split="neg").update_layout(template="simple_white")

Interactive Corr Plot Chained Example

klib.dist_plot(df) # default representation of a distribution plot, other settings include fill_range, histogram, ...

Dist Plot Example

klib.cat_plot(data, top=4, bottom=4) # representation of the 4 most & least common values in each categorical column

Cat Plot Example

Further examples, as well as applications of the functions in klib.clean() can be found here.

Contributing

Open in Visual Studio Code

Pull requests and ideas, especially for further functions are welcome. For major changes or feedback, please open an issue first to discuss what you would like to change.

License

MIT

About

Easy to use Python library of customized functions for cleaning and analyzing data.

Topics

Resources

Code of conduct

Stars

523 stars

Watchers

3 watching

Forks

Releases

Sponsor this project

Used by

Contributors

Languages