
Monitor your hapi application's memory footprint.
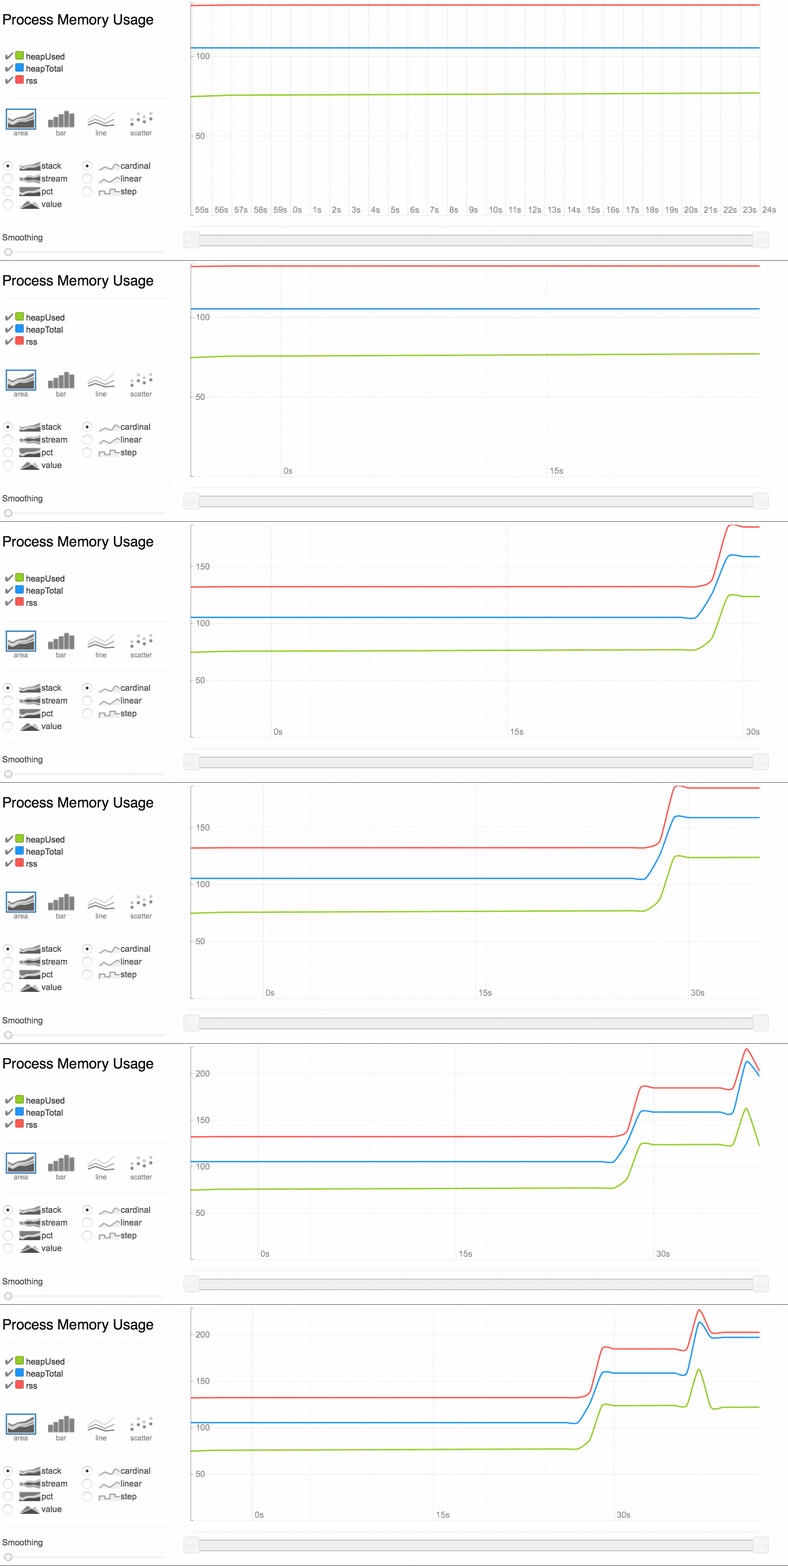
Inspired by PubNub-Rickshaw-Memory, this plugin displays a realtime graph of your NodeJS memory profile over time. It uses socket.io for pushing data to the browser and Shutterstock's Rickshaw library for graphing.
- Add the memshaw plugin to your hapi installation, here I am using a manifest file with the glue plugin:
{
...
registrations: [{plugin: {register: 'memshaw'}},
...
]}
Visit your application in the browser using the
/memshawpath i.e.localhost:3000/memshawGet your app to chew on some memory! For example you could have a terrible route that you
curl http://localhost:3000/stresslike this:
server.route({method: 'GET',path: '/stress',handler: (request,reply)=>{conststupidBigArray=[];fs.createReadStream('/path/to/big/file','utf8').on('data',(chunk)=>{console.log('got %d bytes of data',chunk.length);stupidBigArray.push(chunk);});reply('Why are you pushing all these chunks to an array?');},});const hapi = require('hapi');
const memshaw = require('memshaw/hapi-17');
(async function() {
const server = hapi.server({port: 3000});
await server.register([
memshaw,
]);
await server.start();
})();