


Python module for ggseg-like visualizations.
Requires matplotlib>=3.4 and numpy>=1.21.
pip install ggseg
In order to work with python-ggseg, the data should be prepared as a
dictionary where each item is one region of a given atlas assigned with some
numeric value. The current version includes three atlases: the
Desikan-Killiany (DK) atlas
, the Johns Hopkins University (JHU) white-matter atlas and the FreeSurfer aseg atlas.
Cortical ROI data such as using the DK atlas may be structured as follows:
{'bankssts_left': 1.1,
'caudalanteriorcingulate_left': 1.0,
'caudalmiddlefrontal_left': 2.6,
'cuneus_left': 2.6,
'entorhinal_left': 0.6,
...}
Then be passed to the ggseg.plot_dk function:
importggsegggseg.plot_dk(data, cmap='Spectral', figsize=(15,15),
background='k', edgecolor='w', bordercolor='gray',
ylabel='Cortical thickness (mm)', title='Title of the figure')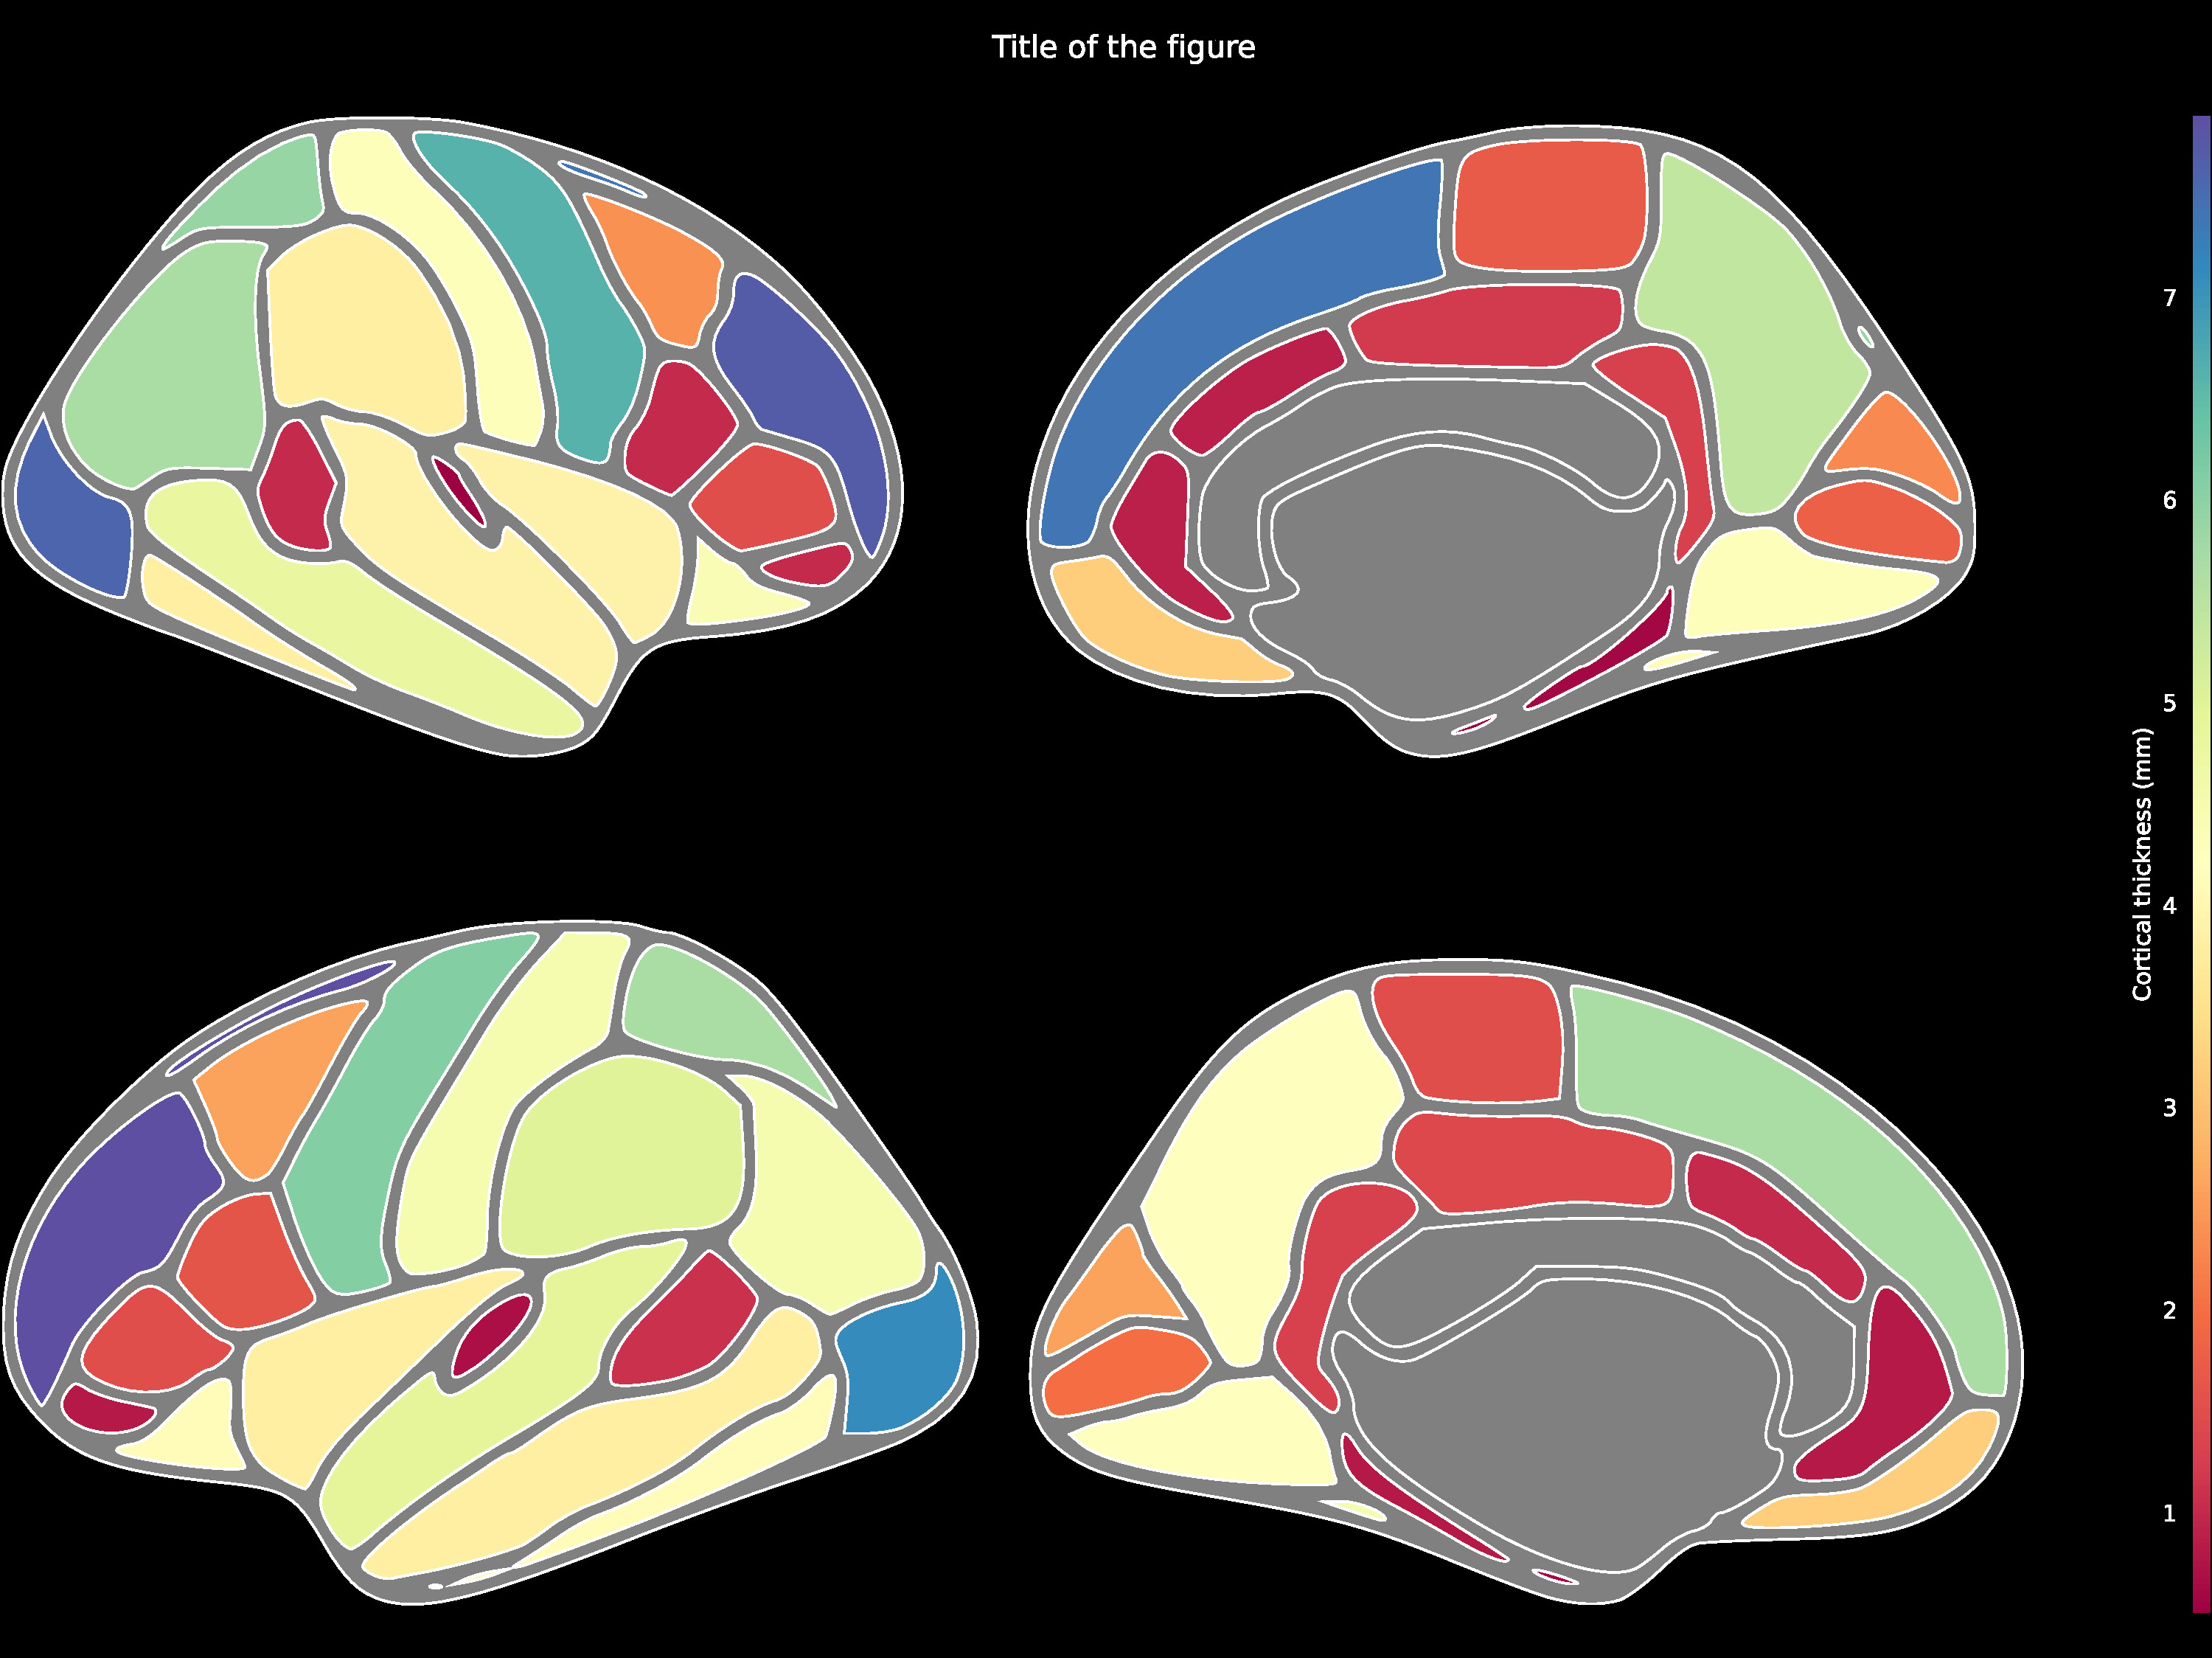
The comprehensive list of applicable regions can be found in this folder.
data= {'Left-Lateral-Ventricle': 12289.6,
'Left-Thalamus': 8158.3,
'Left-Caudate': 3463.3,
'Left-Putamen': 4265.3,
'Left-Pallidum': 1620.9,
'3rd-Ventricle': 1635.6,
'4th-Ventricle': 1115.6,
...}ggseg.plot_aseg(data, cmap='Spectral',
background='k', edgecolor='w', bordercolor='gray',
ylabel='Volume (mm3)', title='Title of the figure')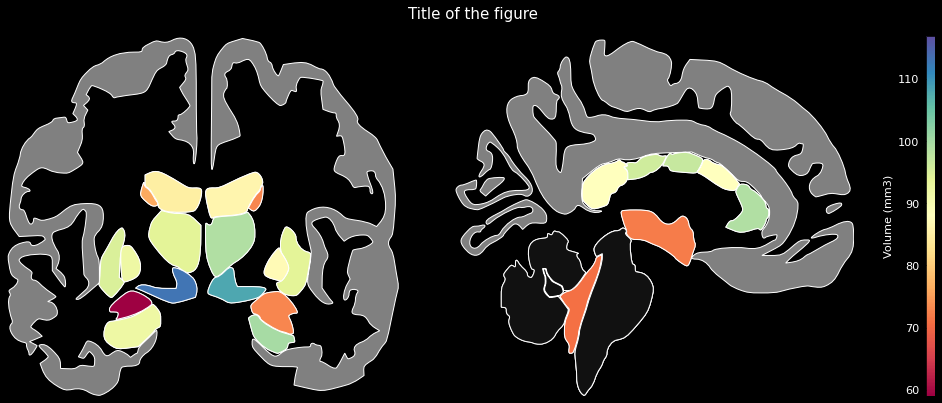
The comprehensive list of applicable regions can be found in this folder.
data= {'Anterior thalamic radiation L': 0.3004812598228455,
'Anterior thalamic radiation R': 0.2909256815910339,
'Corticospinal tract L': 0.3517134189605713,
'Corticospinal tract R': 0.3606771230697632,
'Cingulum (cingulate gyrus) L': 0.3149917721748352,
'Cingulum (cingulate gyrus) R': 0.3126821517944336,
...}ggseg.plot_jhu(data, background='k', edgecolor='w', cmap='Spectral',
bordercolor='gray', ylabel='Mean Fractional Anisotropy',
title='Title of the figure')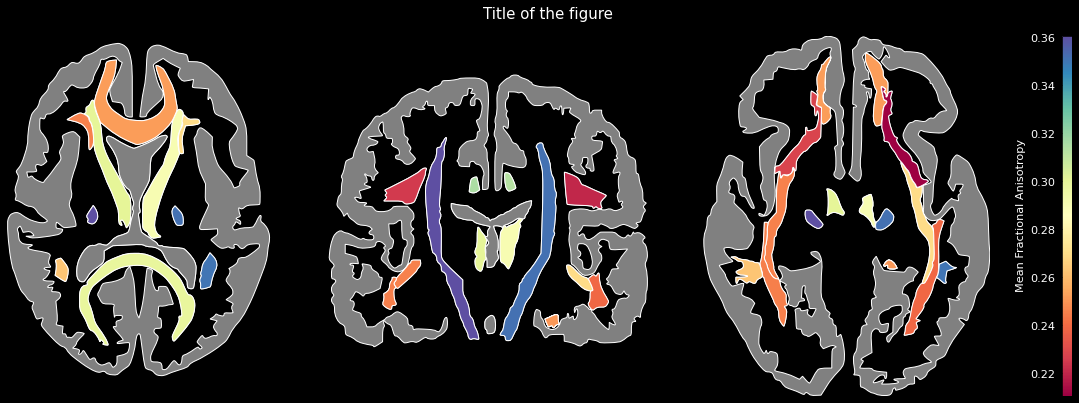
The comprehensive list of applicable regions can be found in this folder.
The current development version of python-ggseg has a coverage rate close to 100%.
The corresponding tests can be found in this folder.
A Jupyter Notebook with examples can be found there.