This is a simple demo of running a shell utility from within R and using the output from the traceroute (tracert) utility to plot a route on a map.
Unless otherwise noted, everything here is Copyright (c) Brian High (2015) and licensed under the GPLv3. See the LICENSE file.
The traceroute utility used will be "tracert" on a Windows system and "traceroute" otherwise (Mac, Linux, Unix, etc.).
Since the traceroute system utility does not produce geographical location information, we will use the freegeoip service for this purpose.
Mapping can be done with leaflet, ggmap or maps, depending on the configuration of variables early in the R script.
Example data are provided in text files and map output examples are provided as PNG image files.
For reference, this is example output from tracert on a Windows system:
C:\Users\nobody>tracert -d -h 30 www.cubagob.cu
Tracing route to vhunix.ceniai.inf.cu [169.158.128.86]
over a maximum of 30 hops:
1 <1 ms <1 ms <1 ms 128.95.21.102 2 <1 ms <1 ms <1 ms 10.132.1.65 3 1 ms <1 ms <1 ms 10.132.1.66 4 1 ms <1 ms <1 ms 10.132.0.49 5 1 ms 1 ms 1 ms 205.175.118.2 6 2 ms 1 ms 1 ms 209.124.188.132 7 2 ms 1 ms 1 ms 198.104.202.6 8 2 ms 1 ms 2 ms 198.104.202.5 9 2 ms 1 ms 1 ms 64.86.123.41 10 2 ms 2 ms 2 ms 64.86.124.25 11 71 ms 70 ms 71 ms 64.86.124.30 12 70 ms 70 ms 71 ms 66.198.96.45 13 261 ms 262 ms 262 ms 66.198.96.34 14 215 ms 210 ms 215 ms 200.0.16.85 15 210 ms * 210 ms 200.0.16.196 16 230 ms 220 ms 212 ms 200.0.16.182 17 213 ms 233 ms 234 ms 169.158.128.54 18 * * * Request timed out.
19 * * * Request timed out.
20 * * * Request timed out.
21 * * * Request timed out.
22 * * * Request timed out.
23 * * * Request timed out.
24 * * * Request timed out.
25 * * * Request timed out.
26 * * * Request timed out.
27 * * * Request timed out.
28 * * * Request timed out.
29 * * * Request timed out.
30 * * * Request timed out.
Trace complete.
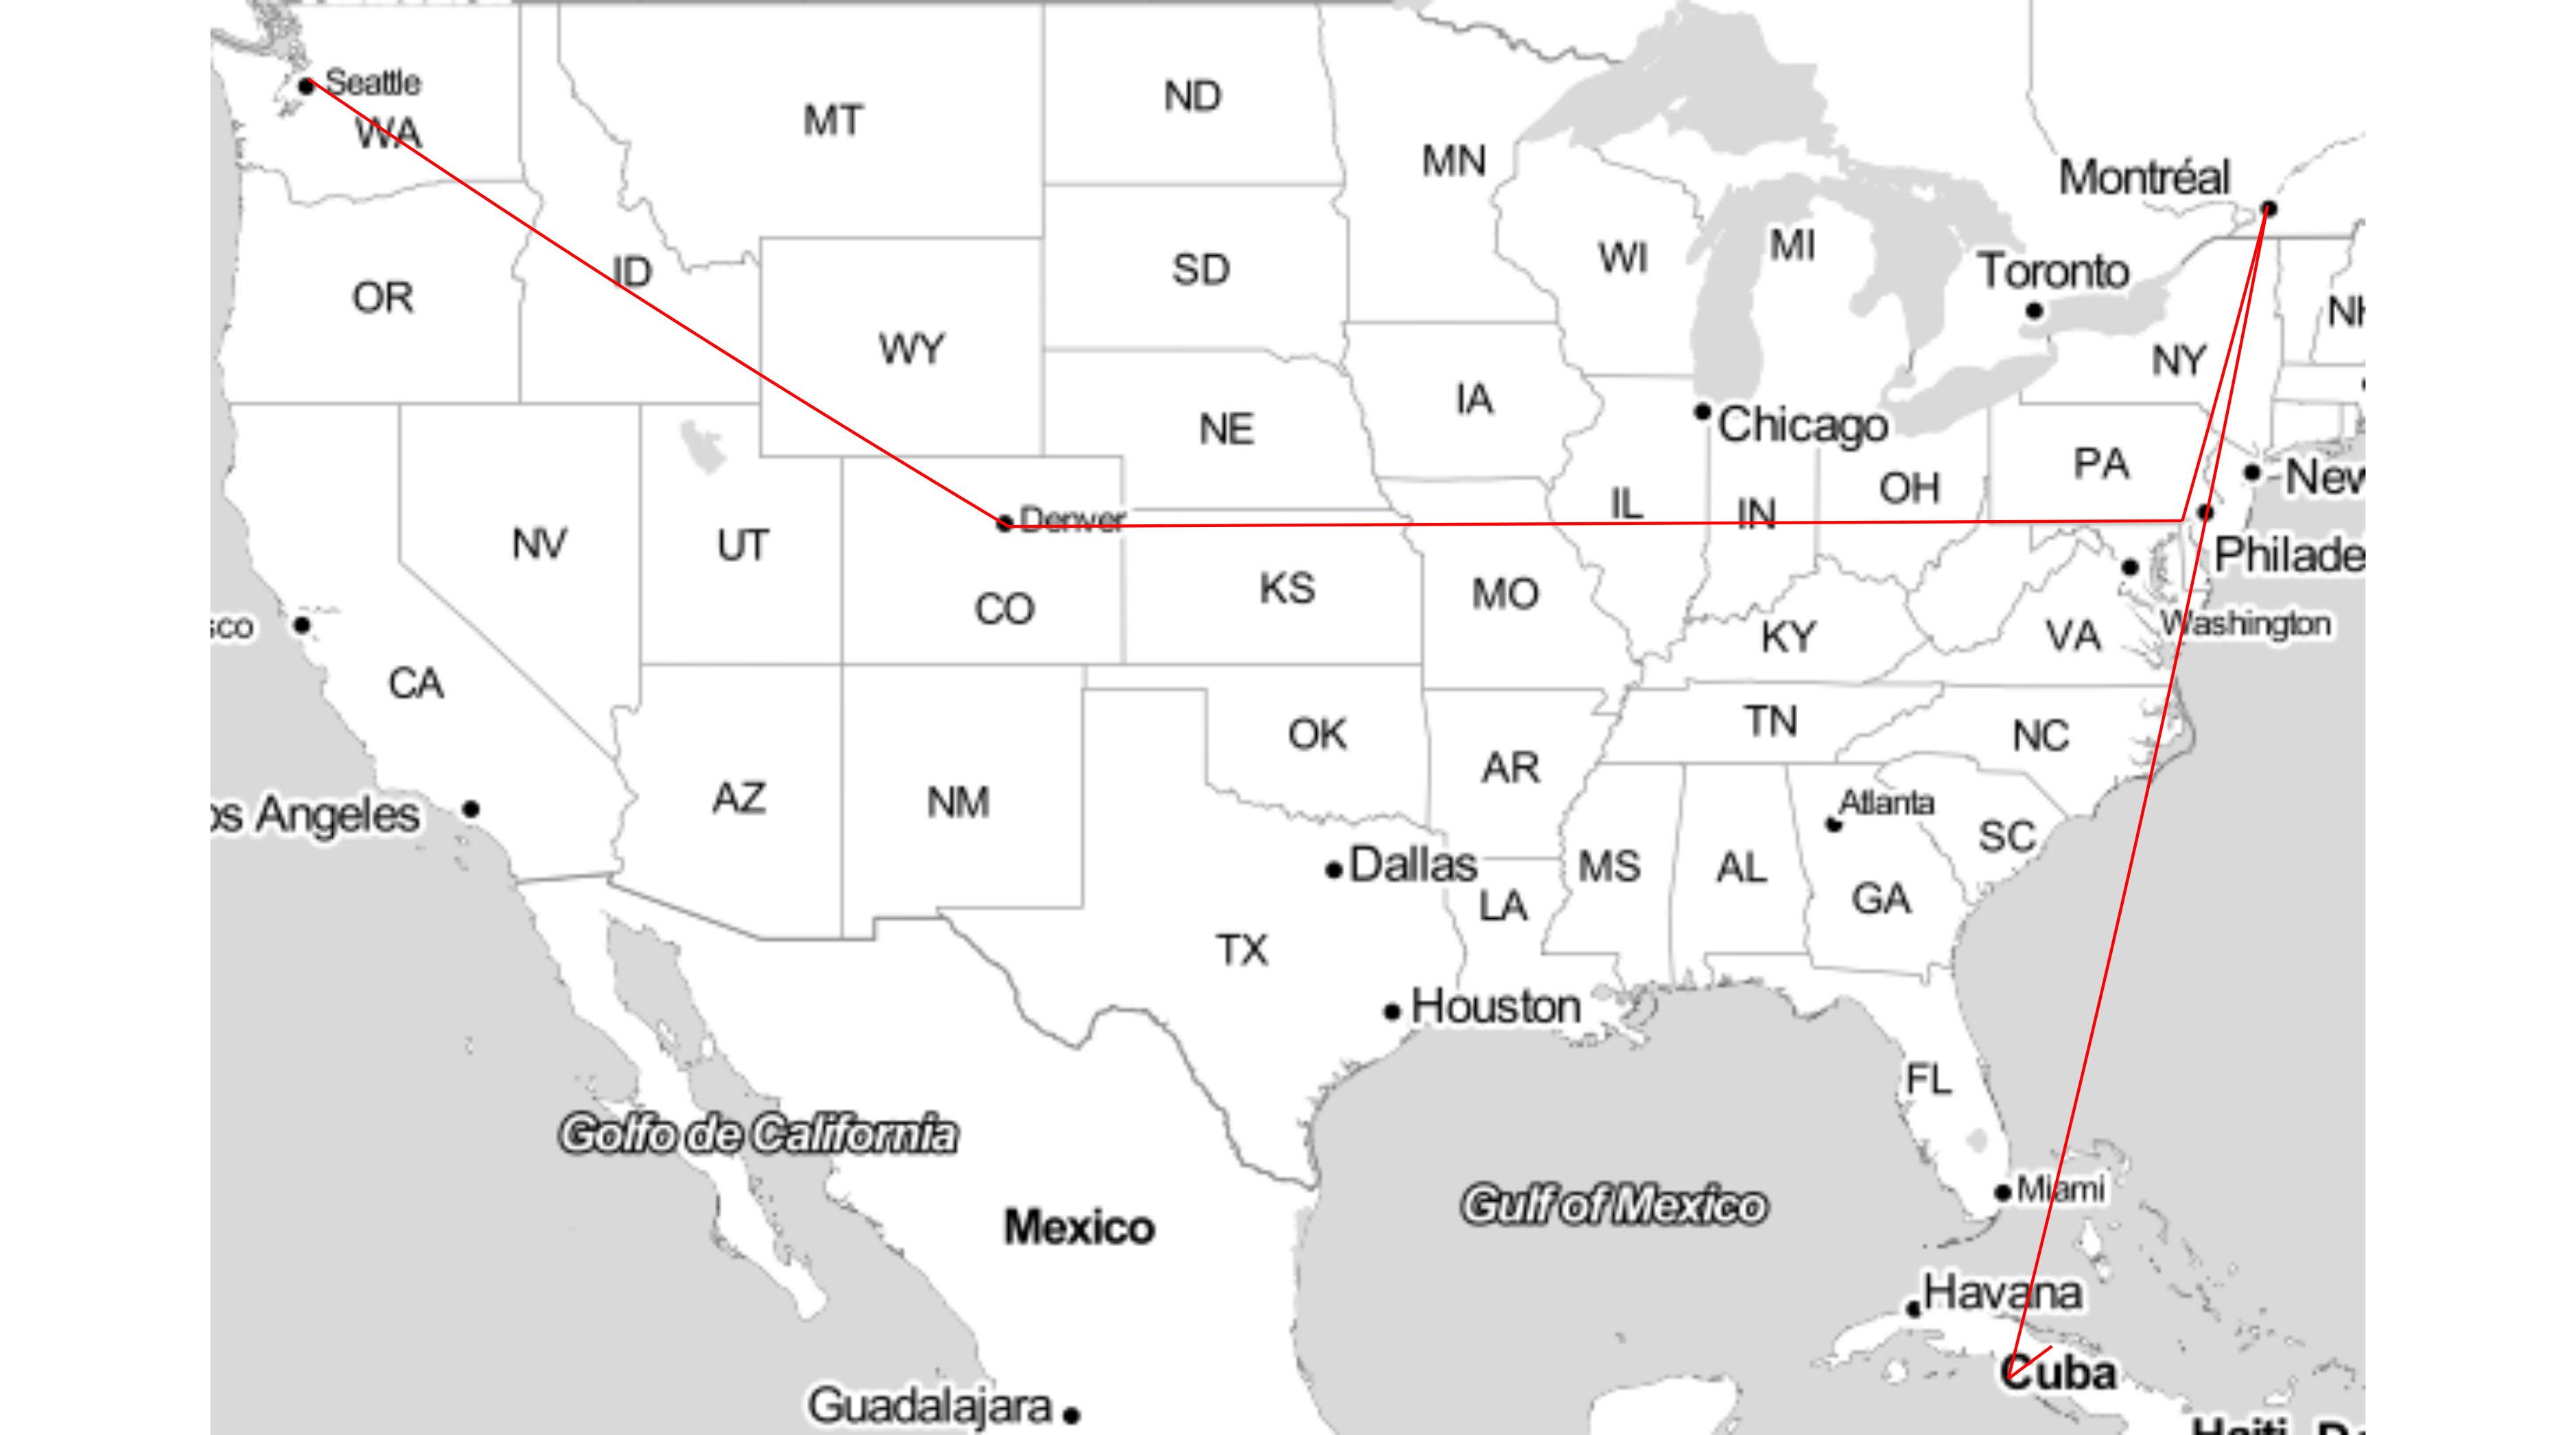
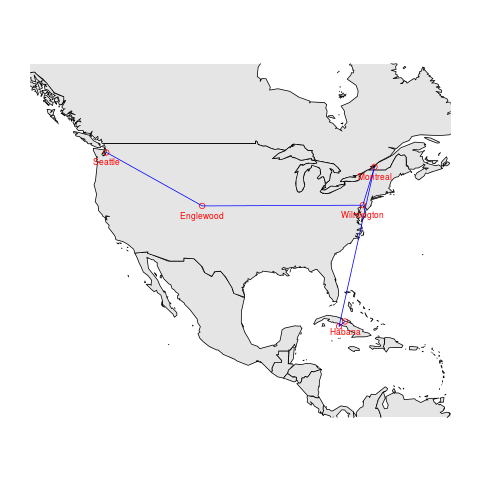
Here are the resulting plots:
Compare to: http://www.yougetsignal.com/tools/visual-tracert/ ... with the button "Proxy Trace" pressed after you enter the domain as "Remote Address".