Skip to content
View ced4568's full-sized avatar
😁
I break things on purpose, so production doesn't have to.
😁
I break things on purpose, so production doesn't have to.

Block or report ced4568

Block user

Prevent this user from interacting with your repositories and sending you notifications. Learn more about blocking users.

You must be logged in to block users.

Maximum 250 characters. Please don’t include any personal information such as legal names or email addresses. Markdown is supported. This note will only be visible to you.
Report abuse

Contact GitHub support about this user’s behavior. Learn more about reporting abuse.

Report abuse
ced4568/README.md

Hi, I'm Chase

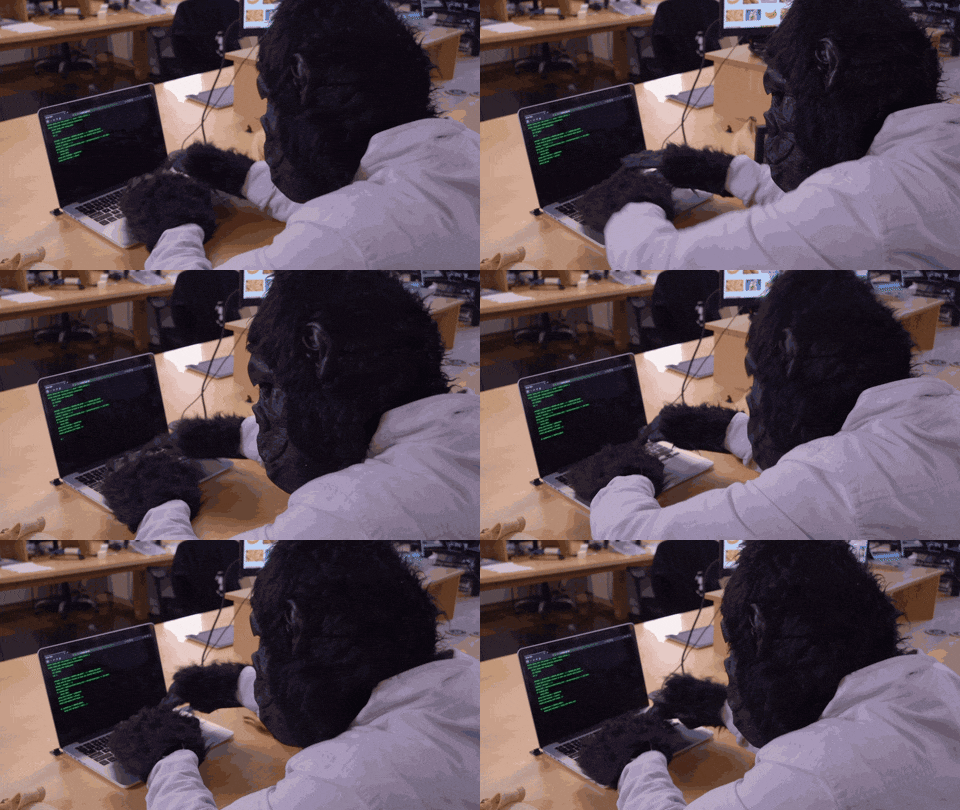
Coding Gorilla

Typing SVG

I build real world systems that combine data, automation, and infrastructure. From industrial data pipelines at GE Aerospace to an 18 node production homelab with 28 live services everything ships to solve real problems.


LinkedInPortfolioEmailTwitterLive NOC


// currently

  • Running a live 18 node production environment 6 node Proxmox VE cluster and 12 node K3s on Raspberry Pi with 28 services online
  • Building industrial data pipelines and dashboards at GE Aerospace
  • Studying Kubernetes production patterns via KubeCraft
  • Operating dual-node APRS iGate system (KJ5JCO) RF to internet
  • Ask me about K3s, Proxmox, Grafana, or industrial OT/IT integration

// stack

LanguagesPythonTypeScriptJavaScriptBashC++HTMLCSS

Infrastructure & ToolsProxmoxKubernetesDockerGrafanaPrometheusTrueNASCloudflareLinuxGitNginx

FrameworksReactNode.jsPostgreSQL


// featured projects

ProjectDescriptionStack
🖥️ Ced's HomeLab18-node production environment 6-node Proxmox VE cluster and 12 node K3s. Real infra, real problems. Live NOC at noc.chasedumphord.comProxmox, K3s, TrueNAS, Cloudflare
🤖 CedOps AI Infrastructure NOCAI Operations Platform 8 autonomous agents on Hetzner VPS, monitored by Prometheus via Tailscale, visualized in a live Grafana NOC dashboardn8n, OpenRouter, Prometheus, Grafana, Docker
📊 Ced's Observability StackProduction monitoring platform Prometheus, Grafana, Alertmanager across the full homelab stackPrometheus, Grafana, Alertmanager
📡 Ced's APRS iGateDual node RF to internet gateway. Bridges amateur radio into IP infrastructure. KJ5JCORaspberry Pi, Direwolf, Linux
☸️ Ced's K3s HomeLab12 node Raspberry Pi K3s cluster HA control plane, role-based workers, 117+ days uptimeK3s, MetalLB, Prometheus
🌐 Ced's PortfolioPersonal portfolio and live NOC dashboard DevOps and Cloud Infrastructure Engineer. 18 nodes, 28 services, always runningHTML, JavaScript, Cloudflare

Built with intention. Deployed with purpose.

Pinned Loading

  1. ceds-homelabceds-homelabPublic

    Production style homelab 6 node Proxmox cluster, 12 node K3s on Raspberry Pi, live NOC dashboard with Prometheus + Grafana

    HTML 2

  2. ced-portfolioced-portfolioPublic

    Personal portfolio and live NOC dashboard DevOps and Cloud Infrastructure Engineer. 18 nodes, 28 services, always running.

    HTML 1

  3. ceds-observability-stackceds-observability-stackPublic

    Production monitoring platform with Prometheus, Grafana, Alertmanager, and 8 exporters across a hybrid Proxmox + K3s homelab.

    Python 2

  4. ced-k3s-homelabced-k3s-homelabPublic

    12 node Raspberry Pi K3s cluster HA control plane, role based workers, Prometheus monitoring. 117+ days uptime.

    Shell 1

  5. ceds-aprs-igateceds-aprs-igatePublic

    Dual-node APRS iGate system made with a Raspberry Pi + Direwolf + network failover. RF to internet gateway bridging amateur radio into HomeLab infrastructure. KJ5JCO

    Shell 2

  6. cedops-ai-infrastructure-noccedops-ai-infrastructure-nocPublic

    AI Operations Platform with 8 autonomous agents on Hetzner VPS, monitored by Prometheus (Proxmox) via Tailscale, visualized in a live Grafana NOC dashboard.

    2
