



This crate implements functions for generating plots and drawings in Rust. It uses Python/Matplotlib but is designed specifically for Rust developers, combining the convenience of a Rust-native API with the exceptional quality of Matplotlib 😀.
Plotpy is more verbose than native Matplotlib because the aim here is to take advantage of the intelligence of the IDE (e.g., VS Code) to auto-complete the code while developing in Rust.
Plotpy generates Python code in a temporary directory (e.g., /tmp/plotpy). It then runs the code via Python 3 using Rust's std::process::Command. The result is an image file such as SVG.
For more information (and examples), check out the plotpy documentation on docs.rs.
See also the examples directory with the output of the integration tests.
This code is mainly tested on Arch Linux and Debian/Ubuntu Linux.
This crate needs Python3 and Matplotlib.
Install the dependencies:
pacman -Syu --noconfirm python-matplotlibInstall the dependencies:
sudo apt install python3-matplotlibIt is possible to run plotpy in other systems where Python and Matplotlib are already installed. The Rust code calls python3 via std::process::Command. However, there is an option to call a different python executable; for instance (the code below is untested):
let mut plot = Plot::new();
plot.set_python_exe("C:\Windows11\WhereIs\python.exe")
.add(...)
.save(...)?;

👆 Check the crate version and update your Cargo.toml accordingly:
[dependencies]
plotpy = "*"Plotpy can be used with Jupyter via evcxr. Thus, it can interactively display the plots in a Jupyter Notebook. This feature requires the installation of evcxr. See the Jupyter/evcxr article.
The following code shows a minimal example (the code below is untested)
// set the python path
let python = "where-is-my/python";
// set the figure path and name to be saved
let path = "my-figure.svg";
// plot and show in a Jupyter notebook
let mut plot = Plot::new();
plot.set_python_exe(python)
.set_label_x("x")
.set_label_y("y")
.show_in_jupyter(path)?;
Note, below StrError is defined as pub type StrError = &'static str; — a type alias for a static string slice. It's used throughout the library as the error type returned from functions. It's essentially a lightweight, allocation-free error type that avoids pulling in a full error-handling crate.
use plotpy::{Barplot,Plot,StrError};fnmain() -> Result<(),StrError>{// datalet fruits = ["Apple","Banana","Orange"];let prices = [10.0,20.0,30.0];let errors = [3.0,2.0,1.0];// barplot object and optionsletmut bar = Barplot::new();
bar.set_errors(&errors).set_horizontal(true).set_with_text("edge").draw_with_str(&fruits,&prices);// save figureletmut plot = Plot::new();
plot.set_inv_y().add(&bar).set_title("Fruits").set_label_x("price");// plot.save("/tmp/plotpy/doc_tests/doc_barplot_3.svg")?;Ok(())}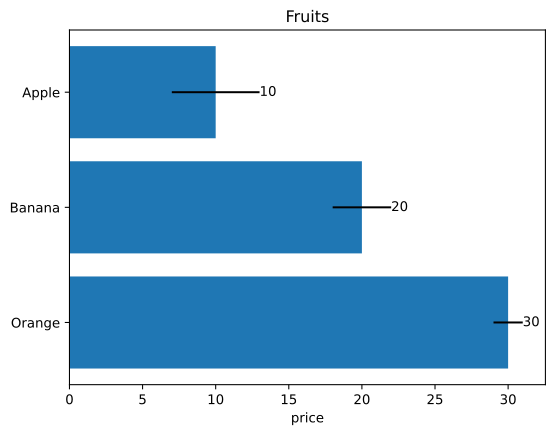
use plotpy::{Boxplot,Plot,StrError};fnmain() -> Result<(),StrError>{// data (as a nested list)let data = vec![
vec![1,2,3,4,5],// A
vec![2,3,4,5,6,7,8,9,10],// B
vec![3,4,5,6],// C
vec![4,5,6,7,8,9,10],// D
vec![5,6,7],// E];// x ticks and labelslet n = data.len();let ticks:Vec<_> = (1..(n + 1)).into_iter().collect();let labels = ["A","B","C","D","E"];// boxplot object and optionsletmut boxes = Boxplot::new();
boxes.draw(&data);// save figureletmut plot = Plot::new();
plot.add(&boxes).set_title("boxplot documentation test").set_ticks_x_labels(&ticks,&labels);// plot.save("/tmp/plotpy/doc_tests/doc_boxplot_2.svg")?;Ok(())}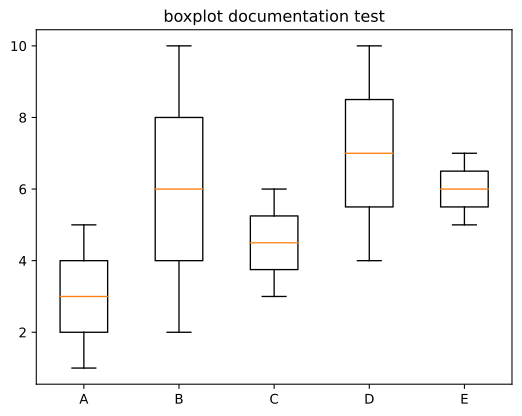
use plotpy::{Canvas,Plot,PolyCode,StrError};fnmain() -> Result<(),StrError>{// codeslet data = [(3.0,0.0,PolyCode::MoveTo),(1.0,1.5,PolyCode::Curve4),(0.0,4.0,PolyCode::Curve4),(2.5,3.9,PolyCode::Curve4),(3.0,3.8,PolyCode::LineTo),(3.5,3.9,PolyCode::LineTo),(6.0,4.0,PolyCode::Curve4),(5.0,1.5,PolyCode::Curve4),(3.0,0.0,PolyCode::Curve4),];// polycurveletmut canvas = Canvas::new();
canvas.set_face_color("#f88989").set_edge_color("red");
canvas.polycurve_begin();for(x, y, code)in data {
canvas.polycurve_add(x, y, code);}
canvas.polycurve_end(true);// add canvas to plotletmut plot = Plot::new();
plot.add(&canvas);// save figure
plot.set_range(1.0,5.0,0.0,4.0).set_frame_borders(false).set_hide_axes(true).set_equal_axes(true).set_show_errors(true);// plot.save("/tmp/plotpy/doc_tests/doc_canvas_polycurve.svg")?;Ok(())}
use plotpy::{generate3d,Contour,Plot,StrError};fnmain() -> Result<(),StrError>{// generate (x,y,z) matriceslet n = 21;let(x, y, z) = generate3d(-2.0,2.0, -2.0,2.0, n, n, |x, y| x * x - y * y);// configure contourletmut contour = Contour::new();
contour
.set_colorbar_label("temperature").set_colormap_name("terrain").set_selected_level(0.0,true);// draw contour
contour.draw(&x,&y,&z);// add contour to plotletmut plot = Plot::new();
plot.add(&contour).set_labels("x","y");// plot.save("/tmp/plotpy/readme_contour.svg")?;Ok(())}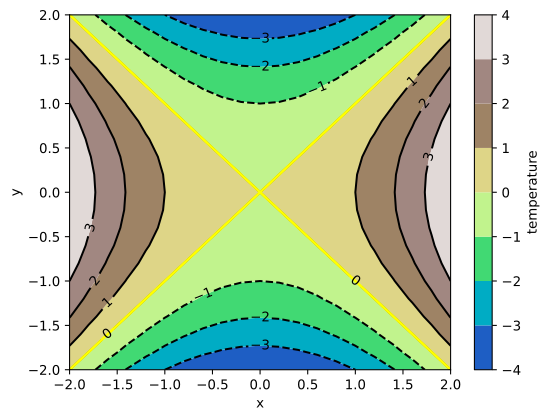
use plotpy::{linspace,Curve,Plot,StrError};fnmain() -> Result<(),StrError>{// generate (x,y) pointslet x = linspace(-1.0,1.0,21);let y:Vec<_> = x.iter().map(|v| 1.0 / (1.0 + f64::exp(-5.0**v))).collect();// configure curveletmut curve = Curve::new();
curve
.set_label("logistic function").set_line_alpha(0.8).set_line_color("#5f9cd8").set_line_style("-").set_line_width(5.0).set_marker_color("#eeea83").set_marker_every(5).set_marker_line_color("#da98d1").set_marker_line_width(2.5).set_marker_size(20.0).set_marker_style("*");// draw curve
curve.draw(&x,&y);// add curve to plotletmut plot = Plot::new();
plot.add(&curve).set_num_ticks_y(11).grid_labels_legend("x","y");// plot.save("/tmp/plotpy/doc_tests/doc_curve.svg")?;Ok(())}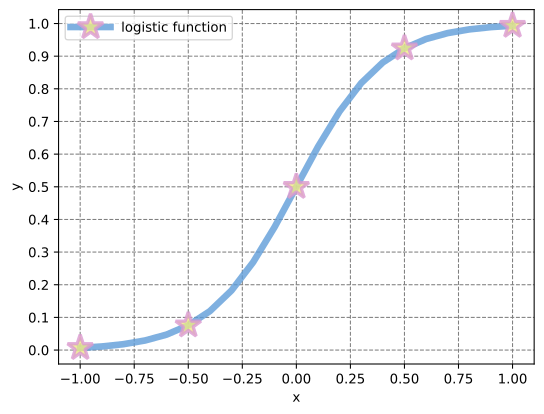
use plotpy::{Histogram,Plot,StrError};fnmain() -> Result<(),StrError>{// set valueslet values = vec![
vec![1,1,1,2,2,2,2,2,3,3,4,5,6],// first series
vec![-1, -1,0,1,2,3],// second series
vec![5,6,7,8],// third series];// set labelslet labels = ["first","second","third"];// configure and draw histogramletmut histogram = Histogram::new();
histogram.set_colors(&["#9de19a","#e7eca3","#98a7f2"]).set_line_width(10.0).set_stacked(true).set_style("step");
histogram.draw(&values,&labels);// add histogram to plotletmut plot = Plot::new();
plot.add(&histogram).set_frame_border(true,false,true,false).grid_labels_legend("values","count");// plot.save("/tmp/plotpy/doc_tests/doc_histogram.svg")?;Ok(())}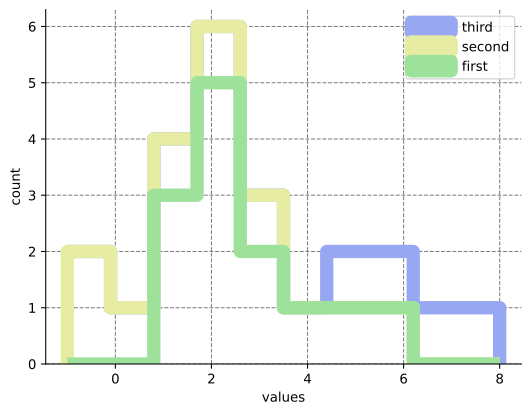
use plotpy::{Image,Plot,StrError};fnmain() -> Result<(),StrError>{// set valueslet data = [[0.8,2.4,2.5,3.9,0.0,4.0,0.0],[2.4,0.0,4.0,1.0,2.7,0.0,0.0],[1.1,2.4,0.8,4.3,1.9,4.4,0.0],[0.6,0.0,0.3,0.0,3.1,0.0,0.0],[0.7,1.7,0.6,2.6,2.2,6.2,0.0],[1.3,1.2,0.0,0.0,0.0,3.2,5.1],[0.1,2.0,0.0,1.4,0.0,1.9,6.3],];// image plot and optionsletmut img = Image::new();
img.set_colormap_name("hsv").draw(&data);// save figureletmut plot = Plot::new();
plot.add(&img);// plot.save("/tmp/plotpy/doc_tests/doc_image_1.svg")?;Ok(())}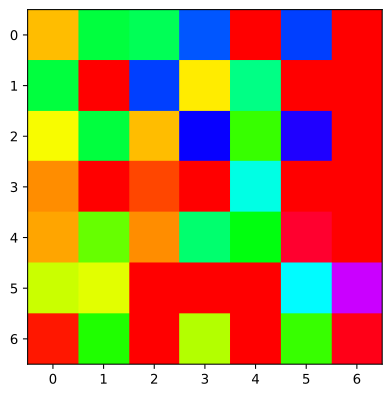
use plotpy::{Curve,InsetAxes,Plot,StrError};fnmain() -> Result<(),StrError>{// draw curveletmut curve = Curve::new();
curve.draw(&[0.0,1.0,2.0],&[0.0,1.0,4.0]);// allocate inset and add curve to itletmut inset = InsetAxes::new();
inset
.add(&curve)// add curve to inset.set_range(0.5,1.5,0.5,1.5)// set the range of the inset.draw(0.5,0.5,0.4,0.3);// add curve and inset to plotletmut plot = Plot::new();
plot.add(&curve).set_range(0.0,5.0,0.0,5.0).add(&inset);// IMPORTANT: add inset after setting the range// plot.save("/tmp/plotpy/doc_tests/doc_inset_axes_add.svg")?;Ok(())}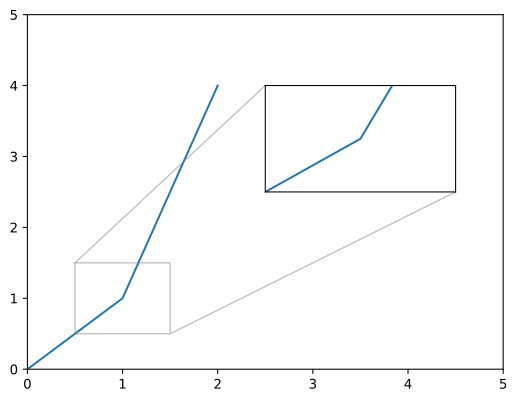
use plotpy::{Plot,StrError,Surface};fnmain() -> Result<(),StrError>{// starlet r = &[1.0,1.0,1.0];let c = &[-1.0, -1.0, -1.0];let k = &[0.5,0.5,0.5];letmut star = Surface::new();
star.set_colormap_name("jet").draw_superquadric(c, r, k, -180.0,180.0, -90.0,90.0,40,20)?;// pyramidslet c = &[1.0, -1.0, -1.0];let k = &[1.0,1.0,1.0];letmut pyramids = Surface::new();
pyramids
.set_colormap_name("inferno").draw_superquadric(c, r, k, -180.0,180.0, -90.0,90.0,40,20)?;// rounded cubelet c = &[-1.0,1.0,1.0];let k = &[4.0,4.0,4.0];letmut cube = Surface::new();
cube.set_surf_color("#ee29f2").draw_superquadric(c, r, k, -180.0,180.0, -90.0,90.0,40,20)?;// spherelet c = &[0.0,0.0,0.0];let k = &[2.0,2.0,2.0];letmut sphere = Surface::new();
sphere
.set_colormap_name("rainbow").draw_superquadric(c, r, k, -180.0,180.0, -90.0,90.0,40,20)?;// sphere (direct)letmut sphere_direct = Surface::new();
sphere_direct.draw_sphere(&[1.0,1.0,1.0],1.0,40,20)?;// add features to plotletmut plot = Plot::new();
plot.add(&star).add(&pyramids).add(&cube).add(&sphere).add(&sphere_direct);// save figure
plot.set_equal_axes(true).set_figure_size_points(600.0,600.0);// plot.save("/tmp/plotpy/readme_superquadric.svg")?;Ok(())}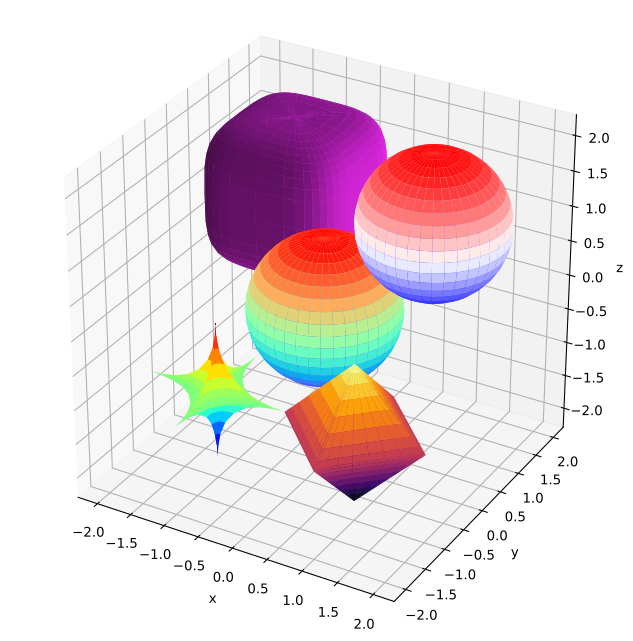
use plotpy::{Plot,Text,StrError};use std::path::Path;fnmain() -> Result<(),StrError>{// configure textletmut text = Text::new();
text.set_color("purple").set_align_horizontal("center").set_align_vertical("center").set_fontsize(30.0).set_bbox(true).set_bbox_facecolor("pink").set_bbox_edgecolor("black").set_bbox_alpha(0.3).set_bbox_style("roundtooth,pad=0.3,tooth_size=0.2");// draw text
text.draw_3d(0.5,0.5,0.5,"Hello World!");// add text to plotletmut plot = Plot::new();
plot.add(&text);// plot.save("/tmp/plotpy/doc_tests/doc_text.svg")?;Ok(())}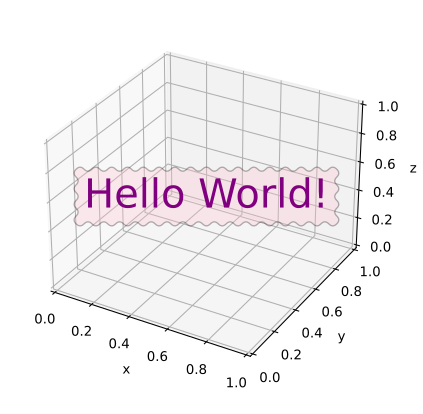
(Generated by DeepSeek)
Core idea: Generates Python 3 scripts as strings from Rust, then executes them via python3. Not a direct API wrapper — it's a code generator.
- 25 source files in
src/, each a standalone module - Each "graph entity" struct (
Curve,Barplot,Boxplot,Contour,Surface,Canvas,Histogram,Text, etc.) implementsGraphMakertrait (get_buffer()+clear_buffer()) Plotis the central coordinator — collects buffers viaadd(&entity), prepends a Python header, appendsplt.savefig(), writes.pyfile, executes it- Only one dependency:
num-traits = "0.2"(for genericNumbound) - Two data abstraction traits:
AsVector(for 1D data) andAsMatrix(for 2D data)
The entire library follows something.method1().method2().method3() pervasively.
Graph entities — setters return &mut Self:
curve.set_label("logistic")
.set_line_color("#5f9cd8")
.set_line_style("-")
.set_line_width(5.0);
curve.draw(&x, &y);
Note: draw() methods don't return &mut Self (they finalize by writing Python code). But points_begin()/points_add()/points_end() do chain.
Plot — everything returns &mut Self:
plot.set_subplot(2, 2, 1)
.set_title("first")
.add(&curve1)
.grid_labels_legend("x", "y")
.set_equal_axes(true);
new()→ defaults (empty strings,0.0sentinels)set_*()→ returns&mut Selfoptions()→ private method builds CSV-style parameter stringdraw()→ writes Python tobufferusingwrite!macro (all.unwrap()sinceStringwrites are infallible)GraphMakerimpl → exposes the buffer- Inline
#[cfg(test)] mod testsin every file + integration tests undertests/ max_width = 120inrustfmt.toml- Error type:
pub type StrError = &'static str;