
First of all, thanks a lot for wesnolte's great work:blush: -- jOrgChart. The thought that using nested tables to build out the tree-like organization chart is amazing. This idea is more simple and direct than its counterparts based on svg Unfortunately, it's long time not to see the update of jOrgChart. on the other hand, I got some interesting ideas to add, so I choose to create a new repo.
- Since version 3.0, we use nested ul to construct tree-like chart instead of nested table.
- Since version 4.0, users build up the ajax datasoure by themselves.
- Since version 5.0, users are allowed to build up the family tree.
- Since version 6.0, The orgchart component has been reverted to native implementation and no longer relies on jQuery.
- Supports both local data and remote data (JSON).
- Smooth expand/collapse effects based on CSS3 transitions.
- Align the chart in 4 orientations.
- Allows user to change orgchart structure by drag/drop nodes.
- Allows user to edit orgchart dynamically and save the final hierarchy as a JSON object.
- Supports exporting chart as a picture or pdf document.
- Supports pan and zoom.
- Allows user to customize the internal structure for every node.
- Users can adopt multiple solutions to build up a huge organization chart(please refer hybrid layout sections).
- touch-enabled plugin for mobile device.
Users could find the related CDN support for OrgChart's CSS and JavaScript.

Of course, you can directly use the standalone build by including dist/js/orgchart.js and dist/css/orgchart.css in your webapps.
# From version 1.0.2 on, users can install orgchart and add it to bower.json dependencies
$ bower install orgchart
# From version 1.0.4 on, users can install orgchart with npm
$ npm install orgchart
In CommonJS environments, require('orgchart') exports the OrgChart constructor directly.
FYI, How to use jQuery Orchart in React
Demos based on nested table (obsolete)
using ul datasource(this feature comes from Tobyee's good idea 😊)
I wanna align orgchart with different orientation**(this feature comes from the good idea of fvlima and badulesia 😊)
Top to Bottom -- default direction, as you can see all other examples on this page.
I wanna show/hide left/right sibling nodes respectively by clicking left/right arrow

Note: users use should set the relationship property of datasource by themselves. All of these staff are used to generate the correct expanding/collapsing arrows for nodes.
Here, we need the help from html2canvas.
Note:
(1) if you wanna export something in IE or Edge, please introduce es6-promise.auto.js firstly.
(2) if your OS is windows, please check your display scaling settings. For the perfact exported picture, you'd better adjust "Change the size of text, apps, and other items" to 100%.(thanks for sayamkrai's exploration)
(3) Besides, if you wanna export a pdf format or your orgchart includes picture, you have to introduce jspdf and set "exportFileextension" option to "pdf".
You need to set crossorigin to anonymous for your img tags.
Here, we fall back on OpenLayers. It's the most aewsome open-source js library for Web GIS you sholdn't miss.
With the help of exposed core methods(addParent(), addSiblings(), addChildren(), removeNodes()) of orgchart plugin, we can finish this task easily.
Users are allowed to drag & drop the nodes of orgchart when option "draggable" is assigned to true(Note: this feature doesn't work on IE due to its poor support for HTML5 drag & drop API).
Furthermore, users can make use of option dropCriteria to inject their custom limitations on drag & drop. As shown below, we don't want an manager employee to be under a engineer under no circumstance.
That's where getHierarchy() comes in.
It's a so easy task, we just need to append id or className property to node data.
This feature is inspired by the issues(Aligning Children Vertical, Hybrid(horizontal + vertical) OrgChart). Thank mfahadi and Destructrix for their constructive suggestions:blush: Special thanks to tedliang for his wonderful hybrid mode solution.
From now on, users never have to worry about how to align a huge of nodes in one screen of browser. The option "verticalLevel" allows users to align child nodes vertically from the given level.
Note: currently, this option is incompatible with many other options or methods, like direction, drag&drop, addChildren(), removeNodes(), getHierarchy() and so on. These conflicts will be solved one by one in the later versions.
No problem. You just need to adjust a little detail of datasource with the help of option "collapse" and className "slide-up".
It's not a big deal. You just turn to the method init().
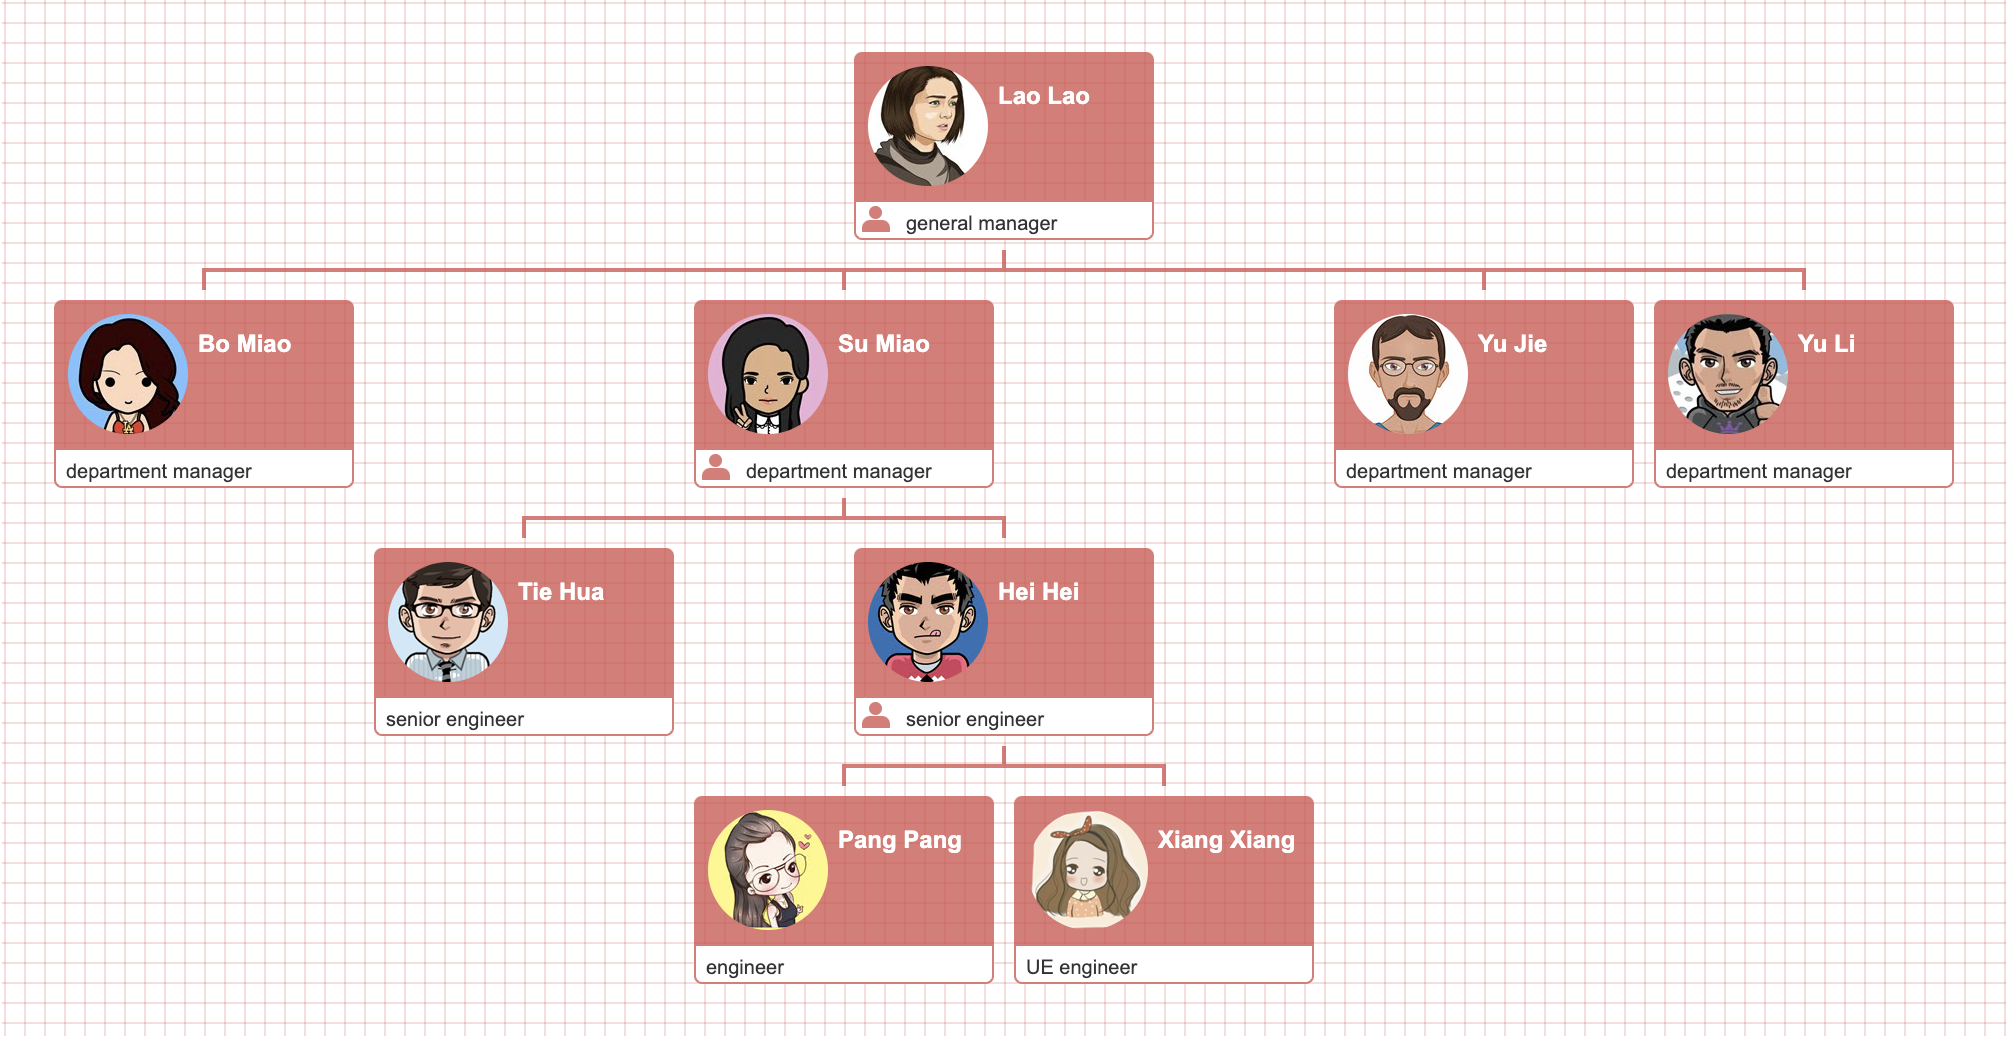
No problem. With the help of ES6 Template literals, we can customize the any complex node structure rather than the common title and content sections.
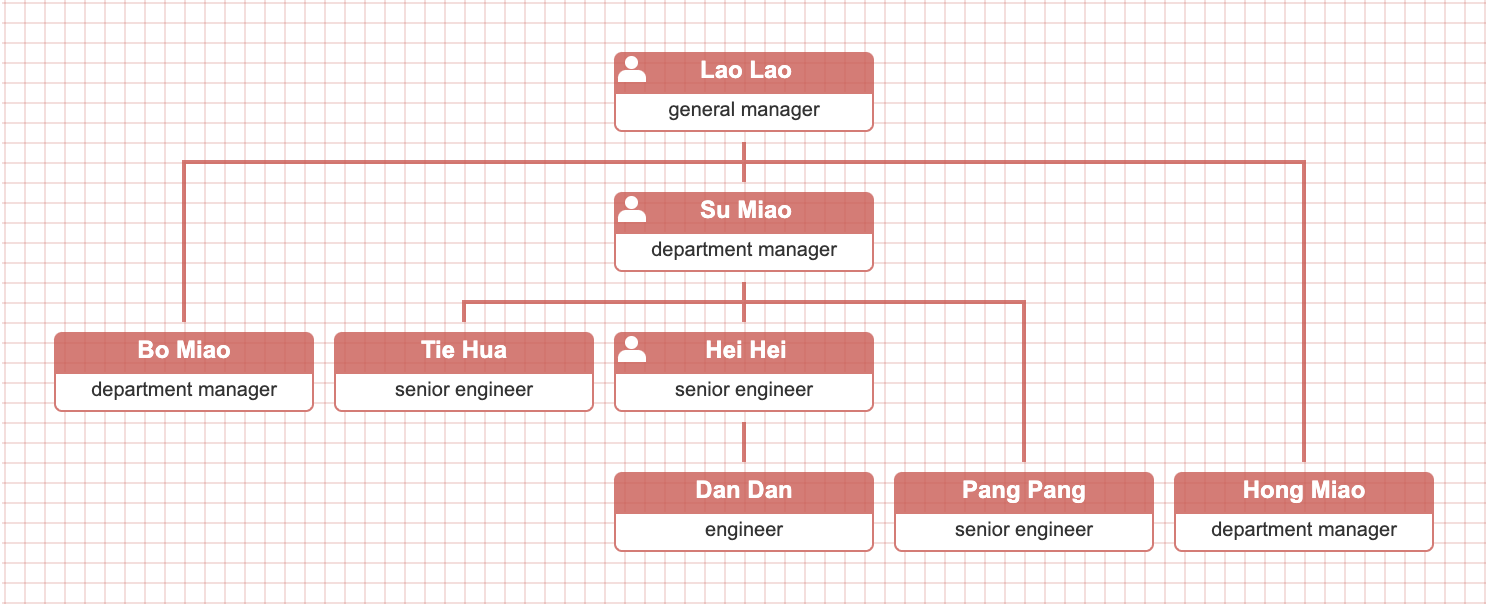
You need the solution based on new datasource structure with levelOffset data prop + callback createNode() + CSS custom properties(variables)
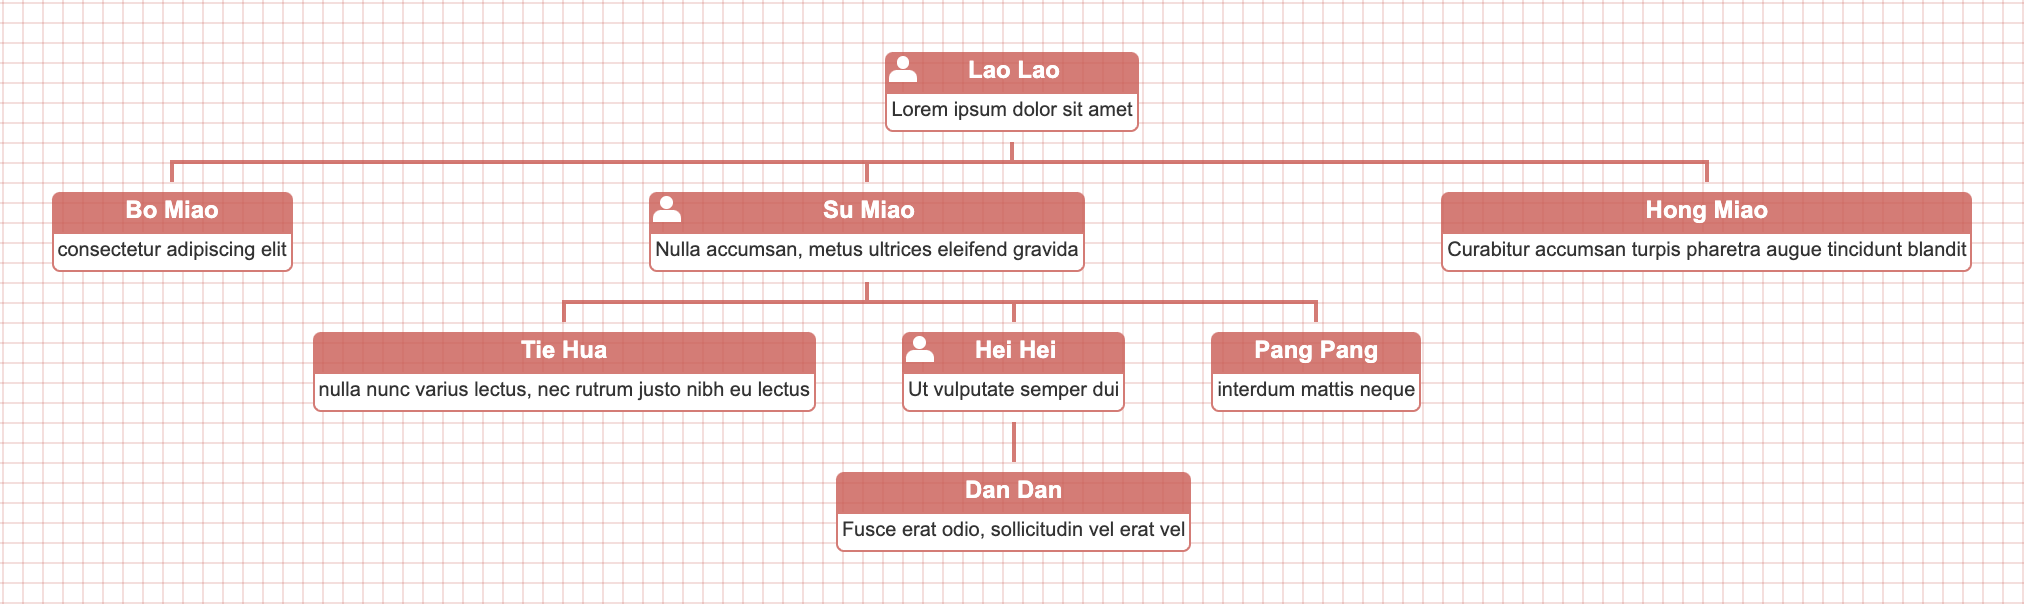
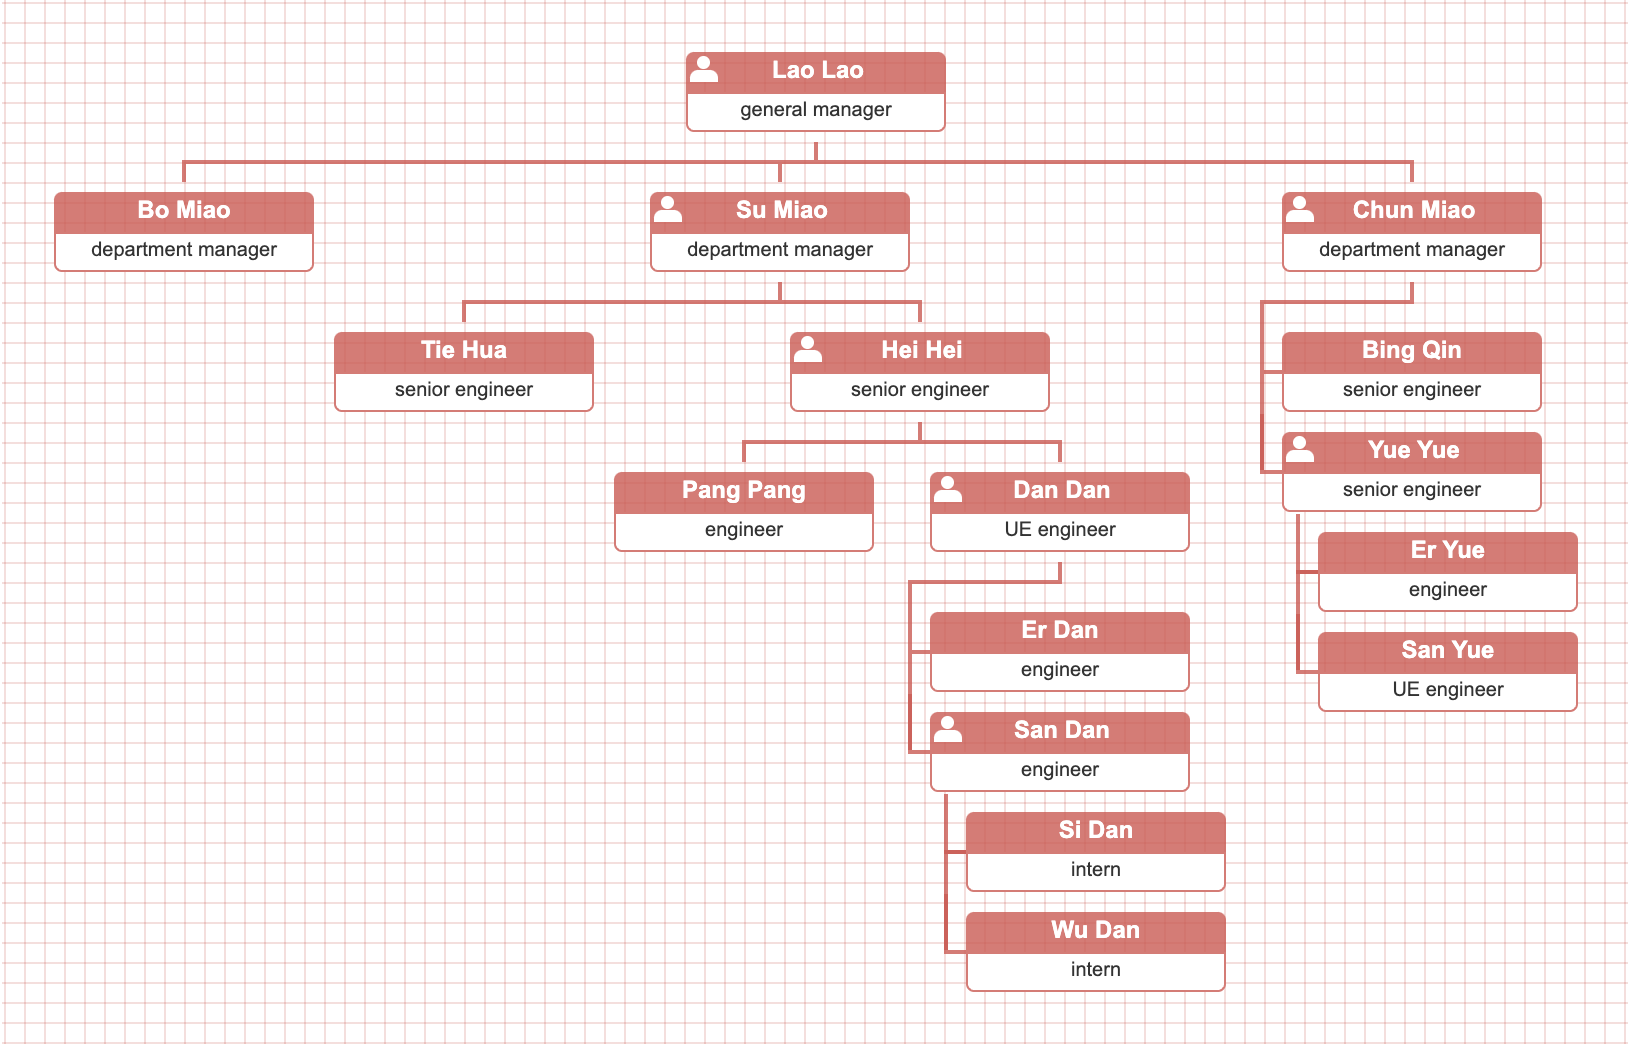
hybrid data property is designed for your use case. Once node data includes a "hybrid" prop with truthy value, its descendant nodes will be arranged vertically.
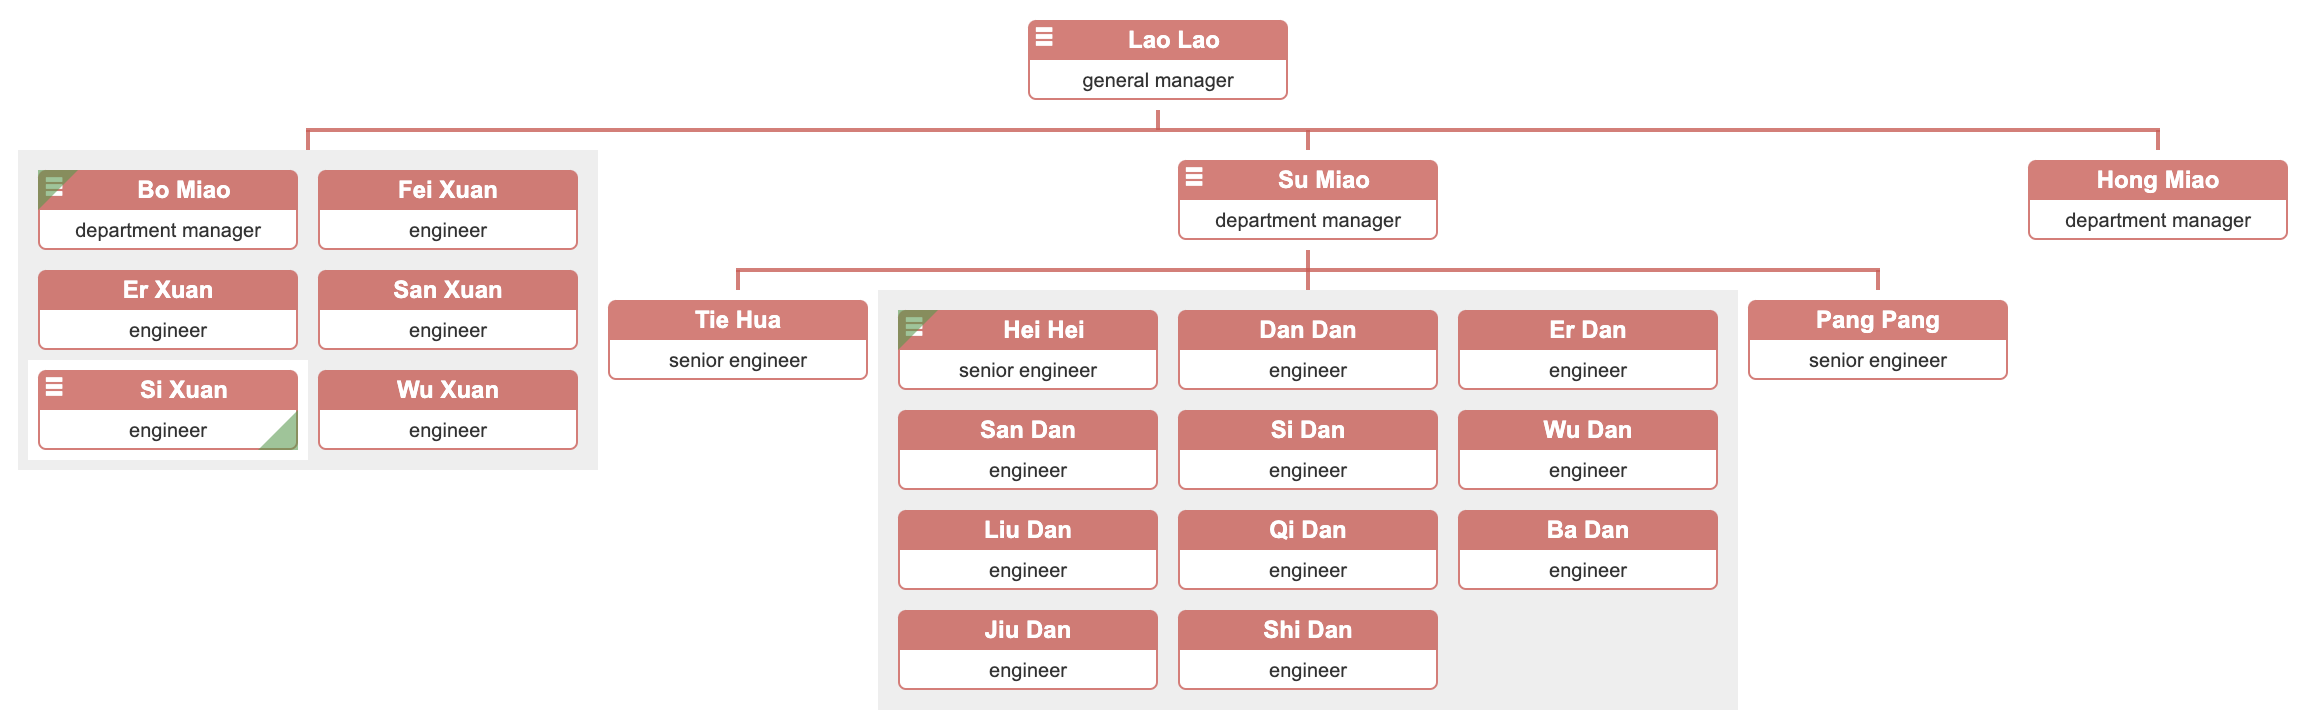
compact data property is designed for your use case. Once node data includes a "compact" prop with truthy value, itself and its descendant nodes will be arranged with compact mode.

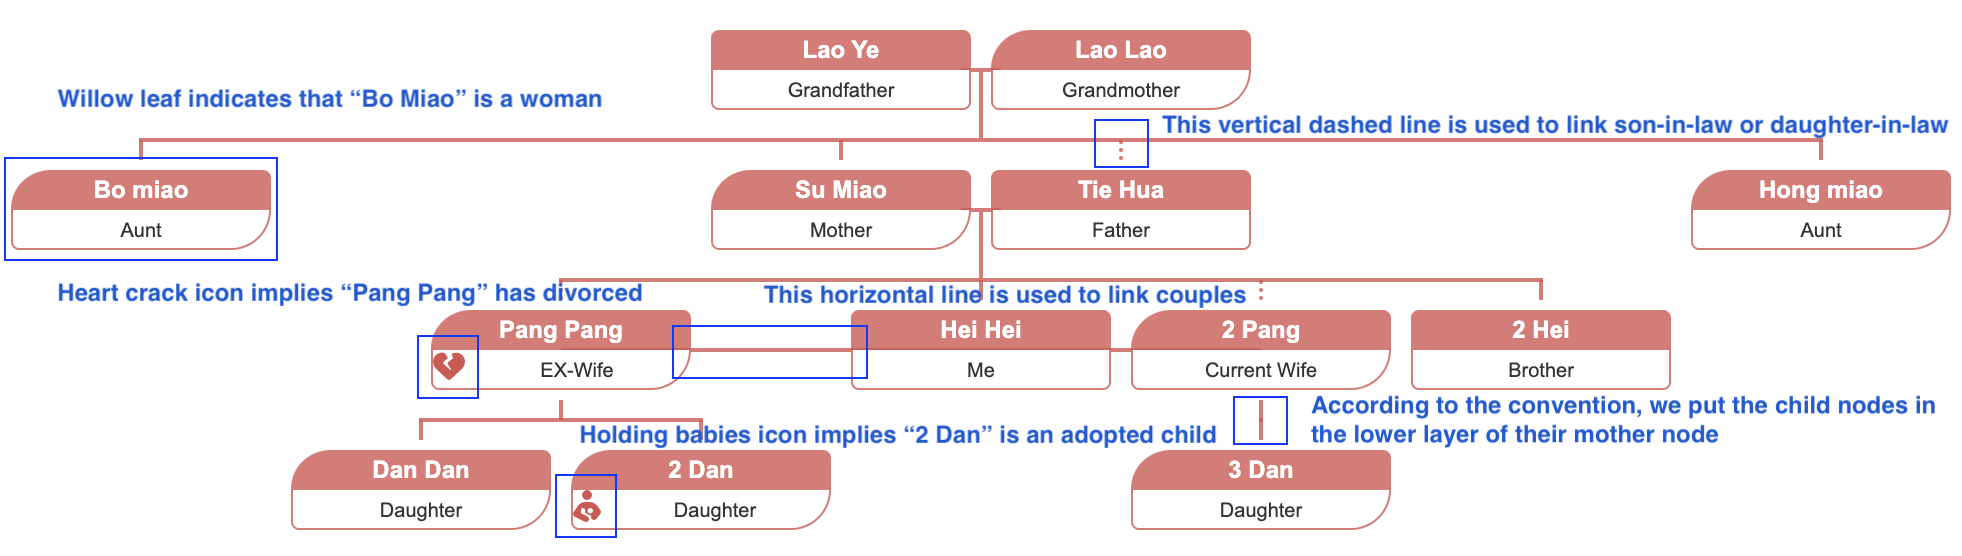
We use the following two-dimensional array datasource to build up the Family Tree. Here, prop "gender" is optional.
var datascource = [
[
{ 'id': '8', 'name': 'Lao Ye', 'title': 'Grandfather' },
{ 'id': '1', 'name': 'Lao Lao', 'title': 'Grandmother', 'outsider': true,
'children': [
[
{ 'id': '2', 'name': 'Bo miao', 'title': 'Aunt' }
],
[
{ 'id': '3', 'name': 'Su Miao', 'title': 'Mother',
'children': [
[
{ 'id': '12', 'name': 'Pang Pang', 'title': 'Wife', 'outsider': true,
'children': [
[{ 'id': '7', 'name': 'Dan Dan', 'title': 'Daughter' }],
[{ 'id': '6', 'name': 'Er Dan', 'title': 'Daughter' }],
]
},
{ 'id': '5', 'name': 'Hei Hei', 'title': 'Me' },
]
]
},
{ 'id': '9', 'name': 'Tie Hua', 'title': 'Father', 'outsider': true }
],
[
{ 'id': '10', 'name': 'Hong miao', 'title': 'Aunt' }
]
]
}
]
];
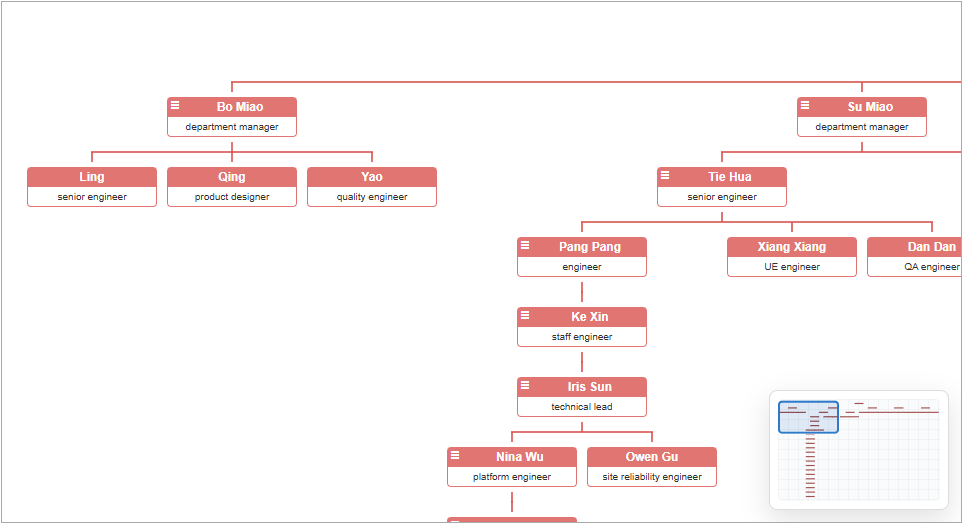
Enable the minimap option to display an overview navigator. Drag its viewport to move the chart, or use the mouse wheel over the minimap to zoom.
- you have to install node.js v6+ because our unit tests are based on jsdom v11
- you have to install modern browsers because many behaviors of orgchart plugin are based on HTML5 and CSS3
- run
npm installto install necessary dependencies - run
npm testto run all tests including unit tests, integration tests and e2e tests - run
npm run buildto generate production js&css files of plugin - run
npm startto start up local web server to host all the demos
varoc=newOrgChart({chartContainer: '#chartContainerId',data: datasource});{'id': 'rootNode',// It's a optional property which will be used as id attribute of node// and data-parent attribute, which contains the id of the parent node'collapsed': true,// By default, the children nodes of current node is hidden.'className': 'top-level',// It's a optional property// which will be used as className attribute of node.'nodeTitle': 'name',// This property is used to retrieve “title� value in datasource'nodeContent': 'title',// This property is used to retrieve "content" value in datasource'relationship': relationshipValue,// Note: when you activate ondemand loading nodes feature,// you should use json datsource (local or remote) and set this property.// This property implies that whether this node has parent, siblings, children.// relationshipValue is a string composed of three "0/1" identifier.// First character stands for wether current node has parent node;// Scond character stands for wether current node has siblings nodes;// Third character stands for wether current node has children node.'children': [// The property stands for nested nodes.{'name': 'Bo Miao','title': 'department manager','relationship': '110'},{'name': 'Su Miao','title': 'department manager','relationship': '111','children': [{'name': 'Tie Hua','title': 'senior engineer','relationship': '110'},{'name': 'Hei Hei','title': 'senior engineer','relationship': '110'}]},{'name': 'Yu Jie','title': 'department manager','relationship': '110'}],'otherPro': anyValue// feel free to append any useful properties};| Name | Type | Description |
|---|---|---|
| hybrid | truthy value | nodes will be arranged vertically if this property is set to true |
| compact | truthy value | node will be rendered with compact mode if this property is set to true |
| Name | Type | Required | Default | Description |
|---|---|---|---|---|
| data | json or HTMLUListElement | yes | datasource used to build out structure of orgchart. It can be a json object or an HTML ul element. | |
| pan | boolean | no | false | Users could pan the orgchart by mouse drag&drop if they enable this option. |
| zoom | boolean | no | false | Users could zoomin/zoomout the orgchart by mouse wheel if they enable this option. |
| zoominLimit | number | no | 7 | Users are allowed to set a zoom-in limit. |
| zoomoutLimit | number | no | 0.5 | Users are allowed to set a zoom-out limit. |
| direction | string | no | "t2b" | The available values are t2b(implies "top to bottom", it's default value), b2t(implies "bottom to top"), l2r(implies "left to right"), r2l(implies "right to left"). |
| verticalLevel | integer(>=2) | no | Users can make use of this option to align the nodes vertically from the specified level. | |
| toggleSiblingsResp | boolean | no | false | Once enable this option, users can show/hide left/right sibling nodes respectively by clicking left/right arrow. |
| visibleLevel | positive integer | no | 999 | It indicates the level that at the very beginning orgchart is expanded to. |
| nodeTitle | string | no | "name" | It sets one property of datasource as text content of title section of orgchart node. In fact, users can create a simple orghcart with only nodeTitle option. |
| parentNodeSymbol | string | no | "oci-menu" | Using your own icon to imply that the node has child nodes. |
| nodeContent | string | no | It sets one property of datasource as text content of content section of orgchart node. | |
| nodeId | string | no | "id" | It sets one property of datasource as unique identifier of every orgchart node. |
| nodeTemplate | function | no | It's a template generation function used to customize any complex internal structure of node. It receives only one parameter: "data" stands for json datasoure which will be used to render one node. | |
| createNode | function | no | It's a callback function used to customize every orgchart node. It receives two parameters: "node" stands for the single node element; "data" stands for datasource of single node. | |
| exportButton | boolean | no | false | It enable the export button for orgchart. |
| exportButtonName | string | no | "Export" | It's export button name. |
| exportFilename | string | no | "Orgchart" | It's filename when you export current orgchart as a picture. |
| exportFileextension | string | no | "png" | Available values are png and pdf. |
| chartClass | string | no | "" | when you wanna instantiate multiple orgcharts on one page, you should add diffent classname to them in order to distinguish them. |
| draggable | boolean | no | false | Users can drag & drop the nodes of orgchart if they enable this option. **Note**: this feature doesn't work on IE due to its poor support for HTML5 drag & drop API. |
| dropCriteria | function | no | Users can construct their own criteria to limit the relationships between dragged node and drop zone. Furtherly, this function accept three arguments(draggedNode, dragZone, dropZone) and just only return boolen values. | |
| initCompleted | function | no | It can often be useful to know when your table has fully been initialised, data loaded and rendered. It receives one parameter: "chart" stands for the initialized chart element. | |
| icons | json | no | Users can use this option to plug Font Awesome icons back in.
| |
| compact | function | no | This callback is used to determine current node is wether rendered with compact mode. The node's data is passed in as a parameter. Note:The option "compact" has a higher priority than data prop "compact". |
Create an instance with new OrgChart(options). Its chartContainer and chart properties expose the native container and rendered chart elements.
constoc=newOrgChart({chartContainer: '#chartContainerId',data: datasource});The public API is: init, setOptions, attachMinimap, detachMinimap, updateMinimap, addAncestors, addDescendants, addParent, addSiblings, addChildren, removeNodes, getHierarchy, getNodeState, getParent, getChildren, getSiblings, getRelatedNodes, hideParent, showParent, hideChildren, showChildren, hideSiblings, showSiblings, setChartScale, export, exportPNG, and exportPDF. Arguments that refer to nodes or charts are native HTMLElement instances.
| Call | Parameters | Return value and behavior |
|---|---|---|
oc.init(options) | Partial options object; use data to replace the data source. | Rebuilds the chart and returns oc. |
oc.setOptions(options)oc.setOptions(name, value) | Object containing data, pan, zoom, or minimap; or one of the supported names with a boolean value. | Rebuilds for data; toggles pan, zoom, or minimap otherwise; returns oc. |
oc.attachMinimap()oc.detachMinimap()oc.updateMinimap(forceRefresh) | forceRefresh is optional; true redraws preview nodes. | Creates, removes, or refreshes the minimap. Prefer setOptions('minimap', value) for normal enablement. |
oc.addAncestors(data, parentId) | Ancestor data and the id of the ancestor node that receives the existing root. | Inserts ancestor hierarchy; no return value. |
oc.addDescendants(data, parent) | Array of descendant data and a rendered parent .node. | Appends descendant hierarchy; no return value. |
oc.addParent(currentRoot, data) | Rendered root .node and its new parent data. | Wraps the current root with a parent; no return value. |
oc.addSiblings(node, data)oc.addChildren(node, data) | Rendered .node and an array of sibling or child data. | Adds rendered nodes; no return value. |
oc.removeNodes(node) | Rendered .node to remove. | Removes the node and its descendants; no return value. |
oc.getHierarchy(includeNodeData) | Optional boolean, default false. | Returns the hierarchy object; returns an error string when the chart or required node ids are unavailable. |
oc.getNodeState(node, relation) | Rendered .node; relation is parent, children, or siblings. | Returns { exist, visible }. |
oc.getParent(node) | Rendered .node. | Returns its parent .node, or null. |
oc.getChildren(node)oc.getSiblings(node) | Rendered .node. | Returns an array of direct child or sibling .node elements. |
oc.getRelatedNodes(node, relation) | Rendered .node; relation is parent, children, or siblings. | Equivalent generalized query; parent returns a node or null, other relations return arrays. |
oc.hideParent(node) / oc.showParent(node)oc.hideChildren(node) / oc.showChildren(node) | Rendered .node. | Hides or reveals the related branch with the chart transition; no return value. |
oc.hideSiblings(node, direction)oc.showSiblings(node, direction) | Rendered .node; optional direction is left or right. | Hides or reveals siblings on one side, or all siblings when omitted; no return value. |
oc.setChartScale(chart, multiplier, zoomAnchor) | Usually pass oc.chart; positive relative scale multiplier; optional viewport point { x, y }. | Scales within configured zoom limits and keeps zoomAnchor fixed when supplied. |
oc.export(filename, extension) | Optional filename and png or pdf extension. | Starts export using configured defaults; returns false if the chart cannot be exported. |
oc.exportPNG(canvas, filename)oc.exportPDF(canvas, filename, exportScale) | Prepared canvas; filename; PDF scale defaults to 1. | Downloads the supplied canvas directly as PNG or PDF; normally call export() instead. |
It's the useful way when users want to re-initialize or refresh orgchart based on new options or reload new data.
Updates pan, zoom, or minimap without rebuilding the chart. Pass an options object, or a supported option name and boolean value. Passing an object containing data rebuilds the chart.
Creates or removes the minimap overlay for the current chart. Usually use setOptions('minimap', true|false) so the option state and overlay stay synchronized.
Recalculates the minimap viewport after changing the chart transform or layout. Pass true to redraw the minimap node preview.
Adds the ancestors for current orgchart.
| Name | Type | Required | Default | Description |
|---|---|---|---|---|
| data | json | yes | datasource for building ancestors | |
| parentId | string | yes | append current orgchart to the parent node with parentId |
Adds the descendants for specified parent node.
| Name | Type | Required | Default | Description |
|---|---|---|---|---|
| data | array | yes | datasource for building descendants | |
| parent | HTMLElement | yes | append descendants to the parent node |
Adds parent node(actullay it's always root node) for current orgchart.
| Name | Type | Required | Default | Description |
|---|---|---|---|---|
| currentRoot | HTMLElement | yes | current root node that the new parent node will wrap | |
| data | json object | yes | datasource for building root node |
Adds sibling nodes for designated node.
| Name | Type | Required | Default | Description |
|---|---|---|---|---|
| node | HTMLElement | yes | we'll add sibling nodes based on this node | |
| data | array | yes | datasource for building sibling nodes |
Adds child nodes for designed node.
| Name | Type | Required | Default | Description |
|---|---|---|---|---|
| node | HTMLElement | yes | we'll add child nodes based on this node | |
| data | array | yes | datasource for building child nodes |
Removes the designated node and its descedant nodes.
| Name | Type | Required | Default | Description |
|---|---|---|---|---|
| node | HTMLElement | yes | node to be removed |
This method is designed to get the hierarchy relationships of orgchart for further processing. For example, after editing the orgchart, you could send the returned value of this method to server-side and save the new state of orghcart.
| Name | Type | Required | Default | Description |
|---|---|---|---|---|
| includeNodeData | Boolean | No | false | This optional parameter determines whether include the nodeData items in the generated JSON object in addition to the id and children |
This method allows you to hide programatically the parent node of any specific node(.node element), if it has.
| Name | Type | Required | Default | Description |
|---|---|---|---|---|
| node | HTMLElement | Yes | It is the node element whose parent node should be hidden. Its sibling nodes will be hidden at the same time. |
This method allows you to show programatically the parent node of any specific node(.node element), if it has.
| Name | Type | Required | Default | Description |
|---|---|---|---|---|
| node | HTMLElement | Yes | It is the node element whose parent node should be shown |
This method allows you to hide programatically the children of any specific node(.node element), if it has.
| Name | Type | Required | Default | Description |
|---|---|---|---|---|
| node | HTMLElement | Yes | It is the node element whose child nodes should be hidden |
This method allows you to show programatically the children of any specific node(.node element), if it has.
| Name | Type | Required | Default | Description |
|---|---|---|---|---|
| node | HTMLElement | Yes | It is the node element whose child nodes should be shown |
This method allows you to hide programatically the siblings of any specific node(.node element), if it has.
| Name | Type | Required | Default | Description |
|---|---|---|---|---|
| node | HTMLElement | Yes | It is the node element whose sibling nodes should be hidden | |
| direction | string | No | Possible values:"left","rigth". Specifies if hide the siblings at left or rigth. If not defined hide both of them. |
This method allows you to show programatically the siblings of any specific node(.node element), if it has.
| Name | Type | Required | Default | Description |
|---|---|---|---|---|
| node | HTMLElement | Yes | It is the node element whose sibling nodes should be shown | |
| direction | string | No | Possible values:"left","rigth". Specifies if show the siblings at left or rigth. If not defined show both of them. |
This method returns you the display state of related node of the specified node.
| Name | Type | Required | Default | Description |
|---|---|---|---|---|
| node | HTMLElement | Yes | It is the node element whose related nodes' display state you want to inspect. | |
| relation | String | Yes | Possible values: "parent", "children" and "siblings". Specifies the desired relation to return. |
The returning object will have the following structure:
{"exist": true|false,// Indicates if has parent|children|siblings"visible":true|false,// Indicates if the relationship nodes are visible}This method returns you the nodes related to the specified node.
| Name | Type | Required | Default | Description |
|---|---|---|---|---|
| node | HTMLElement | Yes | It is the node element whose related nodes you want to inspect | |
| relation | String | Yes | Possible values: "parent", "children" and "siblings". Specifies the desired relation to return. |
This method returns you the parent node of the specified node.
| Name | Type | Required | Default | Description |
|---|---|---|---|---|
| node | HTMLElement | Yes | It is the node element whose parent node you want to inspect |
This method returns you the sibling nodes of the specified node.
| Name | Type | Required | Default | Description |
|---|---|---|---|---|
| node | HTMLElement | Yes | It is the node element whose sibling nodes you want to inspect |
This method returns you the child nodes of the specified node.
| Name | Type | Required | Default | Description |
|---|---|---|---|---|
| node | HTMLElement | Yes | It is the node element whose child nodes you want to inspect |
This method helps you set the specified chart with new scale.
zoomAnchor is optional and has the form { x, y } in viewport coordinates. When provided, that point remains fixed while the chart is scaled.
| Name | Type | Required | Default | Description |
|---|---|---|---|---|
| chart | HTMLElement | Yes | It is the chart element in your chart-container | |
| newScale | Float | Yes | Positive float value which is used to zoom in/out the chart |
This method allow you to export current orgchart as png or pdf file.
| Name | Type | Required | Default | Description |
|---|---|---|---|---|
| exportFilename | String | No | 'OrgChart' | It's the name of exported file |
| exportFileextension | String | No | 'png' | It's the extension name of exported file |
Exports a prepared canvas as a PNG download. This helper is useful when application code supplies its own canvas; most users should call export() instead.
Exports a prepared canvas as a PDF download. exportScale is the canvas render scale and is used to preserve the PDF's logical dimensions; most users should call export() instead.
OrgChart dispatches bubbling native CustomEvent objects. Subscribe with addEventListener; event payloads are available on event.detail.
oc.chart.addEventListener('nodedrop.orgchart',function(event){const{ draggedNode, dragZone, dropZone }=event.detail;});| Event Type | Additional Parameters | Description |
|---|---|---|
| nodedrop.orgchart | event.detail: draggedNode, dragZone, dropZone | Fires on the chart before a node is moved. Call event.preventDefault() to cancel the drop. |
| otherdropped.orgchart | event.detail: draggedItem, dropZone | Fires on the chart when a non-OrgChart draggable item is dropped onto a node. |
| init.orgchart | None; event.target is the chart element | Fires after the chart has been rendered. |
| show-[relation].orgchart | Fires on the node when related nodes become visible. relation is parent, children, or siblings. | |
| hide-[relation].orgchart | Fires on the node when related nodes are hidden. relation is parent, children, or siblings. |
This use case is inspired by the issue. Thanks der-robert and ActiveScottShaw for their constructive discussions:blush:
Users can enable/disable exapand/collapse feature with className "noncollapsable" as shown below.
oc.chart.classList.add('noncollapsable');// deactivateoc.chart.classList.remove('noncollapsable');// activateWhen I have a huge orgchart with enabled "pan" option, if I hide all the children of one of the topmost parents then the chart disappear from screen. It seems that we need to add a reset button to keep the chart visible. For details, please refer to the issue opened by manuel-84 😊
Users can embed any clear up logics into the click handler of the reset buttton as shown below.
oc.chart.style.transform='';// remove transform settings- Chrome 19+
- Firefox 4+
- Safari 6+
- Opera 15+
- IE 10+