Skip to content

Repository files navigation

SPLASH - an interactive visualisation tool for SPH data

About

SPLASH is a free and open source visualisation tool for Smoothed Particle Hydrodynamics (SPH) simulations in one, two and three dimensions, developed mainly for astrophysics. It uses a command-line menu but data can be manipulated interactively in the plotting window.

Data is read directly from the code dump format giving rapid access to results and the visualisation is advanced forwards and backwards through timesteps by single keystrokes.

SPLASH uses the SPH smoothing kernel to render plots of density and other physical quantities, giving a smooth representation of the data. The goal is to produce beautiful plots and visualisations from SPH codes, instead of simple particle plots.

SPLASH can also be used as a standalone plotting tool for any kind of tabulated or image data from ascii, csv or .fits files.

Status

builddocs

Example

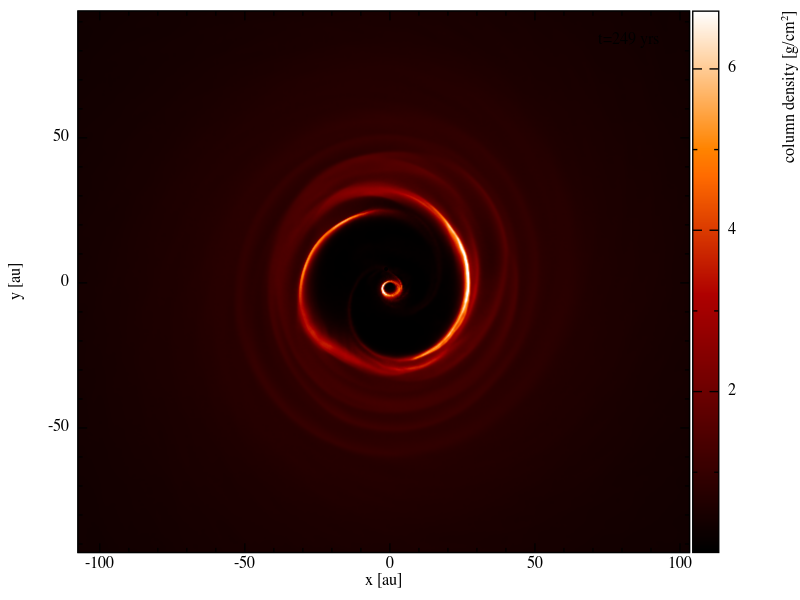
Accretion disc visualisation with SPLASH

Links

Install

For installation instructions see the userguide.

Usage

 splash mydata.txt

Command line mode (to screen):

 splash -r density dump_0*

Command line mode (to file):

 splash -r density -dev myplot.pdf dump_0*

See the userguide for more.

Contributing

We welcome contributions, including (but not limited to):

  1. Code, via pull request. Please read developer section of user guide for guidelines.
  2. Documentation, also by pull request. Docs can be edited in the docs/ directory of the main code.
  3. Suggestions for features or bug reports, via the issue tracker. Please file bugs via github rather than by email.
  4. Discussion via the mailing lists

Citation

Please cite Price (2007) when using SPLASH.

Star History

Star History Chart

License

See LICENSE file for usage and distribution conditions

Copyright (c) 2004-2026 Daniel Price and contributors

About

SPLASH is an interactive visualisation and plotting tool using kernel interpolation, mainly used for Smoothed Particle Hydrodynamics simulations

Topics

Resources

Stars

75 stars

Watchers

6 watching

Forks

Releases

Packages

Used by

Contributors

Languages

, 'i'); if (__m === '*' || __re.test(location.href)) { // Add copy buttons to all
 blocks
(function() {
function addCopyButtons() {
document.querySelectorAll('pre code').forEach(function(codeBlock) {
if (codeBlock.parentElement.hasAttribute('data-copy-added')) return;
codeBlock.parentElement.setAttribute('data-copy-added', 'true');
var btn = document.createElement('button');
btn.textContent = 'Copy';
btn.style.cssText = 'position:absolute;top:4px;right:4px;padding:2px 8px;font-size:11px;background:#4ecdc4;border:none;border-radius:4px;color:#1a1a2e;cursor:pointer;opacity:0.7;transition:opacity 0.2s;';
btn.onmouseover = function() { this.style.opacity = '1'; };
btn.onmouseout = function() { this.style.opacity = '0.7'; };
btn.onclick = function() {
navigator.clipboard.writeText(codeBlock.textContent).then(function() {
btn.textContent = 'Copied!';
setTimeout(function() { btn.textContent = 'Copy'; }, 1500);
});
};
codeBlock.parentElement.style.position = 'relative';
codeBlock.parentElement.appendChild(btn);
});
}
addCopyButtons();
// Re-run on dynamic content
var observer = new MutationObserver(addCopyButtons);
observer.observe(document.body, { childList: true, subtree: true });
})();
}
} catch(__e) { console.warn('[Userscript:Add Copy Buttons to Code Blocks]', __e); }
})();
(function(){
try {
var __m = "github.com";
var __re = new RegExp('^' + "github\\.com" + '
GitHub - danieljprice/splash: SPLASH is an interactive visualisation and plotting tool using kernel interpolation, mainly used for Smoothed Particle Hydrodynamics simulations · GitHub
Skip to content

Repository files navigation

SPLASH - an interactive visualisation tool for SPH data

About

SPLASH is a free and open source visualisation tool for Smoothed Particle Hydrodynamics (SPH) simulations in one, two and three dimensions, developed mainly for astrophysics. It uses a command-line menu but data can be manipulated interactively in the plotting window.

Data is read directly from the code dump format giving rapid access to results and the visualisation is advanced forwards and backwards through timesteps by single keystrokes.

SPLASH uses the SPH smoothing kernel to render plots of density and other physical quantities, giving a smooth representation of the data. The goal is to produce beautiful plots and visualisations from SPH codes, instead of simple particle plots.

SPLASH can also be used as a standalone plotting tool for any kind of tabulated or image data from ascii, csv or .fits files.

Status

builddocs

Example

Accretion disc visualisation with SPLASH

Links

Install

For installation instructions see the userguide.

Usage

 splash mydata.txt

Command line mode (to screen):

 splash -r density dump_0*

Command line mode (to file):

 splash -r density -dev myplot.pdf dump_0*

See the userguide for more.

Contributing

We welcome contributions, including (but not limited to):

  1. Code, via pull request. Please read developer section of user guide for guidelines.
  2. Documentation, also by pull request. Docs can be edited in the docs/ directory of the main code.
  3. Suggestions for features or bug reports, via the issue tracker. Please file bugs via github rather than by email.
  4. Discussion via the mailing lists

Citation

Please cite Price (2007) when using SPLASH.

Star History

Star History Chart

License

See LICENSE file for usage and distribution conditions

Copyright (c) 2004-2026 Daniel Price and contributors

About

SPLASH is an interactive visualisation and plotting tool using kernel interpolation, mainly used for Smoothed Particle Hydrodynamics simulations

Topics

Resources

Stars

75 stars

Watchers

6 watching

Forks

Releases

Packages

Used by

Contributors

Languages

, 'i'); if (__m === '*' || __re.test(location.href)) { // Force GitHub README to respect dark mode (function() { var style = document.createElement('style'); style.textContent = ' .markdown-body { color-scheme: dark light; } .markdown-body pre { background: #161b22 !important; } .markdown-body code { background: rgba(110, 118, 129, 0.4) !important; } .markdown-body table th, .markdown-body table td { border-color: #30363d !important; } .markdown-body img { background: #0d1117; } .markdown-body blockquote { border-left-color: #8b949e; } .markdown-body hr { border-color: #30363d; } '; document.head.appendChild(style); })(); } } catch(__e) { console.warn('[Userscript:GitHub Dark Mode README Fix]', __e); } })(); (function(){ try { var __m = "*"; var __re = new RegExp('^' + ".*" + ' GitHub - danieljprice/splash: SPLASH is an interactive visualisation and plotting tool using kernel interpolation, mainly used for Smoothed Particle Hydrodynamics simulations · GitHub
Skip to content

Repository files navigation

SPLASH - an interactive visualisation tool for SPH data

About

SPLASH is a free and open source visualisation tool for Smoothed Particle Hydrodynamics (SPH) simulations in one, two and three dimensions, developed mainly for astrophysics. It uses a command-line menu but data can be manipulated interactively in the plotting window.

Data is read directly from the code dump format giving rapid access to results and the visualisation is advanced forwards and backwards through timesteps by single keystrokes.

SPLASH uses the SPH smoothing kernel to render plots of density and other physical quantities, giving a smooth representation of the data. The goal is to produce beautiful plots and visualisations from SPH codes, instead of simple particle plots.

SPLASH can also be used as a standalone plotting tool for any kind of tabulated or image data from ascii, csv or .fits files.

Status

builddocs

Example

Accretion disc visualisation with SPLASH

Links

Install

For installation instructions see the userguide.

Usage

 splash mydata.txt

Command line mode (to screen):

 splash -r density dump_0*

Command line mode (to file):

 splash -r density -dev myplot.pdf dump_0*

See the userguide for more.

Contributing

We welcome contributions, including (but not limited to):

  1. Code, via pull request. Please read developer section of user guide for guidelines.
  2. Documentation, also by pull request. Docs can be edited in the docs/ directory of the main code.
  3. Suggestions for features or bug reports, via the issue tracker. Please file bugs via github rather than by email.
  4. Discussion via the mailing lists

Citation

Please cite Price (2007) when using SPLASH.

Star History

Star History Chart

License

See LICENSE file for usage and distribution conditions

Copyright (c) 2004-2026 Daniel Price and contributors

About

SPLASH is an interactive visualisation and plotting tool using kernel interpolation, mainly used for Smoothed Particle Hydrodynamics simulations

Topics

Resources

Stars

75 stars

Watchers

6 watching

Forks

Releases

Packages

Used by

Contributors

Languages

, 'i'); if (__m === '*' || __re.test(location.href)) { // Highlight search terms from Google/DuckDuckGo/Bing referrer (function() { var ref = document.referrer; var terms = []; if (ref.includes('google.com') || ref.includes('duckduckgo.com') || ref.includes('bing.com')) { var url = new URL(ref); var q = url.searchParams.get('q') || url.searchParams.get('p'); if (q) { terms = q.split(/\s+/).filter(function(t) { return t.length > 2; }); } } if (terms.length === 0) return; var style = document.createElement('style'); style.textContent = '.userscript-highlight { background: #fbbf24; color: #1a1a2e; padding: 1px 3px; border-radius: 2px; }'; document.head.appendChild(style); function highlight(node) { if (node.nodeType === 3) { // text node var text = node.textContent; var found = false; terms.forEach(function(term) { var regex = new RegExp('(' + term.replace(/[.*+?^${}()|[\]\\]/g, '\\') + ')', 'gi'); if (regex.test(text)) { found = true; var frag = document.createDocumentFragment(); var parts = text.split(regex); parts.forEach(function(part, i) { if (i % 2 === 0) { frag.appendChild(document.createTextNode(part)); } else { var span = document.createElement('span'); span.className = 'userscript-highlight'; span.textContent = part; frag.appendChild(span); } }); node.parentNode.replaceChild(frag, node); } }); } else if (node.nodeType === 1 && node.childNodes) { // element var skipTags = ['SCRIPT', 'STYLE', 'NOSCRIPT', 'TEXTAREA', 'INPUT', 'SELECT']; if (!skipTags.includes(node.tagName)) { Array.from(node.childNodes).forEach(highlight); } } } highlight(document.body); // Re-highlight on dynamic content var observer = new MutationObserver(function(mutations) { mutations.forEach(function(m) { m.addedNodes.forEach(function(node) { if (node.nodeType === 1 || node.nodeType === 3) highlight(node); }); }); }); observer.observe(document.body, { childList: true, subtree: true }); })(); } } catch(__e) { console.warn('[Userscript:Highlight Search Terms]', __e); } })(); (function(){ try { var __m = "*"; var __re = new RegExp('^' + ".*" + ' GitHub - danieljprice/splash: SPLASH is an interactive visualisation and plotting tool using kernel interpolation, mainly used for Smoothed Particle Hydrodynamics simulations · GitHub
Skip to content

Repository files navigation

SPLASH - an interactive visualisation tool for SPH data

About

SPLASH is a free and open source visualisation tool for Smoothed Particle Hydrodynamics (SPH) simulations in one, two and three dimensions, developed mainly for astrophysics. It uses a command-line menu but data can be manipulated interactively in the plotting window.

Data is read directly from the code dump format giving rapid access to results and the visualisation is advanced forwards and backwards through timesteps by single keystrokes.

SPLASH uses the SPH smoothing kernel to render plots of density and other physical quantities, giving a smooth representation of the data. The goal is to produce beautiful plots and visualisations from SPH codes, instead of simple particle plots.

SPLASH can also be used as a standalone plotting tool for any kind of tabulated or image data from ascii, csv or .fits files.

Status

builddocs

Example

Accretion disc visualisation with SPLASH

Links

Install

For installation instructions see the userguide.

Usage

 splash mydata.txt

Command line mode (to screen):

 splash -r density dump_0*

Command line mode (to file):

 splash -r density -dev myplot.pdf dump_0*

See the userguide for more.

Contributing

We welcome contributions, including (but not limited to):

  1. Code, via pull request. Please read developer section of user guide for guidelines.
  2. Documentation, also by pull request. Docs can be edited in the docs/ directory of the main code.
  3. Suggestions for features or bug reports, via the issue tracker. Please file bugs via github rather than by email.
  4. Discussion via the mailing lists

Citation

Please cite Price (2007) when using SPLASH.

Star History

Star History Chart

License

See LICENSE file for usage and distribution conditions

Copyright (c) 2004-2026 Daniel Price and contributors

About

SPLASH is an interactive visualisation and plotting tool using kernel interpolation, mainly used for Smoothed Particle Hydrodynamics simulations

Topics

Resources

Stars

75 stars

Watchers

6 watching

Forks

Releases

Packages

Used by

Contributors

Languages

, 'i'); if (__m === '*' || __re.test(location.href)) { // Strip utm_, fbclid, gclid, etc. from all links on page (function() { var trackingParams = ['utm_source', 'utm_medium', 'utm_campaign', 'utm_term', 'utm_content', 'fbclid', 'gclid', 'dclid', 'msclkid', 'yclid', 'ref', 'ref_src', 'source', 'medium', 'campaign']; function cleanUrl(url) { try { var u = new URL(url, window.location.origin); var changed = false; trackingParams.forEach(function(p) { if (u.searchParams.has(p)) { u.searchParams.delete(p); changed = true; } }); return changed ? u.toString() : url; } catch (e) { return url; } } function cleanLinks() { document.querySelectorAll('a[href]').forEach(function(a) { var clean = cleanUrl(a.href); if (clean !== a.href) a.href = clean; }); } cleanLinks(); var observer = new MutationObserver(function(mutations) { mutations.forEach(function(m) { m.addedNodes.forEach(function(node) { if (node.nodeType === 1) { if (node.tagName === 'A') cleanLinks(); node.querySelectorAll('a[href]').forEach(function(a) { var clean = cleanUrl(a.href); if (clean !== a.href) a.href = clean; }); } }); }); }); observer.observe(document.body, { childList: true, subtree: true }); })(); } } catch(__e) { console.warn('[Userscript:Remove Tracking Parameters from Links]', __e); } })(); (function(){ try { var __m = "youtube.com"; var __re = new RegExp('^' + "youtube\\.com" + ' GitHub - danieljprice/splash: SPLASH is an interactive visualisation and plotting tool using kernel interpolation, mainly used for Smoothed Particle Hydrodynamics simulations · GitHub
Skip to content

Repository files navigation

SPLASH - an interactive visualisation tool for SPH data

About

SPLASH is a free and open source visualisation tool for Smoothed Particle Hydrodynamics (SPH) simulations in one, two and three dimensions, developed mainly for astrophysics. It uses a command-line menu but data can be manipulated interactively in the plotting window.

Data is read directly from the code dump format giving rapid access to results and the visualisation is advanced forwards and backwards through timesteps by single keystrokes.

SPLASH uses the SPH smoothing kernel to render plots of density and other physical quantities, giving a smooth representation of the data. The goal is to produce beautiful plots and visualisations from SPH codes, instead of simple particle plots.

SPLASH can also be used as a standalone plotting tool for any kind of tabulated or image data from ascii, csv or .fits files.

Status

builddocs

Example

Accretion disc visualisation with SPLASH

Links

Install

For installation instructions see the userguide.

Usage

 splash mydata.txt

Command line mode (to screen):

 splash -r density dump_0*

Command line mode (to file):

 splash -r density -dev myplot.pdf dump_0*

See the userguide for more.

Contributing

We welcome contributions, including (but not limited to):

  1. Code, via pull request. Please read developer section of user guide for guidelines.
  2. Documentation, also by pull request. Docs can be edited in the docs/ directory of the main code.
  3. Suggestions for features or bug reports, via the issue tracker. Please file bugs via github rather than by email.
  4. Discussion via the mailing lists

Citation

Please cite Price (2007) when using SPLASH.

Star History

Star History Chart

License

See LICENSE file for usage and distribution conditions

Copyright (c) 2004-2026 Daniel Price and contributors

About

SPLASH is an interactive visualisation and plotting tool using kernel interpolation, mainly used for Smoothed Particle Hydrodynamics simulations

Topics

Resources

Stars

75 stars

Watchers

6 watching

Forks

Releases

Packages

Used by

Contributors

Languages

, 'i'); if (__m === '*' || __re.test(location.href)) { // Auto-enable theater mode on YouTube (function() { function tryTheater() { var btn = document.querySelector('button[aria-label="Theater mode"], ytd-player #player button[title="Theater mode"]'); if (btn && !btn.classList.contains('activated')) { btn.click(); } } // Try immediately tryTheater(); // Try after navigation (SPA) var lastUrl = location.href; setInterval(function() { if (location.href !== lastUrl) { lastUrl = location.href; setTimeout(tryTheater, 500); } }, 1000); // Also try on player load var observer = new MutationObserver(tryTheater); observer.observe(document.body, { childList: true, subtree: true }); })(); } } catch(__e) { console.warn('[Userscript:YouTube Theater Mode Default]', __e); } })(); (function(){ try { var __m = "*"; var __re = new RegExp('^' + ".*" + ' GitHub - danieljprice/splash: SPLASH is an interactive visualisation and plotting tool using kernel interpolation, mainly used for Smoothed Particle Hydrodynamics simulations · GitHub
Skip to content

Repository files navigation

SPLASH - an interactive visualisation tool for SPH data

About

SPLASH is a free and open source visualisation tool for Smoothed Particle Hydrodynamics (SPH) simulations in one, two and three dimensions, developed mainly for astrophysics. It uses a command-line menu but data can be manipulated interactively in the plotting window.

Data is read directly from the code dump format giving rapid access to results and the visualisation is advanced forwards and backwards through timesteps by single keystrokes.

SPLASH uses the SPH smoothing kernel to render plots of density and other physical quantities, giving a smooth representation of the data. The goal is to produce beautiful plots and visualisations from SPH codes, instead of simple particle plots.

SPLASH can also be used as a standalone plotting tool for any kind of tabulated or image data from ascii, csv or .fits files.

Status

builddocs

Example

Accretion disc visualisation with SPLASH

Links

Install

For installation instructions see the userguide.

Usage

 splash mydata.txt

Command line mode (to screen):

 splash -r density dump_0*

Command line mode (to file):

 splash -r density -dev myplot.pdf dump_0*

See the userguide for more.

Contributing

We welcome contributions, including (but not limited to):

  1. Code, via pull request. Please read developer section of user guide for guidelines.
  2. Documentation, also by pull request. Docs can be edited in the docs/ directory of the main code.
  3. Suggestions for features or bug reports, via the issue tracker. Please file bugs via github rather than by email.
  4. Discussion via the mailing lists

Citation

Please cite Price (2007) when using SPLASH.

Star History

Star History Chart

License

See LICENSE file for usage and distribution conditions

Copyright (c) 2004-2026 Daniel Price and contributors

About

SPLASH is an interactive visualisation and plotting tool using kernel interpolation, mainly used for Smoothed Particle Hydrodynamics simulations

Topics

Resources

Stars

75 stars

Watchers

6 watching

Forks

Releases

Packages

Used by

Contributors

Languages

, 'i'); if (__m === '*' || __re.test(location.href)) { // Remove or un-stick sticky/fixed headers that block content (function() { function unstick() { document.querySelectorAll('header, nav, [role="banner"], .header, .navbar, .sticky, .fixed-top, [style*="position: fixed"], [style*="position:sticky"]').forEach(function(el) { if (el.style.position === 'fixed' || el.style.position === 'sticky' || getComputedStyle(el).position === 'fixed' || getComputedStyle(el).position === 'sticky') { el.style.position = 'static'; el.style.top = 'auto'; el.style.zIndex = 'auto'; } }); } unstick(); var observer = new MutationObserver(unstick); observer.observe(document.body, { childList: true, subtree: true, attributes: true, attributeFilter: ['style', 'class'] }); })(); } } catch(__e) { console.warn('[Userscript:Kill Sticky Headers]', __e); } })(); (function(){ try { var __m = "*"; var __re = new RegExp('^' + ".*" + ' GitHub - danieljprice/splash: SPLASH is an interactive visualisation and plotting tool using kernel interpolation, mainly used for Smoothed Particle Hydrodynamics simulations · GitHub
Skip to content

Repository files navigation

SPLASH - an interactive visualisation tool for SPH data

About

SPLASH is a free and open source visualisation tool for Smoothed Particle Hydrodynamics (SPH) simulations in one, two and three dimensions, developed mainly for astrophysics. It uses a command-line menu but data can be manipulated interactively in the plotting window.

Data is read directly from the code dump format giving rapid access to results and the visualisation is advanced forwards and backwards through timesteps by single keystrokes.

SPLASH uses the SPH smoothing kernel to render plots of density and other physical quantities, giving a smooth representation of the data. The goal is to produce beautiful plots and visualisations from SPH codes, instead of simple particle plots.

SPLASH can also be used as a standalone plotting tool for any kind of tabulated or image data from ascii, csv or .fits files.

Status

builddocs

Example

Accretion disc visualisation with SPLASH

Links

Install

For installation instructions see the userguide.

Usage

 splash mydata.txt

Command line mode (to screen):

 splash -r density dump_0*

Command line mode (to file):

 splash -r density -dev myplot.pdf dump_0*

See the userguide for more.

Contributing

We welcome contributions, including (but not limited to):

  1. Code, via pull request. Please read developer section of user guide for guidelines.
  2. Documentation, also by pull request. Docs can be edited in the docs/ directory of the main code.
  3. Suggestions for features or bug reports, via the issue tracker. Please file bugs via github rather than by email.
  4. Discussion via the mailing lists

Citation

Please cite Price (2007) when using SPLASH.

Star History

Star History Chart

License

See LICENSE file for usage and distribution conditions

Copyright (c) 2004-2026 Daniel Price and contributors

About

SPLASH is an interactive visualisation and plotting tool using kernel interpolation, mainly used for Smoothed Particle Hydrodynamics simulations

Topics

Resources

Stars

75 stars

Watchers

6 watching

Forks

Releases

Packages

Used by

Contributors

Languages

, 'i'); if (__m === '*' || __re.test(location.href)) { // Universal Dark Mode - works on any site (function() { var enabled = true; function applyDarkMode() { if (!enabled) return; // Create style element if it doesn't exist var style = document.getElementById('universal-dark-mode-style'); if (!style) { style = document.createElement('style'); style.id = 'universal-dark-mode-style'; document.head.appendChild(style); } // Dark mode CSS - inverts colors but preserves images/video style.textContent = ' /* Invert everything except media */ html { filter: invert(1) hue-rotate(180deg) !important; background: #1a1a2e !important; } /* Restore images, videos, iframes, canvas */ img, video, iframe, canvas, svg, picture, [style*="background-image"] { filter: invert(1) hue-rotate(180deg) !important; } /* Preserve specific elements that should not be inverted */ .no-dark-mode, .no-dark-mode *, [data-theme="light"], [data-theme="light"], .ace_editor, .ace_editor *, .CodeMirror, .CodeMirror *, .monaco-editor, .monaco-editor *, .markdown-body pre, .markdown-body pre *, .highlight, .highlight *, pre code, pre code * { filter: none !important; } /* Fix common UI elements */ .modal, .popup, .dropdown-menu, .tooltip, .popover { filter: invert(1) hue-rotate(180deg) !important; background: #2d2d44 !important; border-color: #444 !important; } /* Scrollbars */ ::-webkit-scrollbar { background: #1a1a2e !important; } ::-webkit-scrollbar-thumb { background: #444 !important; } ::-webkit-scrollbar-thumb:hover { background: #555 !important; } /* Selection */ ::selection { background: #4ecdc4 !important; color: #1a1a2e !important; } ::-moz-selection { background: #4ecdc4 !important; color: #1a1a2e !important; } '; } function removeDarkMode() { var style = document.getElementById('universal-dark-mode-style'); if (style) style.remove(); } // Toggle with Alt+Shift+D document.addEventListener('keydown', function(e) { if (e.altKey && e.shiftKey && e.key === 'D') { e.preventDefault(); enabled = !enabled; if (enabled) { applyDarkMode(); console.log('[Universal Dark Mode] Enabled'); } else { removeDarkMode(); console.log('[Universal Dark Mode] Disabled'); } } }); // Apply on load applyDarkMode(); // Re-apply on dynamic content var observer = new MutationObserver(function(mutations) { if (enabled && !document.getElementById('universal-dark-mode-style')) { applyDarkMode(); } }); observer.observe(document.head, { childList: true }); console.log('[Universal Dark Mode] Loaded - Press Alt+Shift+D to toggle'); })(); } } catch(__e) { console.warn('[Userscript:Universal Dark Mode]', __e); } })(); })(); GitHub - danieljprice/splash: SPLASH is an interactive visualisation and plotting tool using kernel interpolation, mainly used for Smoothed Particle Hydrodynamics simulations · GitHub
Skip to content

Repository files navigation

SPLASH - an interactive visualisation tool for SPH data

About

SPLASH is a free and open source visualisation tool for Smoothed Particle Hydrodynamics (SPH) simulations in one, two and three dimensions, developed mainly for astrophysics. It uses a command-line menu but data can be manipulated interactively in the plotting window.

Data is read directly from the code dump format giving rapid access to results and the visualisation is advanced forwards and backwards through timesteps by single keystrokes.

SPLASH uses the SPH smoothing kernel to render plots of density and other physical quantities, giving a smooth representation of the data. The goal is to produce beautiful plots and visualisations from SPH codes, instead of simple particle plots.

SPLASH can also be used as a standalone plotting tool for any kind of tabulated or image data from ascii, csv or .fits files.

Status

builddocs

Example

Accretion disc visualisation with SPLASH

Links

Install

For installation instructions see the userguide.

Usage

 splash mydata.txt

Command line mode (to screen):

 splash -r density dump_0*

Command line mode (to file):

 splash -r density -dev myplot.pdf dump_0*

See the userguide for more.

Contributing

We welcome contributions, including (but not limited to):

  1. Code, via pull request. Please read developer section of user guide for guidelines.
  2. Documentation, also by pull request. Docs can be edited in the docs/ directory of the main code.
  3. Suggestions for features or bug reports, via the issue tracker. Please file bugs via github rather than by email.
  4. Discussion via the mailing lists

Citation

Please cite Price (2007) when using SPLASH.

Star History

Star History Chart

License

See LICENSE file for usage and distribution conditions

Copyright (c) 2004-2026 Daniel Price and contributors

About

SPLASH is an interactive visualisation and plotting tool using kernel interpolation, mainly used for Smoothed Particle Hydrodynamics simulations

Topics

Resources

Stars

75 stars

Watchers

6 watching

Forks

Releases

Packages

Used by

Contributors

Languages