
A developer tool that supercharges
debugby routing logs over UDP and visualizing them in a multi-pane CLI interface.
splitlog helps separate and monitor logs from multiple services or modules with ease by using logical channels, dynamic port mapping, and structured JSON output.
Tiny Logging Library
Pipe logs over UDP with ease, from anydebuglogger.CLI Log Monitor
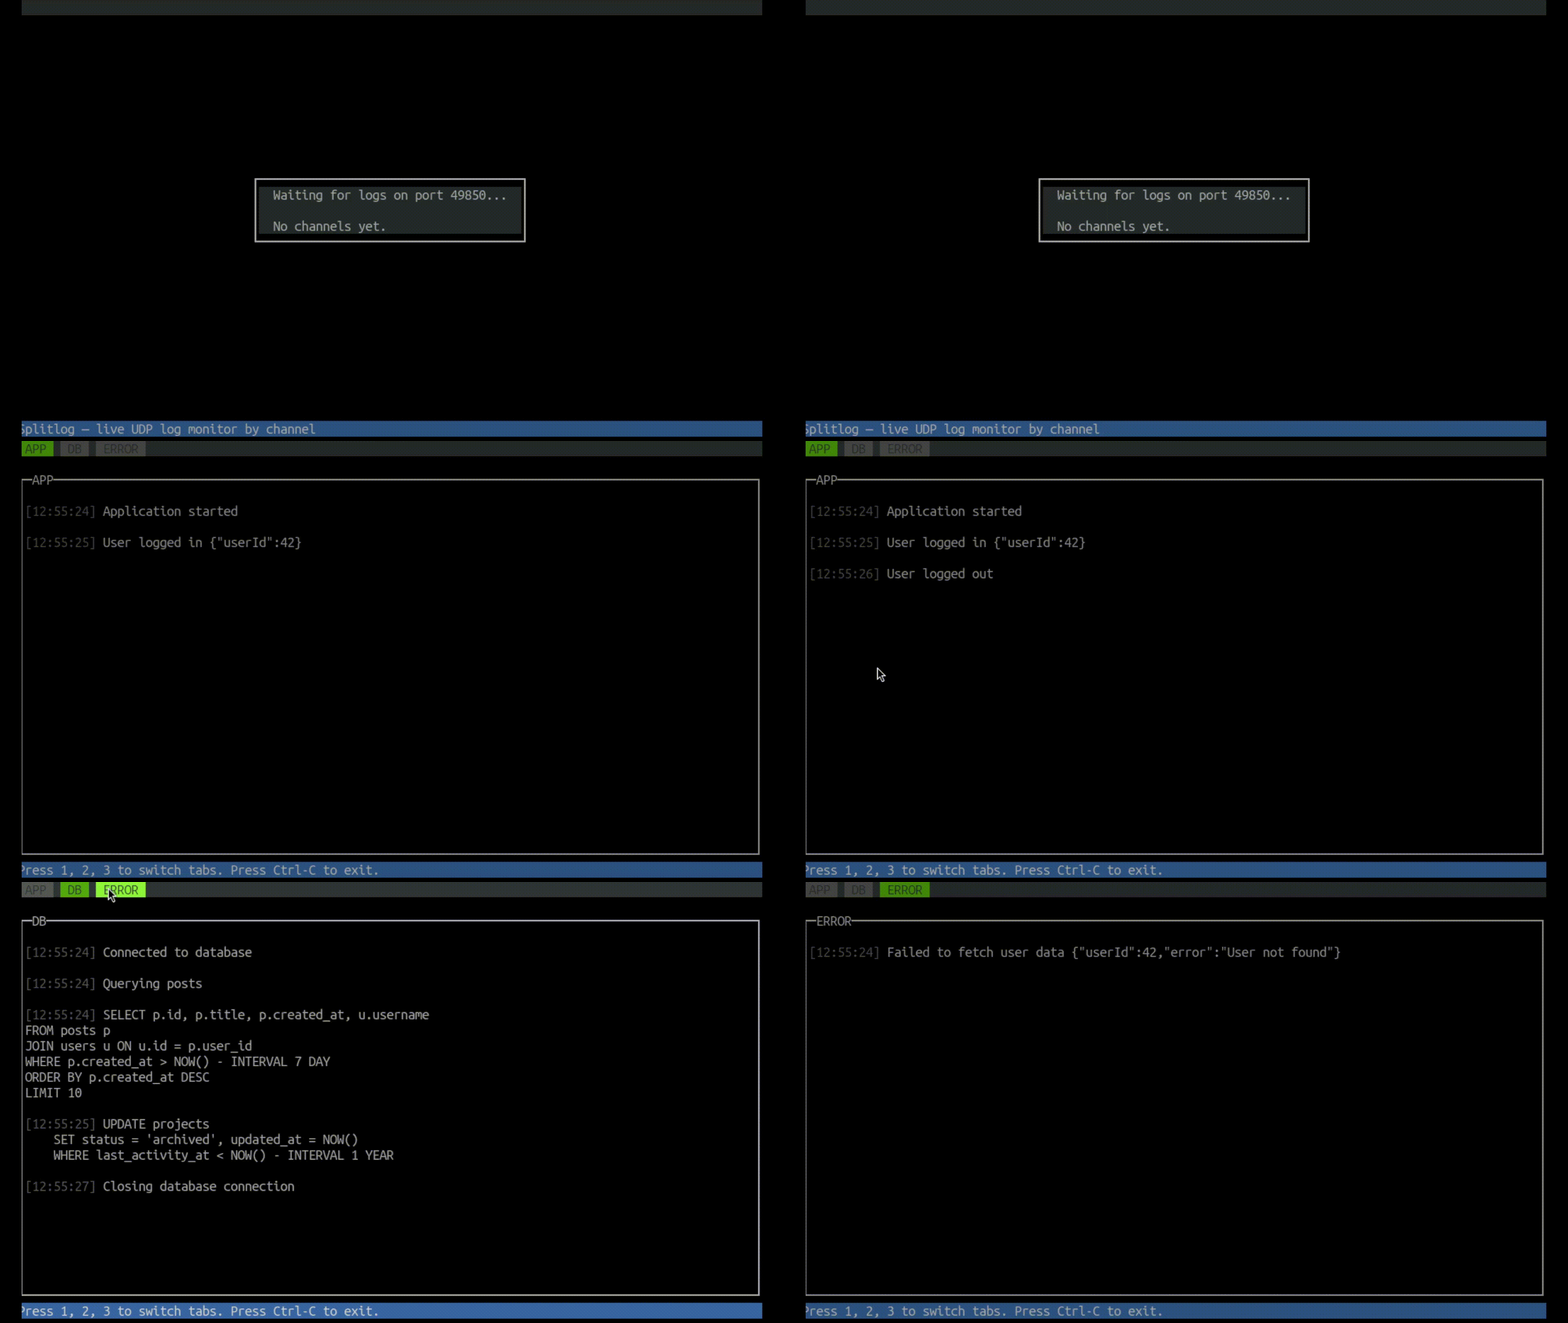
Real-time multi-tab terminal UI usingblessed, showing logs per channel.Channel Registry
Auto-discovers ports via a naming registry (/tmp/splitlog_channel), so clients don’t need to know port info up front.JSON Mode
Supports structured logging for better parsing and formatting.
- 🧩 Multi-service debugging
- 🔀 Frontend/backend log separation
- 🧹 Cleaner, isolated dev environments
- 🧪 Live observation of microservices or workers
npm install -g @dsheiko/splitlogStart a UDP listener and terminal UI for logs:
splitlog-p, --port <number> UDP port to listen on (defaults to first available port)The CLI will automatically:
- Start a UDP listener
- Register the port in
/tmp/splitlog_channel - Show logs grouped by channels in separate panes
importdebugfrom"debug";importsplitlogfrom"@dsheiko/splitlog";constlogApp=splitlog(debug("APP"));constlogDb=splitlog(debug("DB"));constlogError=splitlog(debug("ERROR"));logApp("Application started");logDb("Connected to database");logError("Failed to fetch user data",{userId: 42,error: "User not found"});splitlog(debugNamespaceLogger: Function,options?: {port?: number,host?: string}): FunctionIf no options are provided, the logger reads the current listener port from /tmp/splitlog_channel.
PRs welcome! If you want to suggest a feature or report a bug, please open an issue.