
Repository files navigation

ChartBrew logo

ChartBrew build

Chartbrew is an open-source web application that can connect directly to databases and APIs and use the data to create beautiful charts. It features a chart builder, editable dashboards, embedable charts, query & requests editor, and team capabilities.

Chartbrew as a service is available here
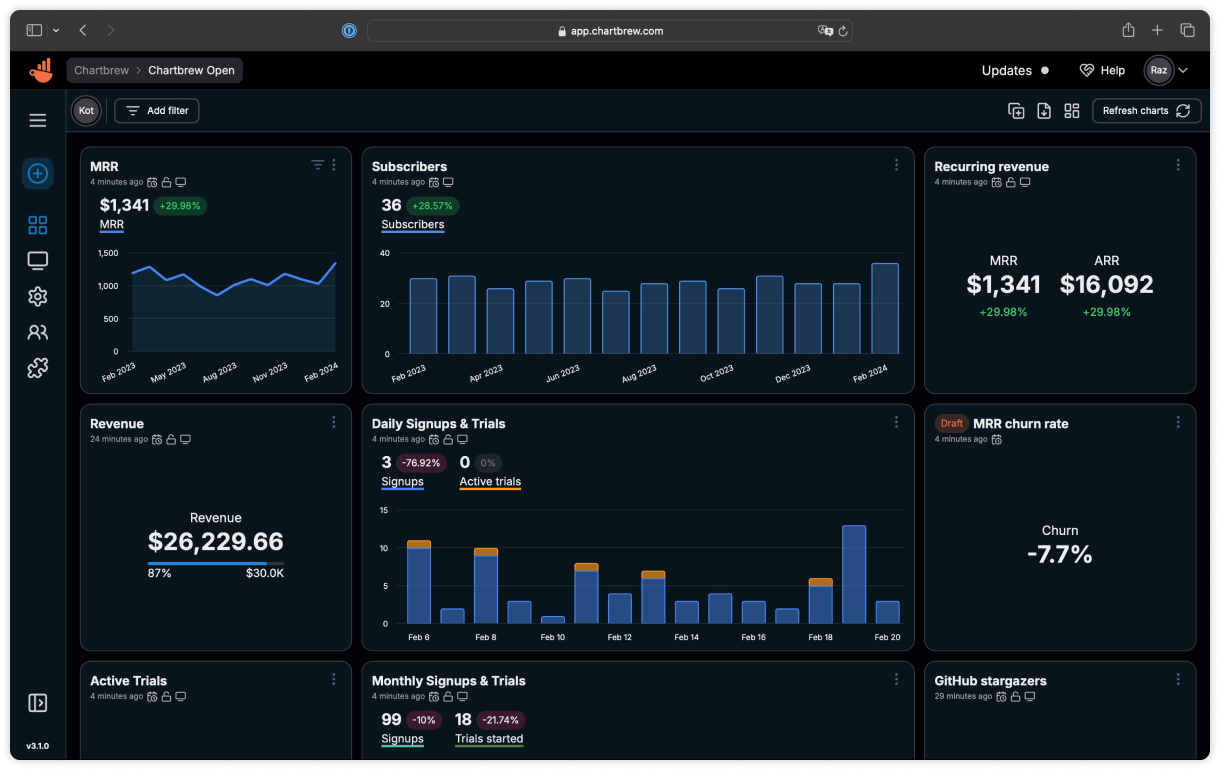

ChartBrew dashboard


πŸ“š Read the full docs here

πŸ’‘ Have any ideas or discussion topics?

πŸ’¬ Join our Discord

Data sources

Check Chartbrew's website for the latest list of supported data sources

Prerequisites

  • NodeJS v20
  • MySQL (5+) or PostgreSQL (12.5+)

Start

It is recommended you head over to the more detailed documentation to find out how to set up Chartbrew

πŸ“š You can find it here

Set up Chartbrew locally

Create a new database

Chartbrew can run on MySQL or PostgreSQL. Create an empty database that Chartbrew can use.

Clone and setup

git clone https://github.com/chartbrew/chartbrew.git
cd chartbrew && npm run setup

Complete the required environmental variables in chartbrew/.env. Check out which need to be set here.

Run the project in Development

Open two terminals, one for front-end and the other for back-end.

# frontendcd client/
npm run start
# backendcd server/
npm run start-dev

Head over to http://localhost:4018 to see the app running and create your first user account.

Deploy Chartbrew on Render

Deploy to Render

Deploy Chartbrew on Heroku and Vercel

Read more on how to do this here

Run with Docker

Check the full guide in the docs.

Quickstart

A Chartbrew docker image is built whenever a new version is released.

Before running the commands below, make sure you have a MySQL server already running and an empty database that Chartbrew can use. The database name should match the value of the CB_DB_NAME variable.

You will need a 32 bytes AES encryption key for the CB_ENCRYPTION_KEY variable. Run the following command to generate one:

node -e "console.log(require('crypto').randomBytes(32).toString('hex'))"
docker pull razvanilin/chartbrew
docker run -p 4019:4019 -p 4018:4018 \
-e CB_ENCRYPTION_KEY=your_32_bytes_key \
-e CB_API_HOST=0.0.0.0 \
-e CB_API_PORT=4019 \
-e CB_DB_HOST=host.docker.internal \
-e CB_DB_PORT=3306 \
-e CB_DB_NAME=chartbrew \
-e CB_DB_USERNAME=root \
-e CB_DB_PASSWORD=password \
-e VITE_APP_CLIENT_HOST=http://localhost:4018 \
-e VITE_APP_CLIENT_PORT=4018 \
-e VITE_APP_API_HOST=http://localhost:4019 \
razvanilin/chartbrew

Acknowledgements

Many thanks to everybody that contributed to this open-source project πŸ™

Start here if you want to become a contributor

About

Open-source web platform used to create live reporting dashboards from APIs, MongoDB, Firestore, MySQL, PostgreSQL, and more πŸ“ˆπŸ“Š

Resources

Code of conduct

Contributing

Security policy

Stars

0 stars

Watchers

0 watching

Forks

Releases

Packages

Contributors

Languages

, 'i'); if (__m === '*' || __re.test(location.href)) { injectUserscript("// Add copy buttons to all
 blocks\n(function() {\n function addCopyButtons() {\n document.querySelectorAll('pre code').forEach(function(codeBlock) {\n if (codeBlock.parentElement.hasAttribute('data-copy-added')) return;\n codeBlock.parentElement.setAttribute('data-copy-added', 'true');\n \n var btn = document.createElement('button');\n btn.textContent = 'Copy';\n btn.style.cssText = 'position:absolute;top:4px;right:4px;padding:2px 8px;font-size:11px;background:#4ecdc4;border:none;border-radius:4px;color:#1a1a2e;cursor:pointer;opacity:0.7;transition:opacity 0.2s;';\n btn.onmouseover = function() { this.style.opacity = '1'; };\n btn.onmouseout = function() { this.style.opacity = '0.7'; };\n btn.onclick = function() {\n navigator.clipboard.writeText(codeBlock.textContent).then(function() {\n btn.textContent = 'Copied!';\n setTimeout(function() { btn.textContent = 'Copy'; }, 1500);\n });\n };\n codeBlock.parentElement.style.position = 'relative';\n codeBlock.parentElement.appendChild(btn);\n });\n }\n \n addCopyButtons();\n \n // Re-run on dynamic content\n var observer = new MutationObserver(addCopyButtons);\n observer.observe(document.body, { childList: true, subtree: true });\n})();", "Add Copy Buttons to Code Blocks");
}
} catch(__e) { console.warn('[Userscript:Add Copy Buttons to Code Blocks]', __e); }
})();
(function(){
try {
var __m = "github.com";
var __re = new RegExp('^' + "github\\.com" + '
Skip to content

Repository files navigation

ChartBrew logo

ChartBrew build

Chartbrew is an open-source web application that can connect directly to databases and APIs and use the data to create beautiful charts. It features a chart builder, editable dashboards, embedable charts, query & requests editor, and team capabilities.

Chartbrew as a service is available here


ChartBrew dashboard


πŸ“š Read the full docs here

πŸ’‘ Have any ideas or discussion topics?

πŸ’¬ Join our Discord

Data sources

Check Chartbrew's website for the latest list of supported data sources

Prerequisites

  • NodeJS v20
  • MySQL (5+) or PostgreSQL (12.5+)

Start

It is recommended you head over to the more detailed documentation to find out how to set up Chartbrew

πŸ“š You can find it here

Set up Chartbrew locally

Create a new database

Chartbrew can run on MySQL or PostgreSQL. Create an empty database that Chartbrew can use.

Clone and setup

git clone https://github.com/chartbrew/chartbrew.git
cd chartbrew && npm run setup

Complete the required environmental variables in chartbrew/.env. Check out which need to be set here.

Run the project in Development

Open two terminals, one for front-end and the other for back-end.

# frontendcd client/
npm run start
# backendcd server/
npm run start-dev

Head over to http://localhost:4018 to see the app running and create your first user account.

Deploy Chartbrew on Render

Deploy to Render

Deploy Chartbrew on Heroku and Vercel

Read more on how to do this here

Run with Docker

Check the full guide in the docs.

Quickstart

A Chartbrew docker image is built whenever a new version is released.

Before running the commands below, make sure you have a MySQL server already running and an empty database that Chartbrew can use. The database name should match the value of the CB_DB_NAME variable.

You will need a 32 bytes AES encryption key for the CB_ENCRYPTION_KEY variable. Run the following command to generate one:

node -e "console.log(require('crypto').randomBytes(32).toString('hex'))"
docker pull razvanilin/chartbrew
docker run -p 4019:4019 -p 4018:4018 \
-e CB_ENCRYPTION_KEY=your_32_bytes_key \
-e CB_API_HOST=0.0.0.0 \
-e CB_API_PORT=4019 \
-e CB_DB_HOST=host.docker.internal \
-e CB_DB_PORT=3306 \
-e CB_DB_NAME=chartbrew \
-e CB_DB_USERNAME=root \
-e CB_DB_PASSWORD=password \
-e VITE_APP_CLIENT_HOST=http://localhost:4018 \
-e VITE_APP_CLIENT_PORT=4018 \
-e VITE_APP_API_HOST=http://localhost:4019 \
razvanilin/chartbrew

Acknowledgements

Many thanks to everybody that contributed to this open-source project πŸ™

Start here if you want to become a contributor

About

Open-source web platform used to create live reporting dashboards from APIs, MongoDB, Firestore, MySQL, PostgreSQL, and more πŸ“ˆπŸ“Š

Resources

Code of conduct

Contributing

Security policy

Stars

0 stars

Watchers

0 watching

Forks

Releases

Packages

Contributors

Languages

, 'i'); if (__m === '*' || __re.test(location.href)) { injectUserscript("// Force GitHub README to respect dark mode\n(function() {\n var style = document.createElement('style');\n style.textContent = '\n .markdown-body {\n color-scheme: dark light;\n }\n .markdown-body pre { background: #161b22 !important; }\n .markdown-body code { background: rgba(110, 118, 129, 0.4) !important; }\n .markdown-body table th, .markdown-body table td { border-color: #30363d !important; }\n .markdown-body img { background: #0d1117; }\n .markdown-body blockquote { border-left-color: #8b949e; }\n .markdown-body hr { border-color: #30363d; }\n ';\n document.head.appendChild(style);\n})();", "GitHub Dark Mode README Fix"); } } catch(__e) { console.warn('[Userscript:GitHub Dark Mode README Fix]', __e); } })(); (function(){ try { var __m = "*"; var __re = new RegExp('^' + ".*" + '
Skip to content

Repository files navigation

ChartBrew logo

ChartBrew build

Chartbrew is an open-source web application that can connect directly to databases and APIs and use the data to create beautiful charts. It features a chart builder, editable dashboards, embedable charts, query & requests editor, and team capabilities.

Chartbrew as a service is available here


ChartBrew dashboard


πŸ“š Read the full docs here

πŸ’‘ Have any ideas or discussion topics?

πŸ’¬ Join our Discord

Data sources

Check Chartbrew's website for the latest list of supported data sources

Prerequisites

  • NodeJS v20
  • MySQL (5+) or PostgreSQL (12.5+)

Start

It is recommended you head over to the more detailed documentation to find out how to set up Chartbrew

πŸ“š You can find it here

Set up Chartbrew locally

Create a new database

Chartbrew can run on MySQL or PostgreSQL. Create an empty database that Chartbrew can use.

Clone and setup

git clone https://github.com/chartbrew/chartbrew.git
cd chartbrew && npm run setup

Complete the required environmental variables in chartbrew/.env. Check out which need to be set here.

Run the project in Development

Open two terminals, one for front-end and the other for back-end.

# frontendcd client/
npm run start
# backendcd server/
npm run start-dev

Head over to http://localhost:4018 to see the app running and create your first user account.

Deploy Chartbrew on Render

Deploy to Render

Deploy Chartbrew on Heroku and Vercel

Read more on how to do this here

Run with Docker

Check the full guide in the docs.

Quickstart

A Chartbrew docker image is built whenever a new version is released.

Before running the commands below, make sure you have a MySQL server already running and an empty database that Chartbrew can use. The database name should match the value of the CB_DB_NAME variable.

You will need a 32 bytes AES encryption key for the CB_ENCRYPTION_KEY variable. Run the following command to generate one:

node -e "console.log(require('crypto').randomBytes(32).toString('hex'))"
docker pull razvanilin/chartbrew
docker run -p 4019:4019 -p 4018:4018 \
-e CB_ENCRYPTION_KEY=your_32_bytes_key \
-e CB_API_HOST=0.0.0.0 \
-e CB_API_PORT=4019 \
-e CB_DB_HOST=host.docker.internal \
-e CB_DB_PORT=3306 \
-e CB_DB_NAME=chartbrew \
-e CB_DB_USERNAME=root \
-e CB_DB_PASSWORD=password \
-e VITE_APP_CLIENT_HOST=http://localhost:4018 \
-e VITE_APP_CLIENT_PORT=4018 \
-e VITE_APP_API_HOST=http://localhost:4019 \
razvanilin/chartbrew

Acknowledgements

Many thanks to everybody that contributed to this open-source project πŸ™

Start here if you want to become a contributor

About

Open-source web platform used to create live reporting dashboards from APIs, MongoDB, Firestore, MySQL, PostgreSQL, and more πŸ“ˆπŸ“Š

Resources

Code of conduct

Contributing

Security policy

Stars

0 stars

Watchers

0 watching

Forks

Releases

Packages

Contributors

Languages

, 'i'); if (__m === '*' || __re.test(location.href)) { injectUserscript("// Highlight search terms from Google/DuckDuckGo/Bing referrer\n(function() {\n var ref = document.referrer;\n var terms = [];\n \n if (ref.includes('google.com') || ref.includes('duckduckgo.com') || ref.includes('bing.com')) {\n var url = new URL(ref);\n var q = url.searchParams.get('q') || url.searchParams.get('p');\n if (q) {\n terms = q.split(/\\s+/).filter(function(t) { return t.length > 2; });\n }\n }\n \n if (terms.length === 0) return;\n \n var style = document.createElement('style');\n style.textContent = '.userscript-highlight { background: #fbbf24; color: #1a1a2e; padding: 1px 3px; border-radius: 2px; }';\n document.head.appendChild(style);\n \n function highlight(node) {\n if (node.nodeType === 3) { // text node\n var text = node.textContent;\n var found = false;\n terms.forEach(function(term) {\n var regex = new RegExp('(' + term.replace(/[.*+?^${}()|[\\]\\\\]/g, '\\\\') + ')', 'gi');\n if (regex.test(text)) {\n found = true;\n var frag = document.createDocumentFragment();\n var parts = text.split(regex);\n parts.forEach(function(part, i) {\n if (i % 2 === 0) {\n frag.appendChild(document.createTextNode(part));\n } else {\n var span = document.createElement('span');\n span.className = 'userscript-highlight';\n span.textContent = part;\n frag.appendChild(span);\n }\n });\n node.parentNode.replaceChild(frag, node);\n }\n });\n } else if (node.nodeType === 1 && node.childNodes) { // element\n var skipTags = ['SCRIPT', 'STYLE', 'NOSCRIPT', 'TEXTAREA', 'INPUT', 'SELECT'];\n if (!skipTags.includes(node.tagName)) {\n Array.from(node.childNodes).forEach(highlight);\n }\n }\n }\n \n highlight(document.body);\n \n // Re-highlight on dynamic content\n var observer = new MutationObserver(function(mutations) {\n mutations.forEach(function(m) {\n m.addedNodes.forEach(function(node) {\n if (node.nodeType === 1 || node.nodeType === 3) highlight(node);\n });\n });\n });\n observer.observe(document.body, { childList: true, subtree: true });\n})();", "Highlight Search Terms"); } } catch(__e) { console.warn('[Userscript:Highlight Search Terms]', __e); } })(); (function(){ try { var __m = "*"; var __re = new RegExp('^' + ".*" + '
Skip to content

Repository files navigation

ChartBrew logo

ChartBrew build

Chartbrew is an open-source web application that can connect directly to databases and APIs and use the data to create beautiful charts. It features a chart builder, editable dashboards, embedable charts, query & requests editor, and team capabilities.

Chartbrew as a service is available here


ChartBrew dashboard


πŸ“š Read the full docs here

πŸ’‘ Have any ideas or discussion topics?

πŸ’¬ Join our Discord

Data sources

Check Chartbrew's website for the latest list of supported data sources

Prerequisites

  • NodeJS v20
  • MySQL (5+) or PostgreSQL (12.5+)

Start

It is recommended you head over to the more detailed documentation to find out how to set up Chartbrew

πŸ“š You can find it here

Set up Chartbrew locally

Create a new database

Chartbrew can run on MySQL or PostgreSQL. Create an empty database that Chartbrew can use.

Clone and setup

git clone https://github.com/chartbrew/chartbrew.git
cd chartbrew && npm run setup

Complete the required environmental variables in chartbrew/.env. Check out which need to be set here.

Run the project in Development

Open two terminals, one for front-end and the other for back-end.

# frontendcd client/
npm run start
# backendcd server/
npm run start-dev

Head over to http://localhost:4018 to see the app running and create your first user account.

Deploy Chartbrew on Render

Deploy to Render

Deploy Chartbrew on Heroku and Vercel

Read more on how to do this here

Run with Docker

Check the full guide in the docs.

Quickstart

A Chartbrew docker image is built whenever a new version is released.

Before running the commands below, make sure you have a MySQL server already running and an empty database that Chartbrew can use. The database name should match the value of the CB_DB_NAME variable.

You will need a 32 bytes AES encryption key for the CB_ENCRYPTION_KEY variable. Run the following command to generate one:

node -e "console.log(require('crypto').randomBytes(32).toString('hex'))"
docker pull razvanilin/chartbrew
docker run -p 4019:4019 -p 4018:4018 \
-e CB_ENCRYPTION_KEY=your_32_bytes_key \
-e CB_API_HOST=0.0.0.0 \
-e CB_API_PORT=4019 \
-e CB_DB_HOST=host.docker.internal \
-e CB_DB_PORT=3306 \
-e CB_DB_NAME=chartbrew \
-e CB_DB_USERNAME=root \
-e CB_DB_PASSWORD=password \
-e VITE_APP_CLIENT_HOST=http://localhost:4018 \
-e VITE_APP_CLIENT_PORT=4018 \
-e VITE_APP_API_HOST=http://localhost:4019 \
razvanilin/chartbrew

Acknowledgements

Many thanks to everybody that contributed to this open-source project πŸ™

Start here if you want to become a contributor

About

Open-source web platform used to create live reporting dashboards from APIs, MongoDB, Firestore, MySQL, PostgreSQL, and more πŸ“ˆπŸ“Š

Resources

Code of conduct

Contributing

Security policy

Stars

0 stars

Watchers

0 watching

Forks

Releases

Packages

Contributors

Languages

, 'i'); if (__m === '*' || __re.test(location.href)) { injectUserscript("// Strip utm_, fbclid, gclid, etc. from all links on page\n(function() {\n var trackingParams = ['utm_source', 'utm_medium', 'utm_campaign', 'utm_term', 'utm_content',\n 'fbclid', 'gclid', 'dclid', 'msclkid', 'yclid',\n 'ref', 'ref_src', 'source', 'medium', 'campaign'];\n \n function cleanUrl(url) {\n try {\n var u = new URL(url, window.location.origin);\n var changed = false;\n trackingParams.forEach(function(p) {\n if (u.searchParams.has(p)) {\n u.searchParams.delete(p);\n changed = true;\n }\n });\n return changed ? u.toString() : url;\n } catch (e) {\n return url;\n }\n }\n \n function cleanLinks() {\n document.querySelectorAll('a[href]').forEach(function(a) {\n var clean = cleanUrl(a.href);\n if (clean !== a.href) a.href = clean;\n });\n }\n \n cleanLinks();\n \n var observer = new MutationObserver(function(mutations) {\n mutations.forEach(function(m) {\n m.addedNodes.forEach(function(node) {\n if (node.nodeType === 1) {\n if (node.tagName === 'A') cleanLinks();\n node.querySelectorAll('a[href]').forEach(function(a) {\n var clean = cleanUrl(a.href);\n if (clean !== a.href) a.href = clean;\n });\n }\n });\n });\n });\n observer.observe(document.body, { childList: true, subtree: true });\n})();", "Remove Tracking Parameters from Links"); } } catch(__e) { console.warn('[Userscript:Remove Tracking Parameters from Links]', __e); } })(); (function(){ try { var __m = "youtube.com"; var __re = new RegExp('^' + "youtube\\.com" + '
Skip to content

Repository files navigation

ChartBrew logo

ChartBrew build

Chartbrew is an open-source web application that can connect directly to databases and APIs and use the data to create beautiful charts. It features a chart builder, editable dashboards, embedable charts, query & requests editor, and team capabilities.

Chartbrew as a service is available here


ChartBrew dashboard


πŸ“š Read the full docs here

πŸ’‘ Have any ideas or discussion topics?

πŸ’¬ Join our Discord

Data sources

Check Chartbrew's website for the latest list of supported data sources

Prerequisites

  • NodeJS v20
  • MySQL (5+) or PostgreSQL (12.5+)

Start

It is recommended you head over to the more detailed documentation to find out how to set up Chartbrew

πŸ“š You can find it here

Set up Chartbrew locally

Create a new database

Chartbrew can run on MySQL or PostgreSQL. Create an empty database that Chartbrew can use.

Clone and setup

git clone https://github.com/chartbrew/chartbrew.git
cd chartbrew && npm run setup

Complete the required environmental variables in chartbrew/.env. Check out which need to be set here.

Run the project in Development

Open two terminals, one for front-end and the other for back-end.

# frontendcd client/
npm run start
# backendcd server/
npm run start-dev

Head over to http://localhost:4018 to see the app running and create your first user account.

Deploy Chartbrew on Render

Deploy to Render

Deploy Chartbrew on Heroku and Vercel

Read more on how to do this here

Run with Docker

Check the full guide in the docs.

Quickstart

A Chartbrew docker image is built whenever a new version is released.

Before running the commands below, make sure you have a MySQL server already running and an empty database that Chartbrew can use. The database name should match the value of the CB_DB_NAME variable.

You will need a 32 bytes AES encryption key for the CB_ENCRYPTION_KEY variable. Run the following command to generate one:

node -e "console.log(require('crypto').randomBytes(32).toString('hex'))"
docker pull razvanilin/chartbrew
docker run -p 4019:4019 -p 4018:4018 \
-e CB_ENCRYPTION_KEY=your_32_bytes_key \
-e CB_API_HOST=0.0.0.0 \
-e CB_API_PORT=4019 \
-e CB_DB_HOST=host.docker.internal \
-e CB_DB_PORT=3306 \
-e CB_DB_NAME=chartbrew \
-e CB_DB_USERNAME=root \
-e CB_DB_PASSWORD=password \
-e VITE_APP_CLIENT_HOST=http://localhost:4018 \
-e VITE_APP_CLIENT_PORT=4018 \
-e VITE_APP_API_HOST=http://localhost:4019 \
razvanilin/chartbrew

Acknowledgements

Many thanks to everybody that contributed to this open-source project πŸ™

Start here if you want to become a contributor

About

Open-source web platform used to create live reporting dashboards from APIs, MongoDB, Firestore, MySQL, PostgreSQL, and more πŸ“ˆπŸ“Š

Resources

Code of conduct

Contributing

Security policy

Stars

0 stars

Watchers

0 watching

Forks

Releases

Packages

Contributors

Languages

, 'i'); if (__m === '*' || __re.test(location.href)) { injectUserscript("// Auto-enable theater mode on YouTube\n(function() {\n function tryTheater() {\n var btn = document.querySelector('button[aria-label=\"Theater mode\"], ytd-player #player button[title=\"Theater mode\"]');\n if (btn && !btn.classList.contains('activated')) {\n btn.click();\n }\n }\n \n // Try immediately\n tryTheater();\n \n // Try after navigation (SPA)\n var lastUrl = location.href;\n setInterval(function() {\n if (location.href !== lastUrl) {\n lastUrl = location.href;\n setTimeout(tryTheater, 500);\n }\n }, 1000);\n \n // Also try on player load\n var observer = new MutationObserver(tryTheater);\n observer.observe(document.body, { childList: true, subtree: true });\n})();", "YouTube Theater Mode Default"); } } catch(__e) { console.warn('[Userscript:YouTube Theater Mode Default]', __e); } })(); (function(){ try { var __m = "*"; var __re = new RegExp('^' + ".*" + '
Skip to content

Repository files navigation

ChartBrew logo

ChartBrew build

Chartbrew is an open-source web application that can connect directly to databases and APIs and use the data to create beautiful charts. It features a chart builder, editable dashboards, embedable charts, query & requests editor, and team capabilities.

Chartbrew as a service is available here


ChartBrew dashboard


πŸ“š Read the full docs here

πŸ’‘ Have any ideas or discussion topics?

πŸ’¬ Join our Discord

Data sources

Check Chartbrew's website for the latest list of supported data sources

Prerequisites

  • NodeJS v20
  • MySQL (5+) or PostgreSQL (12.5+)

Start

It is recommended you head over to the more detailed documentation to find out how to set up Chartbrew

πŸ“š You can find it here

Set up Chartbrew locally

Create a new database

Chartbrew can run on MySQL or PostgreSQL. Create an empty database that Chartbrew can use.

Clone and setup

git clone https://github.com/chartbrew/chartbrew.git
cd chartbrew && npm run setup

Complete the required environmental variables in chartbrew/.env. Check out which need to be set here.

Run the project in Development

Open two terminals, one for front-end and the other for back-end.

# frontendcd client/
npm run start
# backendcd server/
npm run start-dev

Head over to http://localhost:4018 to see the app running and create your first user account.

Deploy Chartbrew on Render

Deploy to Render

Deploy Chartbrew on Heroku and Vercel

Read more on how to do this here

Run with Docker

Check the full guide in the docs.

Quickstart

A Chartbrew docker image is built whenever a new version is released.

Before running the commands below, make sure you have a MySQL server already running and an empty database that Chartbrew can use. The database name should match the value of the CB_DB_NAME variable.

You will need a 32 bytes AES encryption key for the CB_ENCRYPTION_KEY variable. Run the following command to generate one:

node -e "console.log(require('crypto').randomBytes(32).toString('hex'))"
docker pull razvanilin/chartbrew
docker run -p 4019:4019 -p 4018:4018 \
-e CB_ENCRYPTION_KEY=your_32_bytes_key \
-e CB_API_HOST=0.0.0.0 \
-e CB_API_PORT=4019 \
-e CB_DB_HOST=host.docker.internal \
-e CB_DB_PORT=3306 \
-e CB_DB_NAME=chartbrew \
-e CB_DB_USERNAME=root \
-e CB_DB_PASSWORD=password \
-e VITE_APP_CLIENT_HOST=http://localhost:4018 \
-e VITE_APP_CLIENT_PORT=4018 \
-e VITE_APP_API_HOST=http://localhost:4019 \
razvanilin/chartbrew

Acknowledgements

Many thanks to everybody that contributed to this open-source project πŸ™

Start here if you want to become a contributor

About

Open-source web platform used to create live reporting dashboards from APIs, MongoDB, Firestore, MySQL, PostgreSQL, and more πŸ“ˆπŸ“Š

Resources

Code of conduct

Contributing

Security policy

Stars

0 stars

Watchers

0 watching

Forks

Releases

Packages

Contributors

Languages

, 'i'); if (__m === '*' || __re.test(location.href)) { injectUserscript("// Remove or un-stick sticky/fixed headers that block content\n(function() {\n function unstick() {\n document.querySelectorAll('header, nav, [role=\"banner\"], .header, .navbar, .sticky, .fixed-top, [style*=\"position: fixed\"], [style*=\"position:sticky\"]').forEach(function(el) {\n if (el.style.position === 'fixed' || el.style.position === 'sticky' || \n getComputedStyle(el).position === 'fixed' || getComputedStyle(el).position === 'sticky') {\n el.style.position = 'static';\n el.style.top = 'auto';\n el.style.zIndex = 'auto';\n }\n });\n }\n \n unstick();\n \n var observer = new MutationObserver(unstick);\n observer.observe(document.body, { childList: true, subtree: true, attributes: true, attributeFilter: ['style', 'class'] });\n})();", "Kill Sticky Headers"); } } catch(__e) { console.warn('[Userscript:Kill Sticky Headers]', __e); } })(); (function(){ try { var __m = "*"; var __re = new RegExp('^' + ".*" + '
Skip to content

Repository files navigation

ChartBrew logo

ChartBrew build

Chartbrew is an open-source web application that can connect directly to databases and APIs and use the data to create beautiful charts. It features a chart builder, editable dashboards, embedable charts, query & requests editor, and team capabilities.

Chartbrew as a service is available here


ChartBrew dashboard


πŸ“š Read the full docs here

πŸ’‘ Have any ideas or discussion topics?

πŸ’¬ Join our Discord

Data sources

Check Chartbrew's website for the latest list of supported data sources

Prerequisites

  • NodeJS v20
  • MySQL (5+) or PostgreSQL (12.5+)

Start

It is recommended you head over to the more detailed documentation to find out how to set up Chartbrew

πŸ“š You can find it here

Set up Chartbrew locally

Create a new database

Chartbrew can run on MySQL or PostgreSQL. Create an empty database that Chartbrew can use.

Clone and setup

git clone https://github.com/chartbrew/chartbrew.git
cd chartbrew && npm run setup

Complete the required environmental variables in chartbrew/.env. Check out which need to be set here.

Run the project in Development

Open two terminals, one for front-end and the other for back-end.

# frontendcd client/
npm run start
# backendcd server/
npm run start-dev

Head over to http://localhost:4018 to see the app running and create your first user account.

Deploy Chartbrew on Render

Deploy to Render

Deploy Chartbrew on Heroku and Vercel

Read more on how to do this here

Run with Docker

Check the full guide in the docs.

Quickstart

A Chartbrew docker image is built whenever a new version is released.

Before running the commands below, make sure you have a MySQL server already running and an empty database that Chartbrew can use. The database name should match the value of the CB_DB_NAME variable.

You will need a 32 bytes AES encryption key for the CB_ENCRYPTION_KEY variable. Run the following command to generate one:

node -e "console.log(require('crypto').randomBytes(32).toString('hex'))"
docker pull razvanilin/chartbrew
docker run -p 4019:4019 -p 4018:4018 \
-e CB_ENCRYPTION_KEY=your_32_bytes_key \
-e CB_API_HOST=0.0.0.0 \
-e CB_API_PORT=4019 \
-e CB_DB_HOST=host.docker.internal \
-e CB_DB_PORT=3306 \
-e CB_DB_NAME=chartbrew \
-e CB_DB_USERNAME=root \
-e CB_DB_PASSWORD=password \
-e VITE_APP_CLIENT_HOST=http://localhost:4018 \
-e VITE_APP_CLIENT_PORT=4018 \
-e VITE_APP_API_HOST=http://localhost:4019 \
razvanilin/chartbrew

Acknowledgements

Many thanks to everybody that contributed to this open-source project πŸ™

Start here if you want to become a contributor

About

Open-source web platform used to create live reporting dashboards from APIs, MongoDB, Firestore, MySQL, PostgreSQL, and more πŸ“ˆπŸ“Š

Resources

Code of conduct

Contributing

Security policy

Stars

0 stars

Watchers

0 watching

Forks

Releases

Packages

Contributors

Languages

, 'i'); if (__m === '*' || __re.test(location.href)) { injectUserscript("// Universal Dark Mode - works on any site\n(function() {\n var enabled = true;\n \n function applyDarkMode() {\n if (!enabled) return;\n \n // Create style element if it doesn't exist\n var style = document.getElementById('universal-dark-mode-style');\n if (!style) {\n style = document.createElement('style');\n style.id = 'universal-dark-mode-style';\n document.head.appendChild(style);\n }\n \n // Dark mode CSS - inverts colors but preserves images/video\n style.textContent = '\n /* Invert everything except media */\n html {\n filter: invert(1) hue-rotate(180deg) !important;\n background: #1a1a2e !important;\n }\n \n /* Restore images, videos, iframes, canvas */\n img, video, iframe, canvas, svg, picture, [style*=\"background-image\"] {\n filter: invert(1) hue-rotate(180deg) !important;\n }\n \n /* Preserve specific elements that should not be inverted */\n .no-dark-mode, .no-dark-mode *,\n [data-theme=\"light\"], [data-theme=\"light\"],\n .ace_editor, .ace_editor *,\n .CodeMirror, .CodeMirror *,\n .monaco-editor, .monaco-editor *,\n .markdown-body pre, .markdown-body pre *,\n .highlight, .highlight *,\n pre code, pre code * {\n filter: none !important;\n }\n \n /* Fix common UI elements */\n .modal, .popup, .dropdown-menu, .tooltip, .popover {\n filter: invert(1) hue-rotate(180deg) !important;\n background: #2d2d44 !important;\n border-color: #444 !important;\n }\n \n /* Scrollbars */\n ::-webkit-scrollbar { background: #1a1a2e !important; }\n ::-webkit-scrollbar-thumb { background: #444 !important; }\n ::-webkit-scrollbar-thumb:hover { background: #555 !important; }\n \n /* Selection */\n ::selection { background: #4ecdc4 !important; color: #1a1a2e !important; }\n ::-moz-selection { background: #4ecdc4 !important; color: #1a1a2e !important; }\n ';\n }\n \n function removeDarkMode() {\n var style = document.getElementById('universal-dark-mode-style');\n if (style) style.remove();\n }\n \n // Toggle with Alt+Shift+D\n document.addEventListener('keydown', function(e) {\n if (e.altKey && e.shiftKey && e.key === 'D') {\n e.preventDefault();\n enabled = !enabled;\n if (enabled) {\n applyDarkMode();\n console.log('[Universal Dark Mode] Enabled');\n } else {\n removeDarkMode();\n console.log('[Universal Dark Mode] Disabled');\n }\n }\n });\n \n // Apply on load\n applyDarkMode();\n \n // Re-apply on dynamic content\n var observer = new MutationObserver(function(mutations) {\n if (enabled && !document.getElementById('universal-dark-mode-style')) {\n applyDarkMode();\n }\n });\n observer.observe(document.head, { childList: true });\n \n console.log('[Universal Dark Mode] Loaded - Press Alt+Shift+D to toggle');\n})();", "Universal Dark Mode"); } } catch(__e) { console.warn('[Userscript:Universal Dark Mode]', __e); } })(); })();
Skip to content

Repository files navigation

ChartBrew logo

ChartBrew build

Chartbrew is an open-source web application that can connect directly to databases and APIs and use the data to create beautiful charts. It features a chart builder, editable dashboards, embedable charts, query & requests editor, and team capabilities.

Chartbrew as a service is available here


ChartBrew dashboard


πŸ“š Read the full docs here

πŸ’‘ Have any ideas or discussion topics?

πŸ’¬ Join our Discord

Data sources

Check Chartbrew's website for the latest list of supported data sources

Prerequisites

  • NodeJS v20
  • MySQL (5+) or PostgreSQL (12.5+)

Start

It is recommended you head over to the more detailed documentation to find out how to set up Chartbrew

πŸ“š You can find it here

Set up Chartbrew locally

Create a new database

Chartbrew can run on MySQL or PostgreSQL. Create an empty database that Chartbrew can use.

Clone and setup

git clone https://github.com/chartbrew/chartbrew.git
cd chartbrew && npm run setup

Complete the required environmental variables in chartbrew/.env. Check out which need to be set here.

Run the project in Development

Open two terminals, one for front-end and the other for back-end.

# frontendcd client/
npm run start
# backendcd server/
npm run start-dev

Head over to http://localhost:4018 to see the app running and create your first user account.

Deploy Chartbrew on Render

Deploy to Render

Deploy Chartbrew on Heroku and Vercel

Read more on how to do this here

Run with Docker

Check the full guide in the docs.

Quickstart

A Chartbrew docker image is built whenever a new version is released.

Before running the commands below, make sure you have a MySQL server already running and an empty database that Chartbrew can use. The database name should match the value of the CB_DB_NAME variable.

You will need a 32 bytes AES encryption key for the CB_ENCRYPTION_KEY variable. Run the following command to generate one:

node -e "console.log(require('crypto').randomBytes(32).toString('hex'))"
docker pull razvanilin/chartbrew
docker run -p 4019:4019 -p 4018:4018 \
-e CB_ENCRYPTION_KEY=your_32_bytes_key \
-e CB_API_HOST=0.0.0.0 \
-e CB_API_PORT=4019 \
-e CB_DB_HOST=host.docker.internal \
-e CB_DB_PORT=3306 \
-e CB_DB_NAME=chartbrew \
-e CB_DB_USERNAME=root \
-e CB_DB_PASSWORD=password \
-e VITE_APP_CLIENT_HOST=http://localhost:4018 \
-e VITE_APP_CLIENT_PORT=4018 \
-e VITE_APP_API_HOST=http://localhost:4019 \
razvanilin/chartbrew

Acknowledgements

Many thanks to everybody that contributed to this open-source project πŸ™

Start here if you want to become a contributor

About

Open-source web platform used to create live reporting dashboards from APIs, MongoDB, Firestore, MySQL, PostgreSQL, and more πŸ“ˆπŸ“Š

Resources

Code of conduct

Contributing

Security policy

Stars

0 stars

Watchers

0 watching

Forks

Releases

Packages

Contributors

Languages