
Comprehensive resource management middleware for ASP.NET Core applications. Protect your application from overload with CPU limiting, memory limiting, gradual throttling, rate limiting, health checks, OpenTelemetry metrics, and a real-time dashboard.
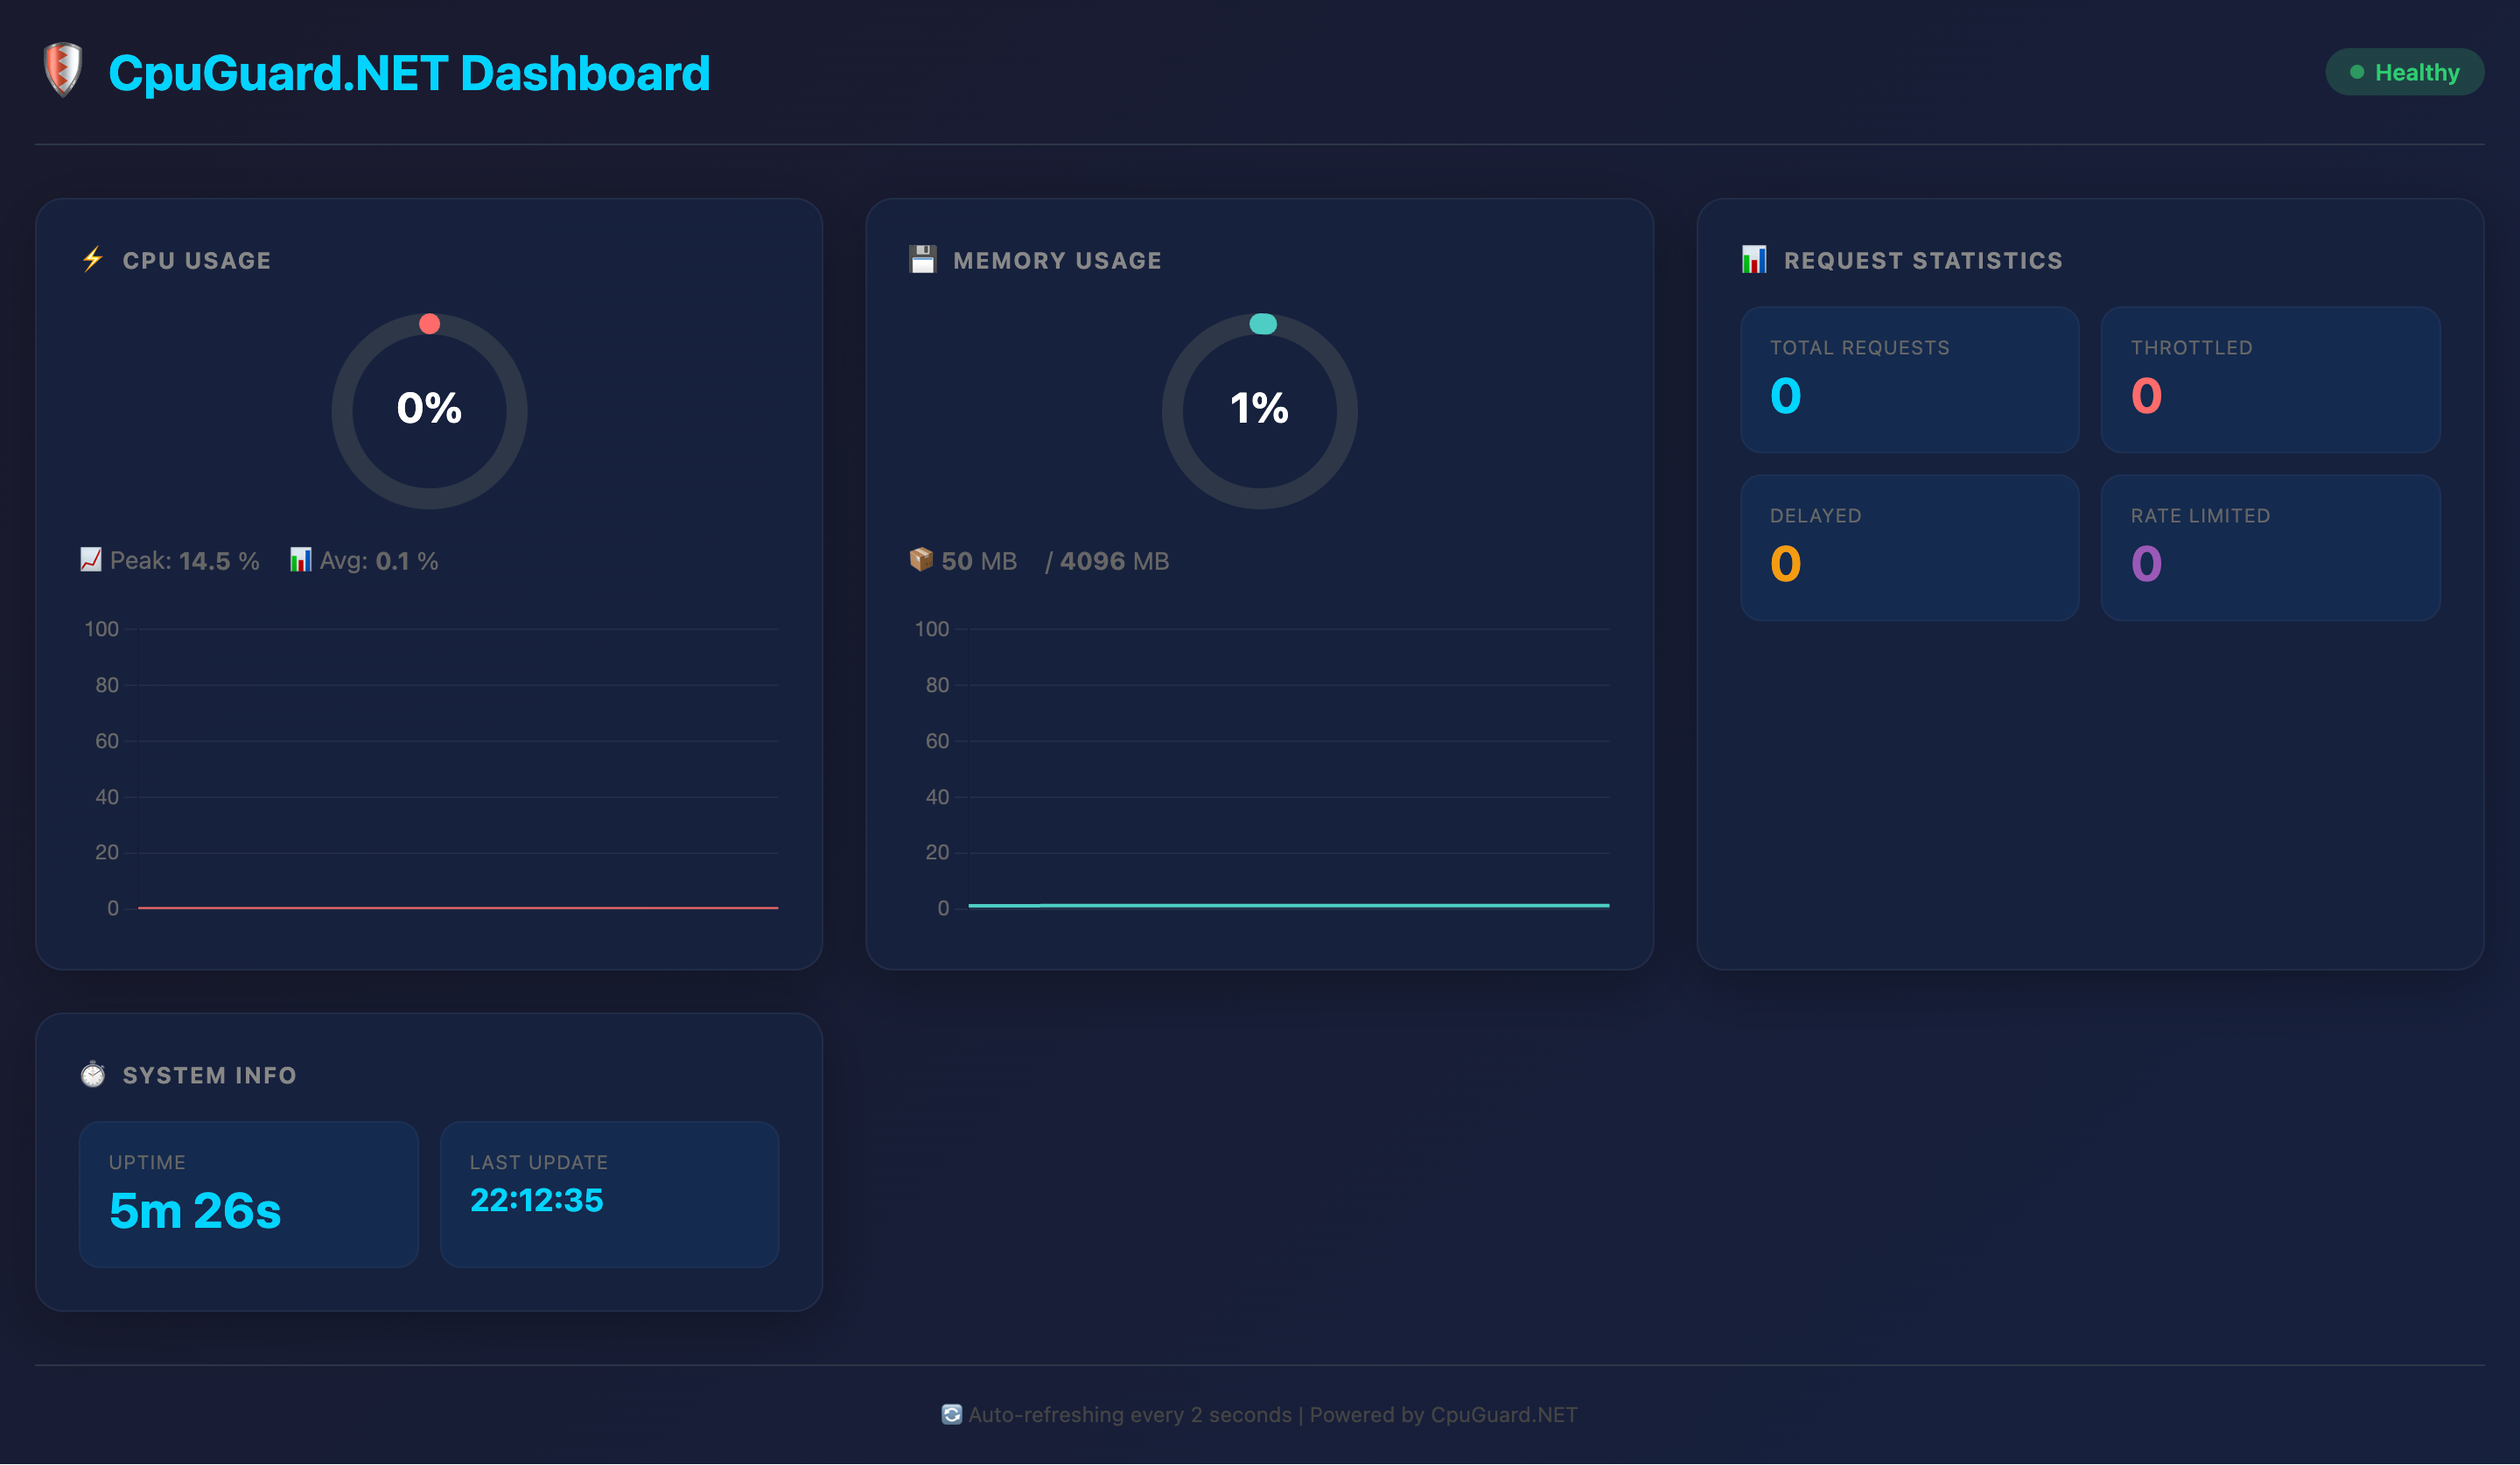
Real-time monitoring dashboard with CPU, Memory, Request Statistics, and System Info
- CPU Limiting - Monitor and limit CPU usage across your application
- Memory Limiting - Monitor and limit memory usage
- Gradual Throttling - Progressive request delays as resources increase
- Rate Limiting - Per-client request rate limiting with CPU-aware adjustments
- Health Checks - ASP.NET Core health check integration
- OpenTelemetry Metrics - Export metrics to Prometheus, Grafana, etc.
- Real-time Dashboard - Built-in HTML dashboard with live charts
- Custom Response Handlers - Customize throttled responses
- Event Callbacks - Subscribe to limit exceeded events
- Path Exclusions - Exclude specific endpoints from limiting
dotnet add package CpuGuard.NETusingCpuGuard.NET.Extensions;varbuilder=WebApplication.CreateBuilder(args);// Add CpuGuard servicesbuilder.Services.AddCpuGuard();varapp=builder.Build();// Use CpuGuard middlewareapp.UseCpuGuard();// Map dashboard and stats endpointsapp.MapCpuGuardEndpoints("/cpuguard");app.Run();Visit /cpuguard/dashboard to see the real-time monitoring dashboard.
builder.Services.AddCpuGuard(options =>{options.MaxCpuPercentage=80.0;options.ResponseStatusCode=503;options.ResponseMessage="Server is under heavy load.";// Exclude pathsoptions.ExcludedPaths.Add("/health");options.ExcludedPaths.Add("/cpuguard");// Subscribe to eventsoptions.OnCpuLimitExceeded+=(sender,args)=>{Console.WriteLine($"CPU limit exceeded: {args.CpuUsagePercentage}%");};// Custom response handleroptions.CustomResponseHandler=async(context,cpuUsage)=>{context.Response.ContentType="application/json";awaitcontext.Response.WriteAsync($"{{\"error\":\"CPU overload\",\"usage\":{cpuUsage}}}");};});builder.Services.AddMemoryGuard(options =>{options.MaxMemoryPercentage=85.0;options.UsePercentage=true;// or use MaxMemoryBytes for absolute limitoptions.OnMemoryLimitExceeded+=(sender,args)=>{Console.WriteLine($"Memory limit exceeded: {args.MemoryUsagePercentage}%");};});app.UseMemoryGuard();Instead of hard cutoffs, gradually delay requests as resources increase:
builder.Services.AddGradualThrottling(options =>{options.SoftLimitPercentage=60.0;// Start delayingoptions.HardLimitPercentage=90.0;// Reject requestsoptions.MinDelay=TimeSpan.FromMilliseconds(100);options.MaxDelay=TimeSpan.FromSeconds(5);options.Mode=ThrottlingMode.Linear;// or Exponential});app.UseGradualThrottling();builder.Services.AddCpuGuardRateLimiting(options =>{options.RequestsPerWindow=100;options.Window=TimeSpan.FromMinutes(1);options.Mode=RateLimitMode.SlidingWindow;// or FixedWindow, TokenBucket// CPU-aware rate limitingoptions.CombineWithCpuLimit=true;options.CpuThresholdForStricterLimits=70.0;options.HighCpuRateLimitFactor=0.5;// Reduce limit by 50% when CPU is highoptions.IncludeRateLimitHeaders=true;// Add X-RateLimit-* headers});app.UseCpuGuardRateLimiting();builder.Services.AddHealthChecks().AddCpuGuardCpuCheck(configure: opts =>{opts.DegradedThreshold=70.0;opts.UnhealthyThreshold=90.0;}).AddCpuGuardMemoryCheck(configure: opts =>{opts.DegradedThreshold=70.0;opts.UnhealthyThreshold=90.0;});app.MapHealthChecks("/health");// Map all endpoints at onceapp.MapCpuGuardEndpoints("/cpuguard");// Or map individuallyapp.MapCpuGuardStats("/cpuguard/stats");app.MapCpuGuardFullStats("/cpuguard/stats/full");app.MapCpuGuardDashboard("/cpuguard/dashboard");Endpoints:
GET /cpuguard/stats- JSON stats summaryGET /cpuguard/stats/full- Full stats with historyGET /cpuguard/dashboard- Real-time HTML dashboardGET /health- Health check endpoint
{
"currentCpuUsage": 0.01,
"currentMemoryUsage": 1.05,
"currentMemoryBytes": 45236224,
"totalMemoryBytes": 4294967296,
"averageCpuUsage": 0.32,
"peakCpuUsage": 14.47,
"averageMemoryUsage": 1.21,
"peakMemoryUsage": 2.08,
"totalRequestsThrottled": 0,
"totalRequestsDelayed": 0,
"totalRequestsRateLimited": 0,
"totalRequests": 0,
"uptimeSeconds": 125.45,
"lastUpdated": "2025-12-27T14:07:08.921251Z"
}Healthy
When rate limiting is enabled with IncludeRateLimitHeaders = true, responses include:
X-RateLimit-Limit: 100
X-RateLimit-Remaining: 95
X-RateLimit-Reset: 45
usingCpuGuard.NET.Configuration;usingCpuGuard.NET.Extensions;varbuilder=WebApplication.CreateBuilder(args);// Add all CpuGuard servicesbuilder.Services.AddCpuGuard(options =>{options.MaxCpuPercentage=80.0;options.ExcludedPaths.Add("/health");});builder.Services.AddMemoryGuard(options =>{options.MaxMemoryPercentage=85.0;});builder.Services.AddGradualThrottling(options =>{options.SoftLimitPercentage=60.0;options.HardLimitPercentage=90.0;});builder.Services.AddCpuGuardRateLimiting(options =>{options.RequestsPerWindow=100;options.Window=TimeSpan.FromMinutes(1);});builder.Services.AddHealthChecks().AddCpuGuardHealthChecks();varapp=builder.Build();// Map endpointsapp.MapCpuGuardEndpoints("/cpuguard");app.MapHealthChecks("/health");// Apply middleware (order matters)app.UseCpuGuardRateLimiting();app.UseGradualThrottling();app.UseCpuGuard();app.UseMemoryGuard();app.MapGet("/",()=>"Hello World!");app.Run();CpuGuard.NET exports the following metrics:
| Metric | Type | Description |
|---|---|---|
cpuguard_requests_throttled_total | Counter | Requests throttled due to limits |
cpuguard_requests_delayed_total | Counter | Requests delayed by throttling |
cpuguard_requests_ratelimited_total | Counter | Requests rejected by rate limiting |
cpuguard_cpu_usage_percent | Histogram | CPU usage percentage |
cpuguard_memory_usage_percent | Histogram | Memory usage percentage |
cpuguard_delay_applied_milliseconds | Histogram | Delay applied to requests |
For best results, apply middleware in this order:
app.UseCpuGuardRateLimiting();// 1. Rate limit firstapp.UseGradualThrottling();// 2. Then gradual throttlingapp.UseCpuGuard();// 3. Then CPU guardapp.UseMemoryGuard();// 4. Then memory guardThe legacy API is still supported:
// Legacy usage (still works)app.UseCpuLimitMiddleware(20.0,TimeSpan.FromMilliseconds(1000));app.UseCpuLimitRequestMiddleware(15.0,TimeSpan.FromMilliseconds(1000));MIT License