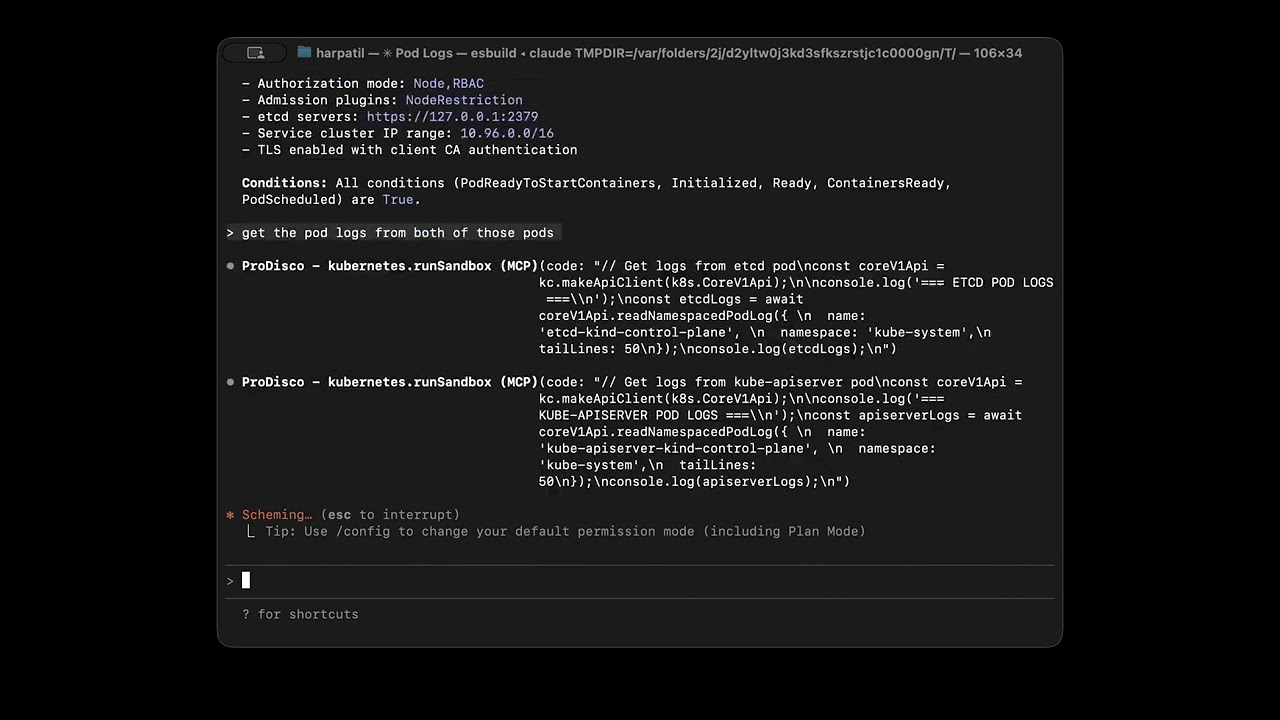
ProDisco is a progressive-disclosure MCP server framework: you provide a list of TypeScript libraries, ProDisco indexes their APIs for discovery, and a sandbox executes code that uses only those libraries. It follows Anthropic's Progressive Disclosure pattern: the MCP server exposes search tools which surface library APIs, agents discover them to write code, execute it in a sandbox, and only the final console output returns to the agent.
Kubernetes/observability is just one example configuration (see examples/). You can equally build an MCP server around AWS/GCP SDKs, Postgres clients, internal TypeScript SDKs, etc.
Note: ProDisco prefers indexing APIs from TypeScript declaration files (
.d.ts). If a library ships no.d.ts, ProDisco can fall back to indexing ESM JavaScript exports (best-effort; types default toany). CommonJS-only JavaScript packages without typings are not supported.
Demo use-cases (optional):
- Kubernetes access via
@kubernetes/client-node - Prometheus metrics via
@prodisco/prometheus-client - Loki logs via
@prodisco/loki-client - Analytics via
simple-statistics

Each MCP client session gets its own isolated Sandbox CRD (Kata VM), with per-session gRPC connections, idle timeout cleanup, and max session limits. See docs/grpc-sandbox-architecture.md for details.
- Why Progressive Disclosure?
- Quick Start
- Available Tools
- Advanced Analytics
- Advanced Deployment
- Testing
- Additional Documentation
- License
Anthropic's latest guidance explains why MCP servers should progressively reveal capabilities instead of dumping every tool definition into the model context. When agents explore a filesystem of TypeScript modules, they only load what they need and process data inside the execution environment, then return a concise result to the chat. This keeps token usage low, improves latency, and avoids copying large intermediate payloads through the model (source).
ProDisco goes a step further: instead of exposing custom TypeScript modules, it provides a structured parameter search tool that dynamically extracts methods from upstream libraries using TypeScript AST parsing. This means:
- Zero maintenance - Methods are extracted directly from library
.d.tsfiles - Always current - Upgrading a dependency automatically exposes new methods
- Type-safe - Full parameter types and return types included
Kubernetes + Observability:
curl -O https://raw.githubusercontent.com/harche/ProDisco/main/examples/prodisco.kubernetes.yaml
claude mcp add ProDisco --env KUBECONFIG="${HOME}/.kube/config" -- npx -y @prodisco/mcp-server --config prodisco.kubernetes.yaml
PostgreSQL (in-memory testing):
curl -O https://raw.githubusercontent.com/harche/ProDisco/main/examples/prodisco.postgres.yaml
claude mcp add ProDisco -- npx -y @prodisco/mcp-server --config prodisco.postgres.yaml
Remove if needed:
claude mcp remove ProDisco| Variable | Required | Description |
|---|---|---|
PRODISCO_CONFIG_PATH | No | Path to the libraries config file (same as --config) |
KUBECONFIG | No | (If using @kubernetes/client-node) Path to kubeconfig (defaults to ~/.kube/config) |
PROMETHEUS_URL | No | (If using @prodisco/prometheus-client) Prometheus server URL |
LOKI_URL | No | (If using @prodisco/loki-client) Loki server URL |
Important: Export environment variables before running
claude mcp add. The--envflag may not reliably pass variables to the MCP server process.
Tip: If you're using a kind cluster for local testing, you can port-forward to Prometheus:
kubectl port-forward -n monitoring svc/prometheus-server 9090:80Then set
PROMETHEUS_URL="http://localhost:9090"
For local development:
git clone https://github.com/harche/ProDisco.git
cd ProDisco
npm install
npm run build
claude mcp add --transport stdio prodisco -- node dist/server.js
claude mcp remove prodisco # remove when you're done
Startup Options:
| Flag | Description |
|---|---|
--clear-cache | Clear the scripts cache before starting |
--config <path> | Path to YAML/JSON config listing libraries to index/allow |
--transport <mode> | Transport mode: stdio (default) or http |
--host <host> | HTTP host to bind to (default: 127.0.0.1) |
--port <port> | HTTP port (default: 3000, implies --transport http) |
node dist/server.js --clear-cacheProDisco can be started with a config file that determines which npm packages are:
- Indexed by
prodisco.searchTools - Allowed in the sandbox via
require()(kept in lockstep with indexing)
See examples/ for ready-to-use configs (Kubernetes, PostgreSQL, etc.).
Example prodisco.config.yaml:
libraries:
- name: "@kubernetes/client-node"description: "Kubernetes API client"
- name: "@prodisco/prometheus-client"description: "Prometheus queries + metric discovery"
- name: "@prodisco/loki-client"description: "Loki LogQL querying"
- name: "simple-statistics"description: "Statistics helpers"
Start with a config file:
node dist/server.js --config prodisco.config.yamlMissing packages are automatically installed into .cache/deps on startup.
Environment variables:
| Variable | Description |
|---|---|
PRODISCO_CONFIG_PATH | Path to YAML/JSON config listing libraries |
If you want images that already contain the configured libraries (for deploying MCP and sandbox separately), you can build them directly from the same config file:
npm run docker:build:config -- --config prodisco.config.yamlThis builds:
prodisco/mcp-server:<configSha8>using the rootDockerfileprodisco/sandbox-server:<configSha8>usingpackages/sandbox-server/Dockerfile
You can override image names/tags:
npm run docker:build:config -- --config prodisco.config.yaml --tag dev --mcp-image myorg/prodisco-mcp --sandbox-image myorg/prodisco-sandboxProDisco supports HTTP transport for network-based MCP connections, enabling remote access and containerized deployments.
Start in HTTP mode:
# HTTP mode on default port (3000)
node dist/server.js --transport http
# HTTP mode on custom port
node dist/server.js --port 8080
# HTTP mode on all interfaces (for network access)
node dist/server.js --host 0.0.0.0 --port 3000
Environment Variables:
| Variable | Default | Description |
|---|---|---|
MCP_TRANSPORT | stdio | Transport mode (stdio or http) |
MCP_HOST | 127.0.0.1 | HTTP host to bind to |
MCP_PORT | 3000 | HTTP port to listen on |
HTTP Endpoints:
| Endpoint | Method | Description |
|---|---|---|
/health | GET | Health check, returns {"status":"ok"} |
/mcp | POST | MCP JSON-RPC endpoint (Streamable HTTP) |
Example: Connect with curl
# Health check
curl http://localhost:3000/health
# Initialize MCP session
curl -X POST http://localhost:3000/mcp \
-H "Content-Type: application/json" \
-H "Accept: application/json, text/event-stream" \
-d '{"jsonrpc":"2.0","id":1,"method":"initialize","params":{"protocolVersion":"2024-11-05","capabilities":{},"clientInfo":{"name":"test","version":"1.0.0"}}}'# Use session ID from response header for subsequent requests
curl -X POST http://localhost:3000/mcp \
-H "Content-Type: application/json" \
-H "mcp-session-id: <session-id-from-init>" \
-d '{"jsonrpc":"2.0","id":2,"method":"tools/list","params":{}}'
The HTTP transport uses the MCP SDK's StreamableHTTPServerTransport, which supports session management via mcp-session-id headers and Server-Sent Events (SSE) for streaming responses.
ProDisco exposes two tools:
Search and browse extracted API documentation for your startup-configured TypeScript libraries (from .d.ts). Use it to discover the correct method/type/function signatures before calling prodisco.runSandbox.
Document Types:
| Type | Description |
|---|---|
method | Class methods / instance APIs extracted from configured libraries |
type | TypeScript types (interfaces/classes/enums/type aliases) |
function | Standalone exported functions |
script | Cached sandbox scripts |
all | Search everything above (default) |
Examples:
// Search broadly by name (methods/types/functions/scripts)// Replace the placeholders with terms relevant to your configured libraries.{methodName: "<search-term>"}// Filter by document type (methods/types/functions/scripts){methodName: "<search-term>",documentType: "method"}// Find Loki query methods{documentType: "method",library: "@prodisco/loki-client",category: "query"}// Find Prometheus methods{methodName: "executeRange",library: "@prodisco/prometheus-client"}// Find analytics functions{documentType: "function",library: "simple-statistics"}// Search cached scripts{documentType: "script",methodName: "deployment"}// Get TypeScript type definitions (classes/interfaces/enums/type aliases){methodName: "<type-or-class-name>",documentType: "type"}// Exclude certain categories/libraries{methodName: "query",exclude: {categories: ["delete"],libraries: ["some-library"]}}For comprehensive documentation, see docs/search-tools.md.
Execute TypeScript code in a sandboxed environment using the same configured library allowlist as prodisco.searchTools.
Execution Modes:
| Mode | Purpose | Key Parameters |
|---|---|---|
execute (default) | Blocking execution | code or cached, timeout |
stream | Real-time output streaming | code or cached, timeout |
async | Background execution | code or cached, timeout |
status | Check async execution | executionId, wait, outputOffset |
cancel | Cancel running execution | executionId |
list | List active executions | states, limit |
Sandbox Environment:
console- Captured output (log, error, warn, info)require()- Restricted to configured npm packages (and their subpaths)process.env- Environment variables
Examples:
// Execute code (default mode){code: ` const k8s = require("@kubernetes/client-node"); const kc = new k8s.KubeConfig(); kc.loadFromDefault(); const api = kc.makeApiClient(k8s.CoreV1Api); const pods = await api.listNamespacedPod("default"); console.log(\`Found \${pods.body.items.length} pods\`); `}// Run a cached script{cached: "script-2025-01-01T12-00-00-abc123.ts"}// Stream mode - real-time output{mode: "stream",code: "for(let i=0; i<5; i++) console.log(i)"}// Async mode - start long-running task{mode: "async",code: "longRunningTask()"}// Check async execution status{mode: "status",executionId: "abc-123",wait: true}// Cancel a running execution{mode: "cancel",executionId: "abc-123"}// Query Prometheus metrics{code: ` const { PrometheusClient, MetricSearchEngine } = require('@prodisco/prometheus-client'); const client = new PrometheusClient({ endpoint: process.env.PROMETHEUS_URL }); // Discover metrics semantically const search = new MetricSearchEngine(client); const metrics = await search.search("memory usage"); console.log('Found metrics:', metrics.map(m => m.name)); // Execute PromQL query const end = new Date(); const start = new Date(end.getTime() - 60 * 60 * 1000); const result = await client.executeRange('node_memory_MemAvailable_bytes', { start, end, step: '1m' }); console.log(\`Got \${result.data.length} time series\`); `}// Query Loki logs{code: ` const { LokiClient } = require('@prodisco/loki-client'); const client = new LokiClient({ baseUrl: process.env.LOKI_URL }); const result = await client.queryRange('{namespace="default"}', { since: '1h', limit: 100 }); result.logs.forEach(log => console.log(\`[\${log.timestamp.toISOString()}] \${log.line}\`)); `}For architecture details, see docs/grpc-sandbox-architecture.md.
ProDisco goes beyond simple resource fetching - it provides statistical analysis, machine learning, and signal processing capabilities for deep cluster observability.
Available Libraries:
| Library | Purpose |
|---|---|
simple-statistics | Mean, median, std dev, z-scores, percentiles, linear regression, correlation |
ml-regression | Polynomial, exponential, and power regression for trend forecasting |
mathjs | Matrix operations, linear algebra, symbolic math |
fft-js | Fast Fourier Transform for detecting periodic patterns |
Example Prompts:
| Use Case | Prompt |
|---|---|
| Log Analysis | "Query Loki for error logs from the nginx app in the last hour. Show me the most common error patterns." |
| Cluster Health | "Analyze CPU and memory usage across all pods. Calculate mean, median, standard deviation, and identify outliers using z-scores. Show pods above the 95th percentile." |
| Memory Leaks | "Check for memory leaks. Fetch memory usage over 2 hours and use linear regression to identify pods with increasing memory." |
| Anomaly Detection | "Analyze network traffic and detect anomalies. Find receive/transmit rates more than 2 standard deviations from normal." |
| Correlation | "Find correlations between CPU and memory usage. Tell me if high CPU correlates with high memory." |
| Periodic Patterns | "Use FFT analysis on node CPU to detect periodic patterns. Are there dominant frequencies suggesting scheduled jobs?" |
| Capacity Planning | "Analyze resource trends and use polynomial regression to forecast when we might hit resource limits." |
For detailed examples with code and output, see docs/analytics.md.
For stronger isolation, run the sandbox server in a Kubernetes cluster and connect via TCP.
1. Deploy the sandbox server:
# Build and load the image (for kind clusters)
docker build -f packages/sandbox-server/Dockerfile -t prodisco/sandbox-server:latest .
kind load docker-image prodisco/sandbox-server:latest
# Deploy
kubectl apply -f packages/sandbox-server/k8s/deployment.yaml
# Port-forward to access locally
kubectl -n prodisco port-forward service/sandbox-server 50051:50051
2. Configure the MCP server to use TCP:
export KUBECONFIG="${HOME}/.kube/config"export SANDBOX_USE_TCP=true
export SANDBOX_TCP_HOST=localhost
export SANDBOX_TCP_PORT=50051
claude mcp add --transport stdio prodisco -- node dist/server.js --config examples/prodisco.kubernetes.yaml
Transport Environment Variables:
| Variable | Default | Description |
|---|---|---|
SANDBOX_USE_TCP | false | Use TCP instead of local subprocess |
SANDBOX_TCP_HOST | localhost | Sandbox server host |
SANDBOX_TCP_PORT | 50051 | Sandbox server port |
For production deployments, the sandbox server supports TLS and mutual TLS (mTLS):
| Mode | Description |
|---|---|
insecure | No encryption (default, for local development) |
tls | Server-side TLS (client verifies server identity) |
mtls | Mutual TLS (both client and server authenticate) |
Configuration:
# Server-side TLSexport SANDBOX_TRANSPORT_MODE=tls
export SANDBOX_TLS_CERT_PATH=/path/to/server.crt
export SANDBOX_TLS_KEY_PATH=/path/to/server.key
# Client-side (MCP server)export SANDBOX_TRANSPORT_MODE=tls
export SANDBOX_TLS_CA_PATH=/path/to/ca.crt
For Kubernetes deployments, use cert-manager to automate certificate management. See the k8s/cert-manager directory for ready-to-use manifests.
For full architecture and security details, see docs/grpc-sandbox-architecture.md.
End-to-end testing with KIND cluster + Claude Agent SDK:
npm run test:integrationFor detailed testing instructions, see docs/integration-testing.md.
| Document | Description |
|---|---|
| docs/analytics.md | Advanced analytics guide - anomaly detection, forecasting, correlation, FFT analysis |
| docs/search-tools.md | Complete searchTools reference with examples and technical architecture |
| examples/README.md | Practical examples + runnable library config files (examples/*.yaml) |
| docs/grpc-sandbox-architecture.md | Sandbox architecture, gRPC protocol, and security configuration |
| docs/integration-testing.md | Integration test workflow and container tests |
MIT