




Generate Chart.JS charts as image and embed them everywhere in emails, pdf reports, chat bots...!
1. Install Chart.JS Image npm Package
npm install chart.js-image --saveCommonJS
constChartJSImage=require('chart.js-image');ES6
importChartJSImagefrom'chart.js-image';constline_chart=ChartJSImage().chart({"type": "line","data": {"labels": ["January","February","March","April","May","June","July"],"datasets": [{"label": "My First dataset","borderColor": "rgb(255,+99,+132)","backgroundColor": "rgba(255,+99,+132,+.5)","data": [57,90,11,-15,37,-37,-27]},{"label": "My Second dataset","borderColor": "rgb(54,+162,+235)","backgroundColor": "rgba(54,+162,+235,+.5)","data": [71,-36,-94,78,98,65,-61]},{"label": "My Third dataset","borderColor": "rgb(75,+192,+192)","backgroundColor": "rgba(75,+192,+192,+.5)","data": [48,-64,-61,98,0,-39,-70]},{"label": "My Fourth dataset","borderColor": "rgb(255,+205,+86)","backgroundColor": "rgba(255,+205,+86,+.5)","data": [-58,88,29,44,3,78,-9]}]},"options": {"title": {"display": true,"text": "Chart.js Line Chart"},"scales": {"xAxes": [{"scaleLabel": {"display": true,"labelString": "Month"}}],"yAxes": [{"stacked": true,"scaleLabel": {"display": true,"labelString": "Value"}}]}}})// Line chart.backgroundColor('white').width(500)// 500px.height(300);// 300pxline_chart.toURL();// String: https://image-charts.com/chart.js/2.8.0?icac=documentation&chart=%7Btype%3A%27line%27%2Cdata%3A%7Blabels%3A%5B%27January%27%2C%27February%27%2C%27March%27%2C%27April%27%2C%27May%27%2C%27June%27%2C%27July%27%5D%2Cdatasets%3A%5B%7Blabel%3A%27My+First+dataset%27%2CborderColor%3A%27rgb%28255%2C+99%2C+132%29%27%2CbackgroundColor%3A%27rgba%28255%2C+99%2C+132%2C+.5%29%27%2Cdata%3A%5B57%2C90%2C11%2C-15%2C37%2C-37%2C-27%5D%7D%2C%7Blabel%3A%27My+Second+dataset%27%2CborderColor%3A%27rgb%2854%2C+162%2C+235%29%27%2CbackgroundColor%3A%27rgba%2854%2C+162%2C+235%2C+.5%29%27%2Cdata%3A%5B71%2C-36%2C-94%2C78%2C98%2C65%2C-61%5D%7D%2C%7Blabel%3A%27My+Third+dataset%27%2CborderColor%3A%27rgb%2875%2C+192%2C+192%29%27%2CbackgroundColor%3A%27rgba%2875%2C+192%2C+192%2C+.5%29%27%2Cdata%3A%5B48%2C-64%2C-61%2C98%2C0%2C-39%2C-70%5D%7D%2C%7Blabel%3A%27My+Third+dataset%27%2CborderColor%3A%27rgb%28255%2C+205%2C+86%29%27%2CbackgroundColor%3A%27rgba%28255%2C+205%2C+86%2C+.5%29%27%2Cdata%3A%5B-58%2C88%2C29%2C44%2C3%2C78%2C-9%5D%7D%5D%7D%2Coptions%3A%7Bresponsive%3Atrue%2Ctitle%3A%7Bdisplay%3Atrue%2Ctext%3A%27Chart.js+Line+Chart+-+Stacked+Area%27%7D%2Ctooltips%3A%7Bmode%3A%27index%27%7D%2Chover%3A%7Bmode%3A%27index%27%7D%2Cscales%3A%7BxAxes%3A%5B%7BscaleLabel%3A%7Bdisplay%3Atrue%2ClabelString%3A%27Month%27%7D%7D%5D%2CyAxes%3A%5B%7Bstacked%3Atrue%2CscaleLabel%3A%7Bdisplay%3Atrue%2ClabelString%3A%27Value%27%7D%7D%5D%7D%7D%7D&bkg=white&width=700&height=390&icretina=1&ichm=922e17b749b1ab7fab2a14cb742029dc46e50e658457913a9f548793910d2a0dline_chart.toFile('/path/to/chart.png');// Promise<()>line_chart.toDataURI();// Promise<String> : data:image/png;base64,iVBORw0KGgo...line_chart.toBuffer();// Promise<Buffer> : Buffer 89 50 4e 47 0d 0a 1a 0a 00 00 00 ...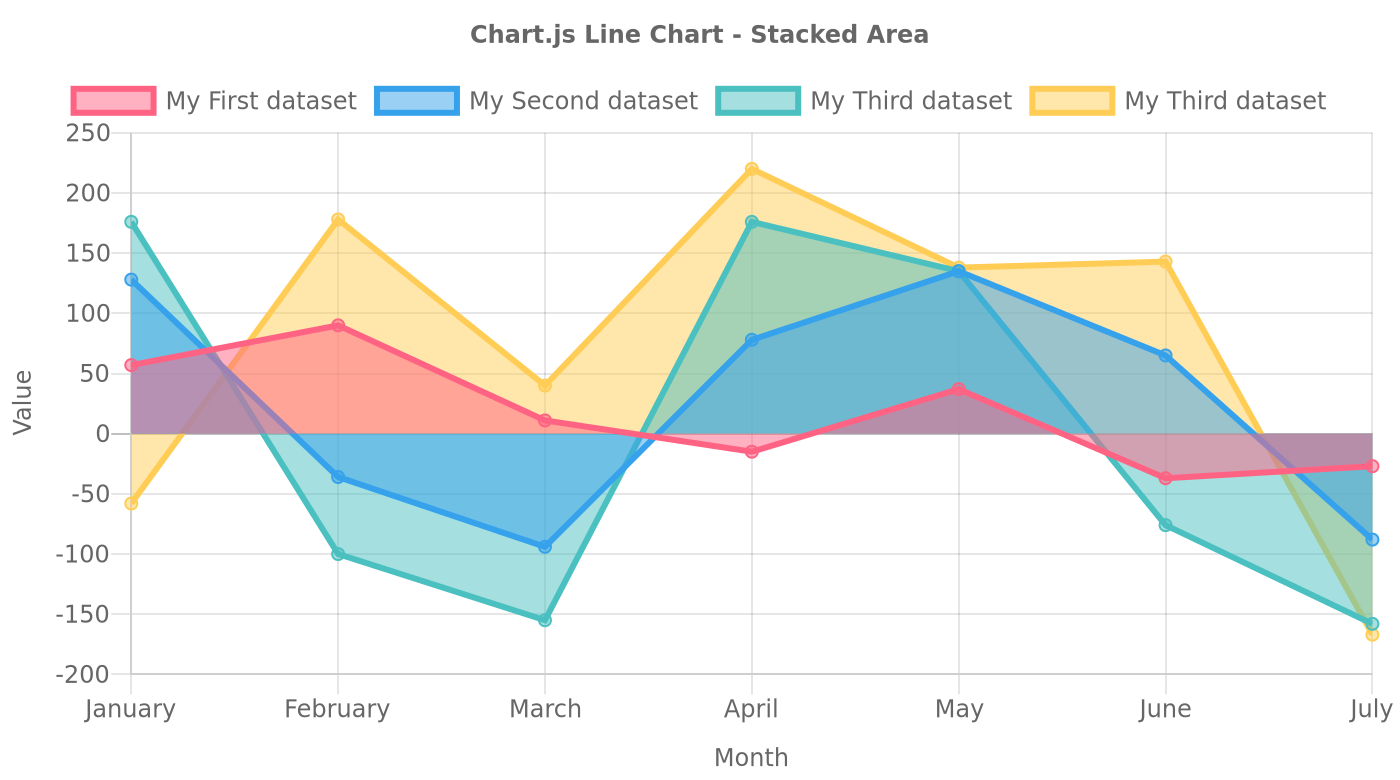

- Enterprise support
- On-Premise support
- Constructor
- Methods
- toURL()
- toFile()
- toBuffer()
- toDataURI()
- c(value) - Javascript/JSON definition of the chart. Use a Chart.js configuration object.
- chart(value) - Javascript/JSON definition of the chart. Use a Chart.js configuration object.
- width(value) - Width of the chart
- height(value) - Height of the chart
- backgroundColor(value) - Background of the chart canvas. Accepts rgb (rgb(255,255,120)), colors (red), and url-encoded hex values (%23ff00ff). Abbreviated as "bkg"
- bkg(value) - Background of the chart canvas. Accepts rgb (rgb(255,255,120)), colors (red), and url-encoded hex values (%23ff00ff). Abbreviated as "bkg"
- encoding(value) - Encoding of your "chart" parameter. Accepted values are url and base64.
- icac(value) - image-charts enterprise
account_id - ichm(value) - HMAC-SHA256 signature required to activate paid features
- icretina(value) - retina mode
Create an instance, the argument within [ ] is optional. See usage
ChartJSImage([Objectopt])// ornewChartJSImage([Objectopt])Default options are listed below.
opt={/* * Request timeout (in millisecond) when calling toBuffer() or toDataURI() */timeout: 5000,/* * (Enterprise and Enterprise+ subscription only) SECRET_KEY */secret: null,/* * (Enterprise, Enterprise+ and On-Premise subscription only) custom domain */host: 'image-charts.com',/* * (On-Premise subscription only) custom protocol */protocol: 'https',/* * (On-Premise subscription only) custom port */port: 443,/* * (On-Premise subscription only) custom pathname */pathname: '/chart.js/2.8.0'}Get the full Image-Charts API url (signed and encoded if necessary)
// import ChartJSImage from 'chart.js-image';constChartJSImage=require('..');constchart_url=ChartJSImage().chart({type: 'bar',data: {labels: ['Hello world','Foo bar'],datasets: [{label: 'Foo',data: [1,2]}]},})// vertical bar chart.width(300)// 300px.height(300)// 300px.toURL();// get the generated URLconsole.log(chart_url);// https://image-charts.com/chart?cht=bvg&chs=300x300&chd=a%3A60%2C40Creates a file containing generated chart image and yield a promise.
When
fileis a filename, asynchronously writes data to the file, replacing the file if it already exists. Whenfileis a file descriptor, the behavior is similar to calling fs.write() directly (which is recommended).
//import ChartJSImage from 'chart.js-image';constChartJSImage=require('..');constchart_path='/tmp/chart.png';ChartJSImage().chart({"type": "radar","data": {"labels": ["January","February","March","April","May","June","July","August"],"datasets": [{"backgroundColor": "rgba(255, 99, 132, 0.5)","borderColor": "rgb(255, 99, 132)","data": [15.09,15.67,12.5,12.77,13.62,13.68,13.93,15.95],"label": "D0"},{"backgroundColor": "rgba(255, 159, 64, 0.5)","borderColor": "rgb(255, 159, 64)","data": [24.55,28.91,21.81,23.27,26.98,26.05,25.39,24.92],"label": "D1","fill": "-1"},{"backgroundColor": "rgba(255, 205, 86, 0.5)","borderColor": "rgb(255, 205, 86)","data": [36.35,43.93,32.54,33.54,42.82,39.34,35.84,33.5],"label": "D2","fill": 1},{"backgroundColor": "rgba(75, 192, 192, 0.5)","borderColor": "rgb(75, 192, 192)","data": [47.7,58.92,44.45,49.08,53.39,51.85,48.4,49.36],"label": "D3","fill": false},{"backgroundColor": "rgba(54, 162, 235, 0.5)","borderColor": "rgb(54, 162, 235)","data": [60.73,71.97,53.96,57.22,65.09,62.06,56.91,60.52],"label": "D4","fill": "-1"},{"backgroundColor": "rgba(153, 102, 255, 0.5)","borderColor": "rgb(153, 102, 255)","data": [73.33,80.78,68.05,68.59,76.79,77.24,66.08,72.37],"label": "D5","fill": "-1"}]},"options": {"maintainAspectRatio": true,"spanGaps": false,"elements": {"line": {"tension": 0.000001}},"plugins": {"filler": {"propagate": false},"samples-filler-analyser": {"target": "chart-analyser"}}}}).bkg('white').width(700).height(390).toFile(chart_path).then(()=>console.log('Image chart written at %s',chart_path))Do a request to Image-Charts API with current configuration and yield a promise of a NodeJS buffer
//import ChartJSImage from 'chart.js-image';constChartJSImage=require('..');constbuffer=ChartJSImage().chart({"type": "radar","data": {"labels": ["January","February","March","April","May","June","July","August"],"datasets": [{"backgroundColor": "rgba(255, 99, 132, 0.5)","borderColor": "rgb(255, 99, 132)","data": [15.09,15.67,12.5,12.77,13.62,13.68,13.93,15.95],"label": "D0"},{"backgroundColor": "rgba(255, 159, 64, 0.5)","borderColor": "rgb(255, 159, 64)","data": [24.55,28.91,21.81,23.27,26.98,26.05,25.39,24.92],"label": "D1","fill": "-1"},{"backgroundColor": "rgba(255, 205, 86, 0.5)","borderColor": "rgb(255, 205, 86)","data": [36.35,43.93,32.54,33.54,42.82,39.34,35.84,33.5],"label": "D2","fill": 1},{"backgroundColor": "rgba(75, 192, 192, 0.5)","borderColor": "rgb(75, 192, 192)","data": [47.7,58.92,44.45,49.08,53.39,51.85,48.4,49.36],"label": "D3","fill": false},{"backgroundColor": "rgba(54, 162, 235, 0.5)","borderColor": "rgb(54, 162, 235)","data": [60.73,71.97,53.96,57.22,65.09,62.06,56.91,60.52],"label": "D4","fill": "-1"},{"backgroundColor": "rgba(153, 102, 255, 0.5)","borderColor": "rgb(153, 102, 255)","data": [73.33,80.78,68.05,68.59,76.79,77.24,66.08,72.37],"label": "D5","fill": "-1"}]},"options": {"maintainAspectRatio": true,"spanGaps": false,"elements": {"line": {"tension": 0.000001}},"plugins": {"filler": {"propagate": false},"samples-filler-analyser": {"target": "chart-analyser"}}}}).bkg('white').width(700).height(390).toBuffer()// download chart image as a buffer.then((buffer)=>console.log(buffer))// <Buffer 89 50 4e 47 0d 0a 1a 0a 00 00 00 0d 49 48 44 5Do a request to Image-Charts API with current configuration and yield a promise of a base64 encoded data URI
//import ChartJSImage from 'chart.js-image';constChartJSImage=require('..');constchart_url=ChartJSImage().chart({"type": "radar","data": {"labels": ["January","February","March","April","May","June","July","August"],"datasets": [{"backgroundColor": "rgba(255, 99, 132, 0.5)","borderColor": "rgb(255, 99, 132)","data": [15.09,15.67,12.5,12.77,13.62,13.68,13.93,15.95],"label": "D0"},{"backgroundColor": "rgba(255, 159, 64, 0.5)","borderColor": "rgb(255, 159, 64)","data": [24.55,28.91,21.81,23.27,26.98,26.05,25.39,24.92],"label": "D1","fill": "-1"},{"backgroundColor": "rgba(255, 205, 86, 0.5)","borderColor": "rgb(255, 205, 86)","data": [36.35,43.93,32.54,33.54,42.82,39.34,35.84,33.5],"label": "D2","fill": 1},{"backgroundColor": "rgba(75, 192, 192, 0.5)","borderColor": "rgb(75, 192, 192)","data": [47.7,58.92,44.45,49.08,53.39,51.85,48.4,49.36],"label": "D3","fill": false},{"backgroundColor": "rgba(54, 162, 235, 0.5)","borderColor": "rgb(54, 162, 235)","data": [60.73,71.97,53.96,57.22,65.09,62.06,56.91,60.52],"label": "D4","fill": "-1"},{"backgroundColor": "rgba(153, 102, 255, 0.5)","borderColor": "rgb(153, 102, 255)","data": [73.33,80.78,68.05,68.59,76.79,77.24,66.08,72.37],"label": "D5","fill": "-1"}]},"options": {"maintainAspectRatio": true,"spanGaps": false,"elements": {"line": {"tension": 0.000001}},"plugins": {"filler": {"propagate": false},"samples-filler-analyser": {"target": "chart-analyser"}}}}).bkg('white').width(700).height(390).toDataURI()// download chart image and generate a data URI string.then(chart_url=>console.log(chart_url));// "data:image/png;base64,iVBORw0KGgoAAAANSUhE"UgAABXgAAAMMCAIAAABmCliNAAHJnElEQVR42uzdeXjc1X3v8e/sq8baF2uXvMkbBmxibMALmN0FGiCBJpT0Ccnl0qRNnockT3vbOuT2Xkpzcxty0yZtnoQCqdliCKaktpEBG2+xkRfJlmzZsiXLlrWPRpp9u38c+DEZybYsy/KM9H794Uf6+aefRufMdj5zzvfo4vG4AAAAAAAAjAc9TQAAAAAAAMYLQQMAAAAAABPhyJEjf/RHf+T1elPkF12h20PQAAAAAADARCgvL1+3bp3Vap3cf6aRngYAAAAAYAK0trauW7fub/7mb37wgx8kHs/KynruuecKCgreeOONF198UR187bXXduzY8eMf/1j79p133lH/u27duuuuuy7p4q+//vpLL70kIn/7t39rt9tF5JFHHjnflVtbW7/zne988YtfVKd9//vfr6ysfPzxx2OxmDpBpSGJ11y8eLF2ERWXfO973xvxryBoAAAAAABgon3ve9/r6ur65S9/+Vd/9Vfnzp174okn1q1b9+KLL2rHjxw58uMf//hrX/taJBJR37744ot/+Zd/2d3dvW7dutdeey3xai0tLS+99JL62WeeeWbdunXarxjxyuvWrfve975nMBjUaaFQ6LHHHvvLv/xLm81msVjMZrNaWJF0Te0i69atS/wViX/Fa6+9RtAAAAAAAMBEu+aaa1pbW0Vk0aJFLS0tw48rc+bMCYVC2rf/9E//VFpa+vOf/9xisdx3333a8WeffVb9rMFgmD9/fjAYHH6p8317zTXX6HS6u+6665/+6Z8qKyu1ORTaaaO5ZuJfQdAAAAAAAEB6WLduXWZmZlFRkRYuJLFYLCUlJYnJxWjY7fYnn3xy5cqVp06d2r1799KlSy/nmhSDBAAAAAAgVRw8ePDYsWPat01NTYnfBgIBt9tdV1cXi8XmJtB+9re//e3DDz8cCAQueuXE4x0dHXV1dX6/PxgM/q//9b96enrq6uqi0ejwa57vIomY0QAAAAAAwNU3d+7ct99++/7771cVGdW3Tz755JkzZ4b/r1avMelny8vL33777SNHjlImage-Charts Enterprise and Enterprise+ subscriptions remove the watermark and enable advanced features like custom-domain, high-resolution charts, custom fonts, multiple axis and mixed charts.
Once subscribed to a plan you will receive an ACCOUNT_ID and a SECRET_KEY.
These two parameters are mandatory to sign your request and remove the watermark.
Replace both values in the code example below:
//import ChartJSImage from 'chart.js-image';constChartJSImage=require('..');constchart_url=ChartJSImage({secret: process.env.SECRET_KEY||'SECRET_KEY'}).icac(process.env.ACCOUNT_ID||'ACCOUNT_ID').chart({type: 'line',data: {labels: ['January','February','March','April','May','June','July'],datasets: [{label: 'My First dataset',borderColor: 'rgb(255, 99, 132)',backgroundColor: 'rgba(255, 99, 132, .5)',data: [57,90,11,-15,37,-37,-27],},{label: 'My Second dataset',borderColor: 'rgb(54, 162, 235)',backgroundColor: 'rgba(54, 162, 235, .5)',data: [71,-36,-94,78,98,65,-61],},{label: 'My Third dataset',borderColor: 'rgb(75, 192, 192)',backgroundColor: 'rgba(75, 192, 192, .5)',data: [48,-64,-61,98,0,-39,-70],},{label: 'My Third dataset',borderColor: 'rgb(255, 205, 86)',backgroundColor: 'rgba(255, 205, 86, .5)',data: [-58,88,29,44,3,78,-9],},],},options: {responsive: true,title: {display: true,text: 'Chart.js Line Chart - Stacked Area',},tooltips: {mode: 'index',},hover: {mode: 'index',},scales: {xAxes: [{scaleLabel: {display: true,labelString: 'Month',},},],yAxes: [{stacked: true,scaleLabel: {display: true,labelString: 'Value',},},],},},}).bkg('white').width(700).height(390).icretina('1')// enable paid-only features like high-resolution charts.toURL();// get the whole (HMAC signed) URLconsole.log(chart_url);// https://image-charts.com/chart.js/2.8.0?icac=documentation&chart=%7Btype%3A%27line%27%2Cdata%3A%7Blabels%3A%5B%27January%27%2C%27February%27%2C%27March%27%2C%27April%27%2C%27May%27%2C%27June%27%2C%27July%27%5D%2Cdatasets%3A%5B%7Blabel%3A%27My+First+dataset%27%2CborderColor%3A%27rgb%28255%2C+99%2C+132%29%27%2CbackgroundColor%3A%27rgba%28255%2C+99%2C+132%2C+.5%29%27%2Cdata%3A%5B57%2C90%2C11%2C-15%2C37%2C-37%2C-27%5D%7D%2C%7Blabel%3A%27My+Second+dataset%27%2CborderColor%3A%27rgb%2854%2C+162%2C+235%29%27%2CbackgroundColor%3A%27rgba%2854%2C+162%2C+235%2C+.5%29%27%2Cdata%3A%5B71%2C-36%2C-94%2C78%2C98%2C65%2C-61%5D%7D%2C%7Blabel%3A%27My+Third+dataset%27%2CborderColor%3A%27rgb%2875%2C+192%2C+192%29%27%2CbackgroundColor%3A%27rgba%2875%2C+192%2C+192%2C+.5%29%27%2Cdata%3A%5B48%2C-64%2C-61%2C98%2C0%2C-39%2C-70%5D%7D%2C%7Blabel%3A%27My+Third+dataset%27%2CborderColor%3A%27rgb%28255%2C+205%2C+86%29%27%2CbackgroundColor%3A%27rgba%28255%2C+205%2C+86%2C+.5%29%27%2Cdata%3A%5B-58%2C88%2C29%2C44%2C3%2C78%2C-9%5D%7D%5D%7D%2Coptions%3A%7Bresponsive%3Atrue%2Ctitle%3A%7Bdisplay%3Atrue%2Ctext%3A%27Chart.js+Line+Chart+-+Stacked+Area%27%7D%2Ctooltips%3A%7Bmode%3A%27index%27%7D%2Chover%3A%7Bmode%3A%27index%27%7D%2Cscales%3A%7BxAxes%3A%5B%7BscaleLabel%3A%7Bdisplay%3Atrue%2ClabelString%3A%27Month%27%7D%7D%5D%2CyAxes%3A%5B%7Bstacked%3Atrue%2CscaleLabel%3A%7Bdisplay%3Atrue%2ClabelString%3A%27Value%27%7D%7D%5D%7D%7D%7D&bkg=white&width=700&height=390&icretina=1&ichm=922e17b749b1ab7fab2a14cb742029dc46e50e658457913a9f548793910d2a0dImage-Charts virtual appliance can be deployed anywhere inside a customer network.
importChartJSImagefrom'chart.js-image';constchart_url=ChartJSImage({secret: 'SECRET_KEY',// override the host with your own endpointhost: 'custom-domain.tld'}).chart({/* chart.js configuration object */}).icretina('1')// enable paid-only features like high-resolution charts.toURL();// get the whole (HMAC signed) URLconsole.log(chart_url);// https://image-charts.com/chart.js/2.8.0?icac=documentation&chart=%7Btype%3A%27line%27%2Cdata%3A%7Blabels%3A%5B%27January%27%2C%27February%27%2C%27March%27%2C%27April%27%2C%27May%27%2C%27June%27%2C%27July%27%5D%2Cdatasets%3A%5B%7Blabel%3A%27Unfilled%27%2Cfill%3Afalse%2CbackgroundColor%3A%27rgb%2854%2C+162%2C+235%29%27%2CborderColor%3A%27rgb%2854%2C+162%2C+235%29%27%2Cdata%3A%5B-73%2C40%2C-4%2C27%2C26%2C53%2C-12%5D%7D%2C%7Blabel%3A%27Dashed%27%2Cfill%3Afalse%2CbackgroundColor%3A%27rgb%2875%2C+192%2C+192%29%27%2CborderColor%3A%27rgb%2875%2C+192%2C+192%29%27%2CborderDash%3A%5B5%2C5%5D%2Cdata%3A%5B99%2C-40%2C93%2C-56%2C0%2C25%2C45%5D%7D%2C%7Blabel%3A%27Filled%27%2CbackgroundColor%3A%27rgb%28255%2C+99%2C+132%29%27%2CborderColor%3A%27rgb%28255%2C+99%2C+132%29%27%2Cdata%3A%5B56%2C68%2C84%2C11%2C-96%2C-56%2C-51%5D%2Cfill%3Atrue%7D%5D%7D%2Coptions%3A%7Btitle%3A%7Bdisplay%3Atrue%2Ctext%3A%27Chart.js+Line+Chart%27%7D%2Cscales%3A%7BxAxes%3A%5B%7Bdisplay%3Atrue%2CscaleLabel%3A%7Bdisplay%3Atrue%2ClabelString%3A%27Month%27%7D%7D%5D%2CyAxes%3A%5B%7Bdisplay%3Atrue%2CscaleLabel%3A%7Bdisplay%3Atrue%2ClabelString%3A%27Value%27%7D%7D%5D%7D%7D%7D&bkg=white&width=700&height=390&icretina=1&ichm=f272aa90e5ec691d41ac6c6c541f9d114c09dd38a1c7f114745c00074da72f69c( value ) : ChartJSImage
Javascript/JSON definition of the chart. Use a Chart.js configuration object.
.c("{type:'bar',data:{labels:['Q1','Q2','Q3','Q4'],datasets:[{label:'Users',data:[50,60,70,180]},{label:'Revenue',data:[100,200,300,400]}]}}")chart( value ) : ChartJSImage
Javascript/JSON definition of the chart. Use a Chart.js configuration object.
.chart("{type:'bar',data:{labels:['Q1','Q2','Q3','Q4'],datasets:[{label:'Users',data:[50,60,70,180]},{label:'Revenue',data:[100,200,300,400]}]}}")width( value ) : ChartJSImage
Width of the chart
.width("400")height( value ) : ChartJSImage
Height of the chart
.height("300")backgroundColor( value ) : ChartJSImage
Background of the chart canvas. Accepts rgb (rgb(255,255,120)), colors (red), and url-encoded hex values (%23ff00ff). Abbreviated as "bkg"
.backgroundColor("black").backgroundColor("rgb(255,255,120)").backgroundColor("%23ff00ff")bkg( value ) : ChartJSImage
Background of the chart canvas. Accepts rgb (rgb(255,255,120)), colors (red), and url-encoded hex values (%23ff00ff). Abbreviated as "bkg"
.bkg("black").bkg("rgb(255,255,120)").bkg("%23ff00ff")encoding( value ) : ChartJSImage
Encoding of your "chart" parameter. Accepted values are url and base64.
.encoding("url").encoding("base64")icac( value ) : ChartJSImage
image-charts enterprise
account_id
.icac("accountId")ichm( value ) : ChartJSImage
HMAC-SHA256 signature required to activate paid features
.ichm("0785cf22a0381c2e0239e27c126de4181f501d117c2c81745611e9db928b0376")icretina( value ) : ChartJSImage
retina mode
.icretina("0").icretina("1")