






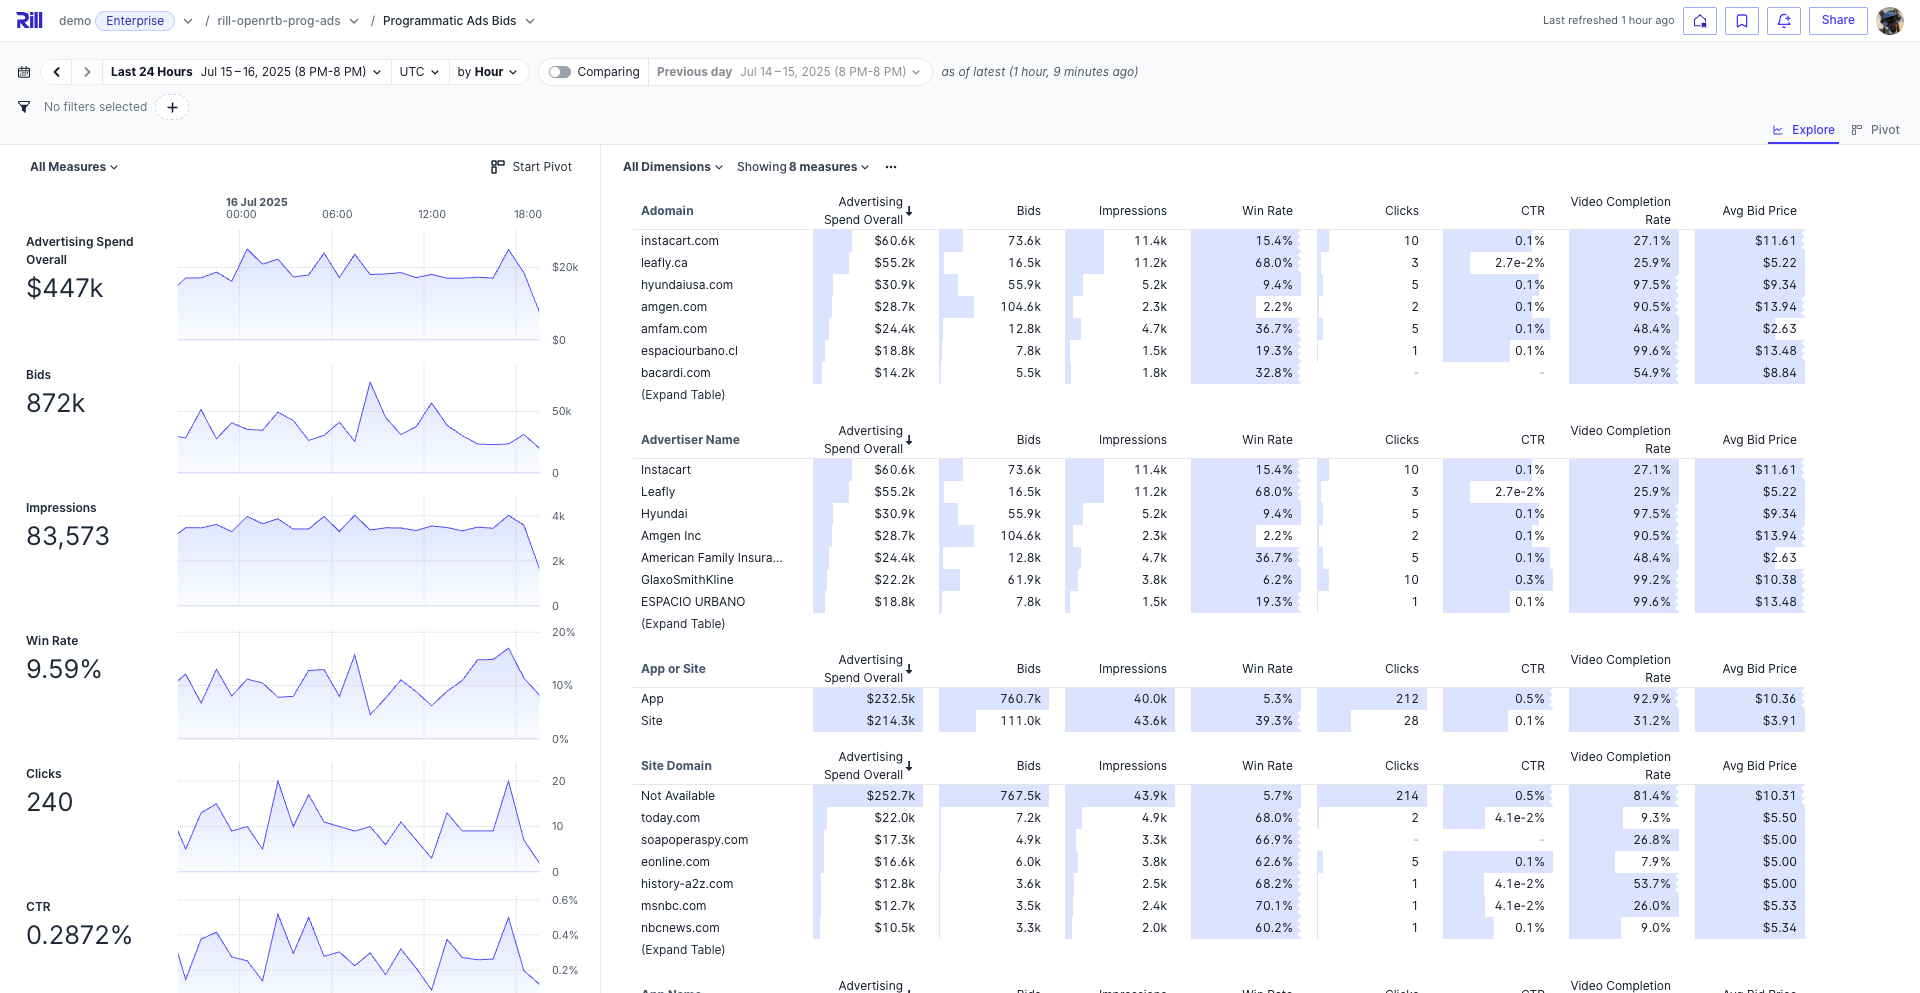
Rill is the fastest BI tool for humans and agents, powered by OLAP engines like ClickHouse and DuckDB.
curl https://rill.sh | sh # install
rill start my-project # create a project and open the UIUse rill init to scaffold a project interactively:
➜ rill init
? Project name my-rill-project
? OLAP engine duckdb
? Agent instructions claude
Created a new Rill project at ~/my-rill-project
Added Claude instructions in .claude and .mcp.json
Success! Run the following command to start the project:
rill start my-rill-project
- Build with agents — BI-as-code (YAML + SQL) means coding agents like Claude Code and Cursor can author projects, dashboards, and security policies end-to-end
- Semantic layer — Single source of truth for dimensions, measures, and time grains — defined in YAML, generating SQL at query time against your OLAP engine
- Explore with agents — Conversational BI lets business users query metrics in natural language; the MCP server connects AI agents directly to your semantic layer
- Real-time performance — Sub-second queries at any scale; ClickHouse for billions of rows, DuckDB for smaller datasets and fast iteration
- Embeddable — Dashboards, APIs, and agent interfaces you can ship in your product
- Connectors — S3, GCS, databases, and 20+ sources
- OLAP Engines — Managed ClickHouse or DuckDB included, or connect an external engine (ClickHouse Cloud, Druid, Pinot, MotherDuck)
- SQL Models — Transform raw data with SQL, join models together
- Data Profiling — Instant column stats and distributions
- Incremental Ingestion — Load only new data on each run to keep large datasets current without full refreshes
- Semantic Layer — Dimensions, measures, and time grains in YAML
- Row Access Policies — Per-user, per-group data access control
- Local Dashboards — Preview and explore dashboards locally
- Deploy — Git-backed, versioned deployments — push with
rill deployor connect a repo for automatic CI/CD - Explore & Canvas Dashboards — Interactive dashboards, embeddable in your product
- Conversational BI — Ask questions in natural language
- MCP Server — Connect Claude, ChatGPT, or any AI agent to your metrics
- Custom APIs & Embedding — Expose metrics via REST or embed dashboards
- Alerts & Reports — Threshold alerting, code-defined or UI-defined
Define everything in code — models, metrics, dashboards — and Rill handles the rest.
1. Connect data — models/events.yaml
type: modelconnector: duckdbmaterialize: truesql: | select * from read_parquet('gs://rilldata-public/auction_data.parquet')2. Define metrics — metrics/events_metrics.yaml
version: 1type: metrics_viewmodel: eventstimeseries: timestampdimensions:
- name: countrycolumn: country
- name: devicecolumn: device_typemeasures:
- name: total_eventsexpression: count(*)
- name: revenueexpression: sum(price * quantity)description: Total revenue
3. Create a dashboard — dashboards/events_explore.yaml
type: exploredisplay_name: "Events Dashboard"metrics_view: events_metricsdimensions: "*"measures: "*"4. Deploy
rill deploy # push to Rill CloudYour metrics view is immediately queryable on Rill Cloud — add YAML files to configure dashboards, alerts, and custom APIs.
Getting Started with Rill Developer • Exploring Data with Rill • Data Talks on the Rocks • Agentic Analytics with Claude Code and Rill
| Example | Description | Links |
|---|---|---|
| Programmatic Ads | Bidstream data for pricing and campaign performance | GitHub · Demo |
| Cost Monitoring | Cloud infra merged with customer data | GitHub · Demo |
| GitHub Analytics | Contributor activity and commit patterns | GitHub · Demo |
Or explore a live embedded dashboard.



We welcome contributions! See our Contributing Guide to get started.