A simple progamming language and compiler for SVG images generation.
The compiler is made in Python 3 using ply (Python Lex and Yacc).
The language is based on states. Most of the drawing attributes are set globally using functions.
For example, to draw three circles with the same attributes, you won't write :
circle(x=20, y=30, radius=10, stroke-width=2, stroke-color="black", fill="red")
circle(x=80, y=30, radius=10, stroke-width=2, stroke-color="black", fill="red")
circle(x=100, y=30, radius=10, stroke-width=2, stroke-color="black", fill="red")
# only the x attribute has changed, but the 3 lines are repetitive
But you will write :
pos(20,30)
width(2)
stroke("black")
fill("red")
ellipse(10) # draw a circle with previously set attributesmove(60,0) # change the position stateellipse(20) # draw a circle with previously set attributes, but at the new positionmove(20,0)
ellipse(20)
# more lines, but less repetitons
The language provides a few functions for writing elements in the SVG file and for changing the attributes of those elements.
- Drawing functions:
rect,line,ellipse,text,bezier
- Attributes modification functions:
fill,nofill,stroke,nostroke,width,font,rotate,scale,notransform
- Position state functions:
pos,move,clean
- Special functions:
size,title,desc
See examples below to learn more about the language.
- Python 3
- ply :
pip install ply
python svgtarien.py path/to/yourcode.txt
Input :
title("Exemple simple de figure SVG")
desc("Cette figure est constituée d'un rectangle, d'un segment de droite et d'un cercle.")
pos(0, 70) # set the pointer at x=0, y=70fill("green") # set the fill color state to greenmove(100, 80) # move the pointer to (0+100,70+80) = (100,150)rect() # draw a rectangle from the penultimate position to the last positionpos(5, 5)
move(245, 90)
nofill() # reset the fill color statestroke("red") # set the stroke color to redline(2) # draw a line linking the two last positions setpos(90, 80)
width(4) # set the stoke-width attribute to 4 pixelsellipse(50) # draw a 50px-radius circlepos(180, 60)
text("Un texte")
Output code :
<?xml version="1.0" encoding="utf-8"?>
<svgxmlns="http://www.w3.org/2000/svg"version="1.1"width="250.0"height="150.0">
<title>Exemple simple de figure SVG</title>
<desc>
Cette figure est constituée d'un rectangle,
d'un segment de droite et d'un cercle.
</desc>
<rectx="0.0"y="70.0"width="100.0"height="80.0"fill="green" />
<polylinepoints="250.0,95.0 5.0,5.0 "stroke="red" />
<ellipsecx="90.0"cy="80.0"rx="50.0"ry="50.0"stroke-width="4.0"stroke="red" />
<textx="180.0"y="60.0" >Un texte</text>
</svg>
Output image :

Input :
pos(100,50) # set postion cursor at x=100 and y=50fill("red") # set the fill color of next elements to redstroke("#ffff00") # set the stroke color of next elements to yellow using hexadecimal notationwidth(5) # set the stroke widthrect(75) # draw a 75px red square starting at (100,50) with a 5px yellow strokenostroke() # reset the stroke attributes (color and width)fill(0, 0, 255, 0.5) # set the fill color to semi-transparent-blue using rgba notationmove(200, 0) # move the postition cursor by 200px to the right, new position is (300,50)move(50,200) # new position is (350,250)rect() # draw a semi-transparent-blue rectangle with no stroke from (300,50) to (350,250)Output :

Shapes are drawn using the current attributes (state) of the program.
The position and size of the shape you draw is defined by the last positions you set.
Before calling a shape function, like rect or line, you need to set or move the position pointer 2 times.
The size of the SVG image is automatically detect, you can also use the size(w,h) function to fix it.
The rect function accepts 0, 1 or 2 parameters. If no parameters is passed, the rectangle is drawn using the two last positions in the history.
Input :
size(300, 150) # fix the image sizepos(20,20)
pos(150,100)
fill("red")
rect() # draw a red rectangle from (20,20) to (150,100)rect(50) # draw a 50px-wide red square starting at (150,100)fill("none")
stroke("blue")
rect(100,20) # draw a 20x100 blue frame starting at (150,100)
Output :

The ellipse function accepts 1 or 2 paramters. An ellipse with one parameter is a circle.
Input :
size(300, 150) # fix the image sizepos(150,75) # postition at the centerfill("red")
ellipse(50) # draw a red circlefill("blue")
ellipse(80,20) # draw a blue ellipse centered on the same point
Output :

By default, the line function draws a polyline passing through all postitions in history. However, you can pass a parameter to the line function that defines the number of points used to draw the line. You can also use the clean function to reset the position history.
Input :
fill("none") # by default, polylines are filled, you must set this if you juste want linesstroke("black") # you must also define a stroke color, otherwise you won't see anythingwidth(10) # set the stroke-width attributepos(0,0) # history : [(0,0)]move(50,20) # history : [(0,0),(50,20)] move(30,60) # history : [(0,0),(50,20),(80,80)]line() # draw a line passing through the 3 points in historywidth(4)
move(100,-30) # history : [(0,0),(50,20),(80,80),(180,50)]stroke("red")
line(3) # draw a red line using the 3 last positions in historyclean() # history : []pos(300,100) # history : [(300,100)]move(-100,50) # history : [(300,100),(200,150)]move(0,20) # history : [(300,100),(200,150),(300,170)]stroke("blue")
line() # draw a line passing through all the 3 points in history
Output :

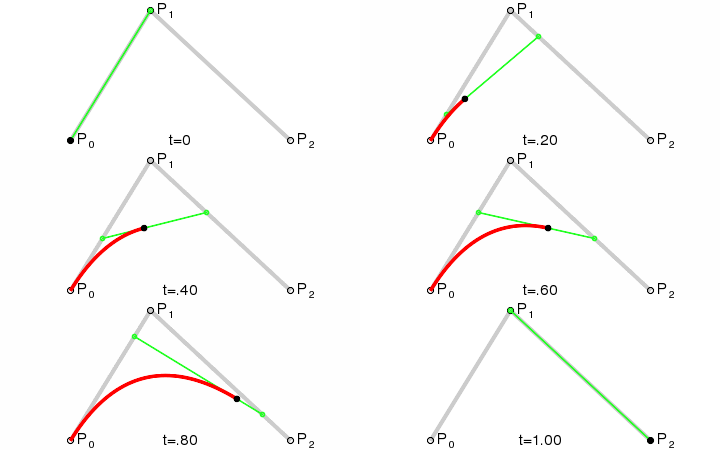
The bezier function allows you to draw quardatic bezier curves using the 3 last points in history.
Input :
size(300,150) # fix the image sizefill("red")
pos(50,30)
ellipse(10) # first control point at (50,30)move(50,100)
ellipse(10) # second control point at (100,130)move(180,-80)
ellipse(10) # third control point at (280,50)fill("none") # I don't want my bezier curve to be filledstroke("black") # it won't appear if it has no strokewidth(5)
bezier() # draw a bezier curve using the 3 control points
Output :

You can add a parameter to the bezier function if you want the curve to be closed : bezier(1) :

You can customise texts using the font function. The first argument is the new font size. The optionnal second argument is a CSS font family name like Times or Helvetica or a generic name like serif, monospace etc... (see font-family on the MDN).
Input :
size(870,150)
pos(20,20)
text("SVGtarien")
move(150,30)
font(32)
text("is really")
move(150,30)
font(32, "Sans-serif")
text("amazing")
move(150,30)
font(32, "cursive")
text("powerful")
move(150,30)
font(32, "fantasy")
text("revolutionnary !")
Output :

Everything you draw can be scaled and rotated. Be aware of that every times you call rotate or scale, the transformation will be added to a list of transformations in the SVG "transform" attribute of the next elements. To avoid that, you may need to remove this attribute using the notransform function.
Input :
size(400,150)
# black textpos(50,50)
text("SVGtarien")
# blue textrotate(45) # rotate by 45 degrees in clockwise direction# the rotation point is the last position (50,50)fill("blue")
text("Est-ce végétarien ?")
# blue squarenotransform() # reinitialize the transform attribute# otherwise next transformations will be added to previous onespos(150,100)
rect(30)
# red rectanglepos(50,50)
rotate(-20) # rotate by 20 degrees in anticlockwise directionscale(3,2) # everything will be expanded 3 times horizontally and 2 times vertically# including positions -> (50,50) will be (150,100)fill("red")
rect(30)
Output :

Variables are prefixed with $. You can define a variable like this : $x = 12
You can use these mathematical operators : +, -, *, /, % (modulo) and ^ (power).
You can loop using the while statement.
Draw 10 circles of radius 20, spaced by 80 pixels :
size(870,150)
pos(0, 75)
$i=0while ($i<10){
move(80,0)
ellipse(20)
$i= $i+1
}
Output :

Similar to other programming languages. The most common comparison operators are supported : ==, !=, <, >, <= and >=.
You can also pass a value in the condition, everything except 0 is true. if 1 { #executed } else { #not executed }
Input :
size(870,150)
$x=10while($x<=870){
pos($x, 10)
# if x is evenif($x%2==0){
fill("red")
}else{
fill("blue")
}
rect(50)
$x= $x+75
}
Output :

There is a few provided functions you may need to use :
- Trigonometric functions :
sin,cos,tantakes a radian angle as parameter - Conversion :
sfor string andifor integer (by default, all numbers are float) - Pseudo-random numbers generator :
randaccept 0, 1 or 2 parametersrand()returns a floating point number between 0 and 1 (excluded)rand(12)returns a integer between 0 and 11rand(-12, 12)returns a integer between -12 and 11
- Debugging : the
debugfunction may help, it just prints the given arguments values in the console.
Example using sin, s and debug :
$w=870
$h=150size($w,$h)
$PI=3.14159265359
$x=0while($x<= $w){
$norm_x= $PI*4* $x/ $w# normalize x so it varies between 0 and 4π (two periods)
$y=sin($norm_x) # compute the sinus of this debug("sin("+s($norm_x)+") =", $y) # prints the raw value of y [-1, 1] in the console# note that we need to convert $norm_x before concatenate it to a string
$y= $h/2- $y* $h/2# y-shift and amplification relatively to the image heightpos($x,$y)
$x= $x+10
}
stroke("black")
fill("none")
line() # draw a line passing through the 87 positions set
Output :

Example using rand and i :
$w=870
$h=150size($w,$h)
$x=0while($x<= $w){
$y=rand($h) # choose a random vertical positionpos($x,$y)
$red=255*$x/$w# set the red component relative to horizontal position
$green=255- $red# the green component is the inverse
$blue=255*$y/$h# set the blue component relative to vertical position
$alpha=rand() # the opacity is totally randomfill($red, $green, $blue, $alpha)
ellipse(i(25- $alpha*25)) # draw a circle with radius inversely proportional to its opacity
$x= $x+1# iterate through each horizontal pixel
}
Output :

You can define your own routines. A routine takes no arguments and returns no values. It just may help execute repetitve tasks. Since every variable is global, you can use them to modify the behavior of the routine. Results can also be stored in varibales.
Input :
size(870,150)
# define a new routine that draws a smiley using the $color variable.# of course $color must be defined before calling this routinedrawSmiley= {
# headfill($color)
stroke("black")
width(2)
ellipse(40)
# mouthmove(-20,10)
move(40,0)
line(2)
move(-20,-10) # set cursor back in center# eyesnostroke()
fill("black")
move(-10,-10)
ellipse(4,8)
move(20,0)
ellipse(4,8)
move(-10,10) # set cursor back in center
}
$color="yellow"pos(75,75)
drawSmiley()
$color="pink"move(100,0)
rotate(20)
drawSmiley()
notransform()
scale(2)
$color="cyan"drawSmiley()
move(100,-50)
$color="none"drawSmiley()
Output :

Here is another routine exemple featuring a simple console imitation :
$w=870
$h=150size($w,$h)
font(14, "monospace")
$cpt=0# this routine prints the $text variable in a new line on the top-left cornerdebugTxt= {
pos(0, $cpt*20)
fill("black")
rect(250,20)
fill("white")
move(10,12)
text($text)
$cpt= $cpt+1
}
$text="Console"debugTxt()
$i=0while($i<6){
# choose a random color red or blueif (rand() <0.5){ $color="blue" }
else{ $color="red" }
fill($color)
# set a random position
$x=rand(270, $w-20)
$y=rand(20, $h-20)
pos($x,$y)
ellipse(20)
# print a debug message in the pseudo-console
$text= $color+" circle drawn at ("+s($x) +","+s($y) +")"debugTxt()
$i= $i+1
}
Output :