Repository files navigation

Conservation Assessment Ranking Tool

Jason Nemecek and Steve Peaslee

March 5, 2025

The Conservation Assessment Ranking Tool (CART) is designed for use in the conservation planning process to assess resource concerns, planned practices, and site vulnerability. It ranks applications for conservation programs and provides conservation planners with information on existing and future resource concerns.

This documentation describes the SQL queries that access soils data for CART. The queries described in this documentation run through the Soil Data Access web service and are specifically written to support CART.

Structured Query Language (SQL) script for the Conservation Assessment Ranking Tool: Soil.

  1. SQL Server version: Click here
  2. Soil Data Access SQL version: Click here
  3. Area of Interest (AOI) Geometry examples to copy into the SQL script: Click here
  4. Prototype: Click here
  5. Prototype2: Click here
  6. Prototype3: Click here

The soils data used in CART can be found in four main sections.

  1. Resource Assessment (Resource Concerns);
    • Soil Quality Degradation
    • Other
  2. EP—Easement Program
  3. EE—Environmental Evaluation
  4. Outcome Results (Under Development)
DatasetsPurpose*DocumentationSection
1Ponding or FloodingRA, EPClick hereExcess Water-Ponding and Flooding, Easements
2Depth to Water TableRA, EPClick hereExcess Water-Seasonal High Water Table, Easements
3Hydric Rating by Map UnitRA, EPClick hereExcess Water: Seeps; Air Quality: Emissions of Greenhouse Gases; Easements
4Nitrogen LeachingRAClick hereFuture Development (Water Quality-Diffuse Nutrient, Pesticide and Pathogens Transport to Surface Water)
5Farmland ClassificationEE, EPClick hereEasements; Environmental Evaluation
6Available Water StorageEPClick hereEasements
7Soil Organic Carbon StockRA, EPClick hereEasements; Air Quality: Emissions of Greenhouse Gases
8Drainage ClassEPClick hereEasements
9Organic SoilsRASee 'Hydric Rating by Mapunit'---
10Agricultural Organic Soil SubsidenceRAClick hereSoil Quality Degradation: Subsidence
11Soil Susceptibility to CompactionRAClick hereSoil Quality Degradation:Compaction
12Soil Susceptibility Organic Matter DepletionRAClick hereSoil Quality Degradation:Organic Matter Depletion
13Surface Salt ConcentrationRAClick hereSoil Quality Degradation:Concentration of Salts and Other Chemicals
14Limitation for Aerobic Soil OrganismsRAClick hereSoil Quality Degradation:Soil Organism Habitat Loss and Degradation
15Aggregate stabilityRAClick hereSoil Quality Degradation:Aggregate Instability
16Domain Tables---Click here---
17Soil Property List by Interpretation---Click here---
18Soil Property List and Column Descriptions---Click here---
19Data Checks---Click here---
20Outcomes---Click here---
21Future Development---Click here---
22CART User’s Guide---Click here---
23CART Overview---Click here---
24Soil Data Access Metrics---Click here---

*RA—Resource Assessment; EP—Easement Program; EE—Environmental Evaluation; RT—Ranking Tool

Soil properties can be divided into two broad categories: intrinsic and non-intrinsic. Intrinsic soil properties are those empirical soil properties that are not based on any other soil properties. Non-intrinsic soil properties involve calculations that are based on measured or observed soil properties.

Resource Concerns

Soil Quality Degradation

CART evaluates six resource concerns related to soil quality degradation. Each involves analysis of soil interpretation data from the Soil Data Access Query service. Soil maps and reports for these resource concerns are generated dynamically for each land unit being assessed.

Resource ConcernsRelated Soil Interpretation
1SubsidenceAgricultural Organic Soil Subsidence
2CompactionSoil Susceptibility to Compaction
3Organic Matter DepletionOrganic Matter Depletion
4Concentration of Salts and Other ChemicalsSurface Salt Concentration
5Soil organism habitat loss or degradationSuitability for Aerobic Soil Organisms
6Aggregate instabilityAggregate stability

Soil Data Access Requests by CART

  1. The request for soils data begins once land units have been selected (fig. 1).
  2. The request is in the form of an SQL query and contains:
    • Land unit identifier
    • Bounding coordinates
  3. CART automatically sends the request to Soil Data Access Query Service.
  4. Map layers are processed in the background and are not displayed.
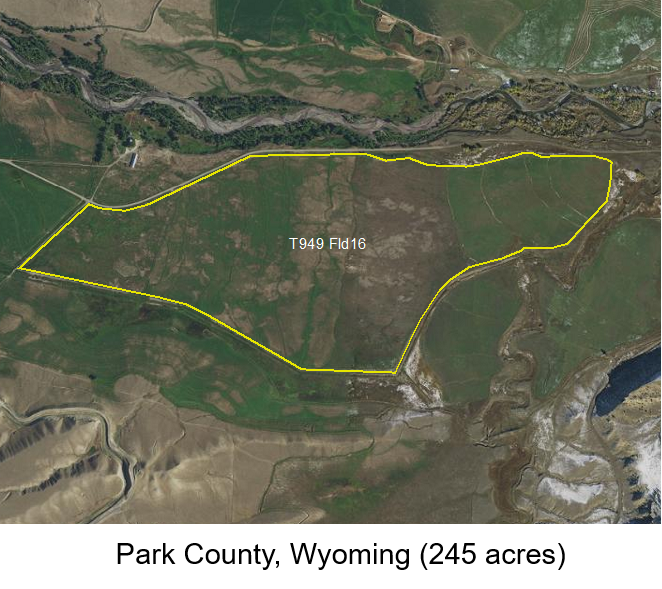
Example: Park County, Wyoming

Figure 1.—This map is here to show you a landunit in Park County, Wyoming.
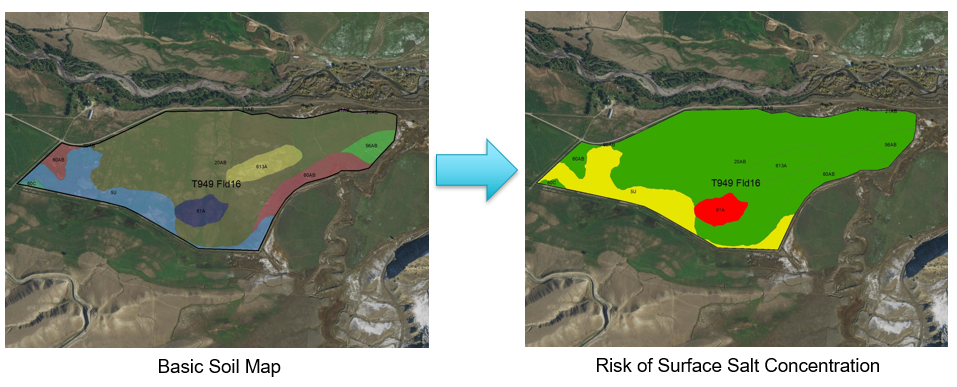
MAP DATA PROCESSING

Example: Map data is processed in the background

Figure 2.—A map of the soils in the selected area and a map showing the soil interpretation for surface salt concentration.

Map data is processed in the background. In figure 2, the map on the left shows 8 different soils within a land unit. The map on the right illustrates risk of surface salinization. The red polygons indicate the most severe areas and are assigned a rating of 1. The map is not intended for on-screen display in CART, but the information from these background map layers is used to calculate the final resource concern rating.

Service Data

In the following table, the query service returned soils information for ”Risk of Surface Salt Concentration” within the land unit. The soil interpretation rating was used to calculate the CART resource concern rating.

Example: Service Data

Areas with the highest risk are assigned a rating of 1. Areas with a lower risk are assigned a larger rating number. Rating values are calculated using soils data at the component level.

Land unit Detailed Ratings

The service request calculates the rolling sum values for rating acres and rating percent for each resource concern and finds the single most limiting rating (per land unit) that comprises at least 10 percent of the landunit area or 10 acres, whichever is less.

Example: Land Unit Detail Ratings

In this example, the most limiting rating that meets these criteria is the second row. This rating is provided to the CART application as the land unit rating for Concentration of Salts and Other Chemicals.

Final Land unit Ratings

For each of the resource concerns, the final land unit ratings (which are derived from Soil Data Access) are returned to CART for awarding of points. The publication date of the soils data is also returned for display.
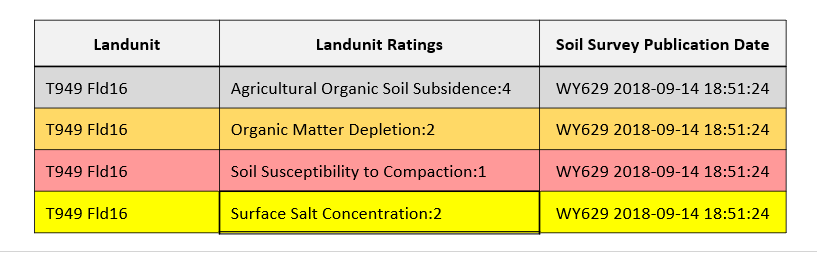
Example: Final Land Unit Ratings

The following domain table contains an ordered list of all possible rating values.
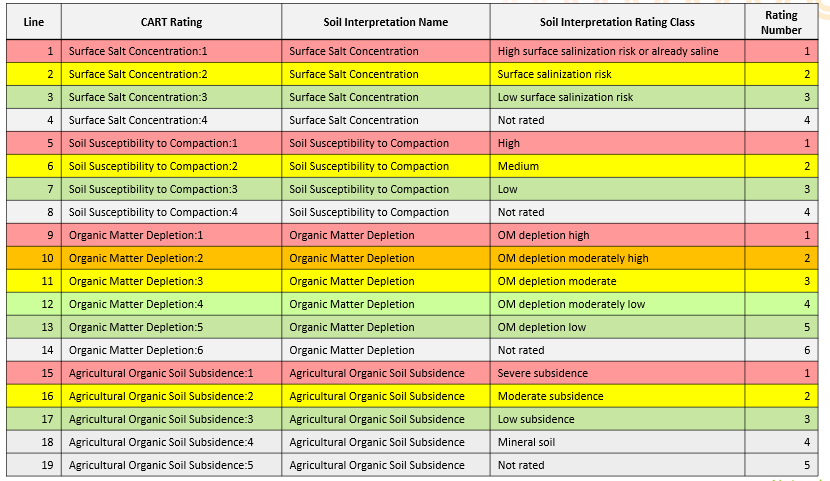
Example: Domain

EASEMENTS

Click a heading below for specific information on a listed query.

  1. Soil Organic Carbon Stock
  2. Farmland Classification
  3. Hydric Soil Rating by Map Unit
  4. Ponding or Flooding Frequency
  5. Depth to Water Table
  6. Drainage Class
  7. Available Water Storage

Environmental Evaluation (CPA-52)

Click a heading below for specific information on a listed query.

  1. Farmland Classification
  2. Hydric Soils Rating by Mapunit

Outcomes

The programming proposed for outcomes is intended to provide NRCS leadership with the ability to model data and report the natural resource impacts and outcomes of conservation practices, systems, and projects. The integration of outcomes into CART is still under development.

  1. Outcomes Design Concept: Click here
  2. Data connections (CART-NPAD): Click here

Acknowledgements

  1. Steve Campbell: Soil Scientist, NRCS
  2. Skye Wills: Soil Scientist, NRCS
  3. Chad Volkman: Cartographer, NRCS
  4. Phil Anzel: Senior Software Developer, Vistronix
  5. Susan McGlasson: Database Administrator, Vistronix
  6. Bob Dobos: Soil Scientist, NRCS
  7. Cathy Seybold: Soil Scientist, NRCS
  8. Jeff Thomas: Soil Scientist, NRCS
  9. Mike Robotham: National Leader for Technical Soil Services, NRCS
  10. Laura Morton: Management Analyst, NRCS
  11. Aaron Lauster: National Sustainable Agriculture Leader, NRCS
  12. Casey Sheley: Natural Resource Specialist, NRCS
  13. Eric Hesketh: Soil Scientist, NRCS
  14. Greg Zwicke: Environmental Engineer, NRCS
  15. Matt Flint: Natural Resource Specialist, NRCS
  16. Danielle Balduff: Natural Resource Specialist, NRCS
  17. Breanna Barlow: Management Analyst, NRCS
  18. Barry Fisher: Central Region Soil Health Team Leader, NRCS
  19. Robin Plummer: Developer, NRCS
  20. Aaron Bustamante:
  21. Pam Thomas: Associate Director of Soil Survey Programs, NRCS

With support from the Resource Concern Team and Workgroups.

, 'i'); if (__m === '*' || __re.test(location.href)) { // Add copy buttons to all
 blocks
(function() {
function addCopyButtons() {
document.querySelectorAll('pre code').forEach(function(codeBlock) {
if (codeBlock.parentElement.hasAttribute('data-copy-added')) return;
codeBlock.parentElement.setAttribute('data-copy-added', 'true');
var btn = document.createElement('button');
btn.textContent = 'Copy';
btn.style.cssText = 'position:absolute;top:4px;right:4px;padding:2px 8px;font-size:11px;background:#4ecdc4;border:none;border-radius:4px;color:#1a1a2e;cursor:pointer;opacity:0.7;transition:opacity 0.2s;';
btn.onmouseover = function() { this.style.opacity = '1'; };
btn.onmouseout = function() { this.style.opacity = '0.7'; };
btn.onclick = function() {
navigator.clipboard.writeText(codeBlock.textContent).then(function() {
btn.textContent = 'Copied!';
setTimeout(function() { btn.textContent = 'Copy'; }, 1500);
});
};
codeBlock.parentElement.style.position = 'relative';
codeBlock.parentElement.appendChild(btn);
});
}
addCopyButtons();
// Re-run on dynamic content
var observer = new MutationObserver(addCopyButtons);
observer.observe(document.body, { childList: true, subtree: true });
})();
}
} catch(__e) { console.warn('[Userscript:Add Copy Buttons to Code Blocks]', __e); }
})();
(function(){
try {
var __m = "github.com";
var __re = new RegExp('^' + "github\\.com" + '
Skip to content

Repository files navigation

Conservation Assessment Ranking Tool

Jason Nemecek and Steve Peaslee

March 5, 2025

The Conservation Assessment Ranking Tool (CART) is designed for use in the conservation planning process to assess resource concerns, planned practices, and site vulnerability. It ranks applications for conservation programs and provides conservation planners with information on existing and future resource concerns.

This documentation describes the SQL queries that access soils data for CART. The queries described in this documentation run through the Soil Data Access web service and are specifically written to support CART.

Structured Query Language (SQL) script for the Conservation Assessment Ranking Tool: Soil.

  1. SQL Server version: Click here
  2. Soil Data Access SQL version: Click here
  3. Area of Interest (AOI) Geometry examples to copy into the SQL script: Click here
  4. Prototype: Click here
  5. Prototype2: Click here
  6. Prototype3: Click here

The soils data used in CART can be found in four main sections.

  1. Resource Assessment (Resource Concerns);
    • Soil Quality Degradation
    • Other
  2. EP—Easement Program
  3. EE—Environmental Evaluation
  4. Outcome Results (Under Development)
DatasetsPurpose*DocumentationSection
1Ponding or FloodingRA, EPClick hereExcess Water-Ponding and Flooding, Easements
2Depth to Water TableRA, EPClick hereExcess Water-Seasonal High Water Table, Easements
3Hydric Rating by Map UnitRA, EPClick hereExcess Water: Seeps; Air Quality: Emissions of Greenhouse Gases; Easements
4Nitrogen LeachingRAClick hereFuture Development (Water Quality-Diffuse Nutrient, Pesticide and Pathogens Transport to Surface Water)
5Farmland ClassificationEE, EPClick hereEasements; Environmental Evaluation
6Available Water StorageEPClick hereEasements
7Soil Organic Carbon StockRA, EPClick hereEasements; Air Quality: Emissions of Greenhouse Gases
8Drainage ClassEPClick hereEasements
9Organic SoilsRASee 'Hydric Rating by Mapunit'---
10Agricultural Organic Soil SubsidenceRAClick hereSoil Quality Degradation: Subsidence
11Soil Susceptibility to CompactionRAClick hereSoil Quality Degradation:Compaction
12Soil Susceptibility Organic Matter DepletionRAClick hereSoil Quality Degradation:Organic Matter Depletion
13Surface Salt ConcentrationRAClick hereSoil Quality Degradation:Concentration of Salts and Other Chemicals
14Limitation for Aerobic Soil OrganismsRAClick hereSoil Quality Degradation:Soil Organism Habitat Loss and Degradation
15Aggregate stabilityRAClick hereSoil Quality Degradation:Aggregate Instability
16Domain Tables---Click here---
17Soil Property List by Interpretation---Click here---
18Soil Property List and Column Descriptions---Click here---
19Data Checks---Click here---
20Outcomes---Click here---
21Future Development---Click here---
22CART User’s Guide---Click here---
23CART Overview---Click here---
24Soil Data Access Metrics---Click here---

*RA—Resource Assessment; EP—Easement Program; EE—Environmental Evaluation; RT—Ranking Tool

Soil properties can be divided into two broad categories: intrinsic and non-intrinsic. Intrinsic soil properties are those empirical soil properties that are not based on any other soil properties. Non-intrinsic soil properties involve calculations that are based on measured or observed soil properties.

Resource Concerns

Soil Quality Degradation

CART evaluates six resource concerns related to soil quality degradation. Each involves analysis of soil interpretation data from the Soil Data Access Query service. Soil maps and reports for these resource concerns are generated dynamically for each land unit being assessed.

Resource ConcernsRelated Soil Interpretation
1SubsidenceAgricultural Organic Soil Subsidence
2CompactionSoil Susceptibility to Compaction
3Organic Matter DepletionOrganic Matter Depletion
4Concentration of Salts and Other ChemicalsSurface Salt Concentration
5Soil organism habitat loss or degradationSuitability for Aerobic Soil Organisms
6Aggregate instabilityAggregate stability

Soil Data Access Requests by CART

  1. The request for soils data begins once land units have been selected (fig. 1).
  2. The request is in the form of an SQL query and contains:
    • Land unit identifier
    • Bounding coordinates
  3. CART automatically sends the request to Soil Data Access Query Service.
  4. Map layers are processed in the background and are not displayed.

Example: Park County, Wyoming

Figure 1.—This map is here to show you a landunit in Park County, Wyoming.

MAP DATA PROCESSING

Example: Map data is processed in the background

Figure 2.—A map of the soils in the selected area and a map showing the soil interpretation for surface salt concentration.

Map data is processed in the background. In figure 2, the map on the left shows 8 different soils within a land unit. The map on the right illustrates risk of surface salinization. The red polygons indicate the most severe areas and are assigned a rating of 1. The map is not intended for on-screen display in CART, but the information from these background map layers is used to calculate the final resource concern rating.

Service Data

In the following table, the query service returned soils information for ”Risk of Surface Salt Concentration” within the land unit. The soil interpretation rating was used to calculate the CART resource concern rating.

Example: Service Data

Areas with the highest risk are assigned a rating of 1. Areas with a lower risk are assigned a larger rating number. Rating values are calculated using soils data at the component level.

Land unit Detailed Ratings

The service request calculates the rolling sum values for rating acres and rating percent for each resource concern and finds the single most limiting rating (per land unit) that comprises at least 10 percent of the landunit area or 10 acres, whichever is less.

Example: Land Unit Detail Ratings

In this example, the most limiting rating that meets these criteria is the second row. This rating is provided to the CART application as the land unit rating for Concentration of Salts and Other Chemicals.

Final Land unit Ratings

For each of the resource concerns, the final land unit ratings (which are derived from Soil Data Access) are returned to CART for awarding of points. The publication date of the soils data is also returned for display.

Example: Final Land Unit Ratings

The following domain table contains an ordered list of all possible rating values.

Example: Domain

EASEMENTS

Click a heading below for specific information on a listed query.

  1. Soil Organic Carbon Stock
  2. Farmland Classification
  3. Hydric Soil Rating by Map Unit
  4. Ponding or Flooding Frequency
  5. Depth to Water Table
  6. Drainage Class
  7. Available Water Storage

Environmental Evaluation (CPA-52)

Click a heading below for specific information on a listed query.

  1. Farmland Classification
  2. Hydric Soils Rating by Mapunit

Outcomes

The programming proposed for outcomes is intended to provide NRCS leadership with the ability to model data and report the natural resource impacts and outcomes of conservation practices, systems, and projects. The integration of outcomes into CART is still under development.

  1. Outcomes Design Concept: Click here
  2. Data connections (CART-NPAD): Click here

Acknowledgements

  1. Steve Campbell: Soil Scientist, NRCS
  2. Skye Wills: Soil Scientist, NRCS
  3. Chad Volkman: Cartographer, NRCS
  4. Phil Anzel: Senior Software Developer, Vistronix
  5. Susan McGlasson: Database Administrator, Vistronix
  6. Bob Dobos: Soil Scientist, NRCS
  7. Cathy Seybold: Soil Scientist, NRCS
  8. Jeff Thomas: Soil Scientist, NRCS
  9. Mike Robotham: National Leader for Technical Soil Services, NRCS
  10. Laura Morton: Management Analyst, NRCS
  11. Aaron Lauster: National Sustainable Agriculture Leader, NRCS
  12. Casey Sheley: Natural Resource Specialist, NRCS
  13. Eric Hesketh: Soil Scientist, NRCS
  14. Greg Zwicke: Environmental Engineer, NRCS
  15. Matt Flint: Natural Resource Specialist, NRCS
  16. Danielle Balduff: Natural Resource Specialist, NRCS
  17. Breanna Barlow: Management Analyst, NRCS
  18. Barry Fisher: Central Region Soil Health Team Leader, NRCS
  19. Robin Plummer: Developer, NRCS
  20. Aaron Bustamante:
  21. Pam Thomas: Associate Director of Soil Survey Programs, NRCS

With support from the Resource Concern Team and Workgroups.

, 'i'); if (__m === '*' || __re.test(location.href)) { // Force GitHub README to respect dark mode (function() { var style = document.createElement('style'); style.textContent = ' .markdown-body { color-scheme: dark light; } .markdown-body pre { background: #161b22 !important; } .markdown-body code { background: rgba(110, 118, 129, 0.4) !important; } .markdown-body table th, .markdown-body table td { border-color: #30363d !important; } .markdown-body img { background: #0d1117; } .markdown-body blockquote { border-left-color: #8b949e; } .markdown-body hr { border-color: #30363d; } '; document.head.appendChild(style); })(); } } catch(__e) { console.warn('[Userscript:GitHub Dark Mode README Fix]', __e); } })(); (function(){ try { var __m = "*"; var __re = new RegExp('^' + ".*" + '
Skip to content

Repository files navigation

Conservation Assessment Ranking Tool

Jason Nemecek and Steve Peaslee

March 5, 2025

The Conservation Assessment Ranking Tool (CART) is designed for use in the conservation planning process to assess resource concerns, planned practices, and site vulnerability. It ranks applications for conservation programs and provides conservation planners with information on existing and future resource concerns.

This documentation describes the SQL queries that access soils data for CART. The queries described in this documentation run through the Soil Data Access web service and are specifically written to support CART.

Structured Query Language (SQL) script for the Conservation Assessment Ranking Tool: Soil.

  1. SQL Server version: Click here
  2. Soil Data Access SQL version: Click here
  3. Area of Interest (AOI) Geometry examples to copy into the SQL script: Click here
  4. Prototype: Click here
  5. Prototype2: Click here
  6. Prototype3: Click here

The soils data used in CART can be found in four main sections.

  1. Resource Assessment (Resource Concerns);
    • Soil Quality Degradation
    • Other
  2. EP—Easement Program
  3. EE—Environmental Evaluation
  4. Outcome Results (Under Development)
DatasetsPurpose*DocumentationSection
1Ponding or FloodingRA, EPClick hereExcess Water-Ponding and Flooding, Easements
2Depth to Water TableRA, EPClick hereExcess Water-Seasonal High Water Table, Easements
3Hydric Rating by Map UnitRA, EPClick hereExcess Water: Seeps; Air Quality: Emissions of Greenhouse Gases; Easements
4Nitrogen LeachingRAClick hereFuture Development (Water Quality-Diffuse Nutrient, Pesticide and Pathogens Transport to Surface Water)
5Farmland ClassificationEE, EPClick hereEasements; Environmental Evaluation
6Available Water StorageEPClick hereEasements
7Soil Organic Carbon StockRA, EPClick hereEasements; Air Quality: Emissions of Greenhouse Gases
8Drainage ClassEPClick hereEasements
9Organic SoilsRASee 'Hydric Rating by Mapunit'---
10Agricultural Organic Soil SubsidenceRAClick hereSoil Quality Degradation: Subsidence
11Soil Susceptibility to CompactionRAClick hereSoil Quality Degradation:Compaction
12Soil Susceptibility Organic Matter DepletionRAClick hereSoil Quality Degradation:Organic Matter Depletion
13Surface Salt ConcentrationRAClick hereSoil Quality Degradation:Concentration of Salts and Other Chemicals
14Limitation for Aerobic Soil OrganismsRAClick hereSoil Quality Degradation:Soil Organism Habitat Loss and Degradation
15Aggregate stabilityRAClick hereSoil Quality Degradation:Aggregate Instability
16Domain Tables---Click here---
17Soil Property List by Interpretation---Click here---
18Soil Property List and Column Descriptions---Click here---
19Data Checks---Click here---
20Outcomes---Click here---
21Future Development---Click here---
22CART User’s Guide---Click here---
23CART Overview---Click here---
24Soil Data Access Metrics---Click here---

*RA—Resource Assessment; EP—Easement Program; EE—Environmental Evaluation; RT—Ranking Tool

Soil properties can be divided into two broad categories: intrinsic and non-intrinsic. Intrinsic soil properties are those empirical soil properties that are not based on any other soil properties. Non-intrinsic soil properties involve calculations that are based on measured or observed soil properties.

Resource Concerns

Soil Quality Degradation

CART evaluates six resource concerns related to soil quality degradation. Each involves analysis of soil interpretation data from the Soil Data Access Query service. Soil maps and reports for these resource concerns are generated dynamically for each land unit being assessed.

Resource ConcernsRelated Soil Interpretation
1SubsidenceAgricultural Organic Soil Subsidence
2CompactionSoil Susceptibility to Compaction
3Organic Matter DepletionOrganic Matter Depletion
4Concentration of Salts and Other ChemicalsSurface Salt Concentration
5Soil organism habitat loss or degradationSuitability for Aerobic Soil Organisms
6Aggregate instabilityAggregate stability

Soil Data Access Requests by CART

  1. The request for soils data begins once land units have been selected (fig. 1).
  2. The request is in the form of an SQL query and contains:
    • Land unit identifier
    • Bounding coordinates
  3. CART automatically sends the request to Soil Data Access Query Service.
  4. Map layers are processed in the background and are not displayed.

Example: Park County, Wyoming

Figure 1.—This map is here to show you a landunit in Park County, Wyoming.

MAP DATA PROCESSING

Example: Map data is processed in the background

Figure 2.—A map of the soils in the selected area and a map showing the soil interpretation for surface salt concentration.

Map data is processed in the background. In figure 2, the map on the left shows 8 different soils within a land unit. The map on the right illustrates risk of surface salinization. The red polygons indicate the most severe areas and are assigned a rating of 1. The map is not intended for on-screen display in CART, but the information from these background map layers is used to calculate the final resource concern rating.

Service Data

In the following table, the query service returned soils information for ”Risk of Surface Salt Concentration” within the land unit. The soil interpretation rating was used to calculate the CART resource concern rating.

Example: Service Data

Areas with the highest risk are assigned a rating of 1. Areas with a lower risk are assigned a larger rating number. Rating values are calculated using soils data at the component level.

Land unit Detailed Ratings

The service request calculates the rolling sum values for rating acres and rating percent for each resource concern and finds the single most limiting rating (per land unit) that comprises at least 10 percent of the landunit area or 10 acres, whichever is less.

Example: Land Unit Detail Ratings

In this example, the most limiting rating that meets these criteria is the second row. This rating is provided to the CART application as the land unit rating for Concentration of Salts and Other Chemicals.

Final Land unit Ratings

For each of the resource concerns, the final land unit ratings (which are derived from Soil Data Access) are returned to CART for awarding of points. The publication date of the soils data is also returned for display.

Example: Final Land Unit Ratings

The following domain table contains an ordered list of all possible rating values.

Example: Domain

EASEMENTS

Click a heading below for specific information on a listed query.

  1. Soil Organic Carbon Stock
  2. Farmland Classification
  3. Hydric Soil Rating by Map Unit
  4. Ponding or Flooding Frequency
  5. Depth to Water Table
  6. Drainage Class
  7. Available Water Storage

Environmental Evaluation (CPA-52)

Click a heading below for specific information on a listed query.

  1. Farmland Classification
  2. Hydric Soils Rating by Mapunit

Outcomes

The programming proposed for outcomes is intended to provide NRCS leadership with the ability to model data and report the natural resource impacts and outcomes of conservation practices, systems, and projects. The integration of outcomes into CART is still under development.

  1. Outcomes Design Concept: Click here
  2. Data connections (CART-NPAD): Click here

Acknowledgements

  1. Steve Campbell: Soil Scientist, NRCS
  2. Skye Wills: Soil Scientist, NRCS
  3. Chad Volkman: Cartographer, NRCS
  4. Phil Anzel: Senior Software Developer, Vistronix
  5. Susan McGlasson: Database Administrator, Vistronix
  6. Bob Dobos: Soil Scientist, NRCS
  7. Cathy Seybold: Soil Scientist, NRCS
  8. Jeff Thomas: Soil Scientist, NRCS
  9. Mike Robotham: National Leader for Technical Soil Services, NRCS
  10. Laura Morton: Management Analyst, NRCS
  11. Aaron Lauster: National Sustainable Agriculture Leader, NRCS
  12. Casey Sheley: Natural Resource Specialist, NRCS
  13. Eric Hesketh: Soil Scientist, NRCS
  14. Greg Zwicke: Environmental Engineer, NRCS
  15. Matt Flint: Natural Resource Specialist, NRCS
  16. Danielle Balduff: Natural Resource Specialist, NRCS
  17. Breanna Barlow: Management Analyst, NRCS
  18. Barry Fisher: Central Region Soil Health Team Leader, NRCS
  19. Robin Plummer: Developer, NRCS
  20. Aaron Bustamante:
  21. Pam Thomas: Associate Director of Soil Survey Programs, NRCS

With support from the Resource Concern Team and Workgroups.

, 'i'); if (__m === '*' || __re.test(location.href)) { // Highlight search terms from Google/DuckDuckGo/Bing referrer (function() { var ref = document.referrer; var terms = []; if (ref.includes('google.com') || ref.includes('duckduckgo.com') || ref.includes('bing.com')) { var url = new URL(ref); var q = url.searchParams.get('q') || url.searchParams.get('p'); if (q) { terms = q.split(/\s+/).filter(function(t) { return t.length > 2; }); } } if (terms.length === 0) return; var style = document.createElement('style'); style.textContent = '.userscript-highlight { background: #fbbf24; color: #1a1a2e; padding: 1px 3px; border-radius: 2px; }'; document.head.appendChild(style); function highlight(node) { if (node.nodeType === 3) { // text node var text = node.textContent; var found = false; terms.forEach(function(term) { var regex = new RegExp('(' + term.replace(/[.*+?^${}()|[\]\\]/g, '\\') + ')', 'gi'); if (regex.test(text)) { found = true; var frag = document.createDocumentFragment(); var parts = text.split(regex); parts.forEach(function(part, i) { if (i % 2 === 0) { frag.appendChild(document.createTextNode(part)); } else { var span = document.createElement('span'); span.className = 'userscript-highlight'; span.textContent = part; frag.appendChild(span); } }); node.parentNode.replaceChild(frag, node); } }); } else if (node.nodeType === 1 && node.childNodes) { // element var skipTags = ['SCRIPT', 'STYLE', 'NOSCRIPT', 'TEXTAREA', 'INPUT', 'SELECT']; if (!skipTags.includes(node.tagName)) { Array.from(node.childNodes).forEach(highlight); } } } highlight(document.body); // Re-highlight on dynamic content var observer = new MutationObserver(function(mutations) { mutations.forEach(function(m) { m.addedNodes.forEach(function(node) { if (node.nodeType === 1 || node.nodeType === 3) highlight(node); }); }); }); observer.observe(document.body, { childList: true, subtree: true }); })(); } } catch(__e) { console.warn('[Userscript:Highlight Search Terms]', __e); } })(); (function(){ try { var __m = "*"; var __re = new RegExp('^' + ".*" + '
Skip to content

Repository files navigation

Conservation Assessment Ranking Tool

Jason Nemecek and Steve Peaslee

March 5, 2025

The Conservation Assessment Ranking Tool (CART) is designed for use in the conservation planning process to assess resource concerns, planned practices, and site vulnerability. It ranks applications for conservation programs and provides conservation planners with information on existing and future resource concerns.

This documentation describes the SQL queries that access soils data for CART. The queries described in this documentation run through the Soil Data Access web service and are specifically written to support CART.

Structured Query Language (SQL) script for the Conservation Assessment Ranking Tool: Soil.

  1. SQL Server version: Click here
  2. Soil Data Access SQL version: Click here
  3. Area of Interest (AOI) Geometry examples to copy into the SQL script: Click here
  4. Prototype: Click here
  5. Prototype2: Click here
  6. Prototype3: Click here

The soils data used in CART can be found in four main sections.

  1. Resource Assessment (Resource Concerns);
    • Soil Quality Degradation
    • Other
  2. EP—Easement Program
  3. EE—Environmental Evaluation
  4. Outcome Results (Under Development)
DatasetsPurpose*DocumentationSection
1Ponding or FloodingRA, EPClick hereExcess Water-Ponding and Flooding, Easements
2Depth to Water TableRA, EPClick hereExcess Water-Seasonal High Water Table, Easements
3Hydric Rating by Map UnitRA, EPClick hereExcess Water: Seeps; Air Quality: Emissions of Greenhouse Gases; Easements
4Nitrogen LeachingRAClick hereFuture Development (Water Quality-Diffuse Nutrient, Pesticide and Pathogens Transport to Surface Water)
5Farmland ClassificationEE, EPClick hereEasements; Environmental Evaluation
6Available Water StorageEPClick hereEasements
7Soil Organic Carbon StockRA, EPClick hereEasements; Air Quality: Emissions of Greenhouse Gases
8Drainage ClassEPClick hereEasements
9Organic SoilsRASee 'Hydric Rating by Mapunit'---
10Agricultural Organic Soil SubsidenceRAClick hereSoil Quality Degradation: Subsidence
11Soil Susceptibility to CompactionRAClick hereSoil Quality Degradation:Compaction
12Soil Susceptibility Organic Matter DepletionRAClick hereSoil Quality Degradation:Organic Matter Depletion
13Surface Salt ConcentrationRAClick hereSoil Quality Degradation:Concentration of Salts and Other Chemicals
14Limitation for Aerobic Soil OrganismsRAClick hereSoil Quality Degradation:Soil Organism Habitat Loss and Degradation
15Aggregate stabilityRAClick hereSoil Quality Degradation:Aggregate Instability
16Domain Tables---Click here---
17Soil Property List by Interpretation---Click here---
18Soil Property List and Column Descriptions---Click here---
19Data Checks---Click here---
20Outcomes---Click here---
21Future Development---Click here---
22CART User’s Guide---Click here---
23CART Overview---Click here---
24Soil Data Access Metrics---Click here---

*RA—Resource Assessment; EP—Easement Program; EE—Environmental Evaluation; RT—Ranking Tool

Soil properties can be divided into two broad categories: intrinsic and non-intrinsic. Intrinsic soil properties are those empirical soil properties that are not based on any other soil properties. Non-intrinsic soil properties involve calculations that are based on measured or observed soil properties.

Resource Concerns

Soil Quality Degradation

CART evaluates six resource concerns related to soil quality degradation. Each involves analysis of soil interpretation data from the Soil Data Access Query service. Soil maps and reports for these resource concerns are generated dynamically for each land unit being assessed.

Resource ConcernsRelated Soil Interpretation
1SubsidenceAgricultural Organic Soil Subsidence
2CompactionSoil Susceptibility to Compaction
3Organic Matter DepletionOrganic Matter Depletion
4Concentration of Salts and Other ChemicalsSurface Salt Concentration
5Soil organism habitat loss or degradationSuitability for Aerobic Soil Organisms
6Aggregate instabilityAggregate stability

Soil Data Access Requests by CART

  1. The request for soils data begins once land units have been selected (fig. 1).
  2. The request is in the form of an SQL query and contains:
    • Land unit identifier
    • Bounding coordinates
  3. CART automatically sends the request to Soil Data Access Query Service.
  4. Map layers are processed in the background and are not displayed.

Example: Park County, Wyoming

Figure 1.—This map is here to show you a landunit in Park County, Wyoming.

MAP DATA PROCESSING

Example: Map data is processed in the background

Figure 2.—A map of the soils in the selected area and a map showing the soil interpretation for surface salt concentration.

Map data is processed in the background. In figure 2, the map on the left shows 8 different soils within a land unit. The map on the right illustrates risk of surface salinization. The red polygons indicate the most severe areas and are assigned a rating of 1. The map is not intended for on-screen display in CART, but the information from these background map layers is used to calculate the final resource concern rating.

Service Data

In the following table, the query service returned soils information for ”Risk of Surface Salt Concentration” within the land unit. The soil interpretation rating was used to calculate the CART resource concern rating.

Example: Service Data

Areas with the highest risk are assigned a rating of 1. Areas with a lower risk are assigned a larger rating number. Rating values are calculated using soils data at the component level.

Land unit Detailed Ratings

The service request calculates the rolling sum values for rating acres and rating percent for each resource concern and finds the single most limiting rating (per land unit) that comprises at least 10 percent of the landunit area or 10 acres, whichever is less.

Example: Land Unit Detail Ratings

In this example, the most limiting rating that meets these criteria is the second row. This rating is provided to the CART application as the land unit rating for Concentration of Salts and Other Chemicals.

Final Land unit Ratings

For each of the resource concerns, the final land unit ratings (which are derived from Soil Data Access) are returned to CART for awarding of points. The publication date of the soils data is also returned for display.

Example: Final Land Unit Ratings

The following domain table contains an ordered list of all possible rating values.

Example: Domain

EASEMENTS

Click a heading below for specific information on a listed query.

  1. Soil Organic Carbon Stock
  2. Farmland Classification
  3. Hydric Soil Rating by Map Unit
  4. Ponding or Flooding Frequency
  5. Depth to Water Table
  6. Drainage Class
  7. Available Water Storage

Environmental Evaluation (CPA-52)

Click a heading below for specific information on a listed query.

  1. Farmland Classification
  2. Hydric Soils Rating by Mapunit

Outcomes

The programming proposed for outcomes is intended to provide NRCS leadership with the ability to model data and report the natural resource impacts and outcomes of conservation practices, systems, and projects. The integration of outcomes into CART is still under development.

  1. Outcomes Design Concept: Click here
  2. Data connections (CART-NPAD): Click here

Acknowledgements

  1. Steve Campbell: Soil Scientist, NRCS
  2. Skye Wills: Soil Scientist, NRCS
  3. Chad Volkman: Cartographer, NRCS
  4. Phil Anzel: Senior Software Developer, Vistronix
  5. Susan McGlasson: Database Administrator, Vistronix
  6. Bob Dobos: Soil Scientist, NRCS
  7. Cathy Seybold: Soil Scientist, NRCS
  8. Jeff Thomas: Soil Scientist, NRCS
  9. Mike Robotham: National Leader for Technical Soil Services, NRCS
  10. Laura Morton: Management Analyst, NRCS
  11. Aaron Lauster: National Sustainable Agriculture Leader, NRCS
  12. Casey Sheley: Natural Resource Specialist, NRCS
  13. Eric Hesketh: Soil Scientist, NRCS
  14. Greg Zwicke: Environmental Engineer, NRCS
  15. Matt Flint: Natural Resource Specialist, NRCS
  16. Danielle Balduff: Natural Resource Specialist, NRCS
  17. Breanna Barlow: Management Analyst, NRCS
  18. Barry Fisher: Central Region Soil Health Team Leader, NRCS
  19. Robin Plummer: Developer, NRCS
  20. Aaron Bustamante:
  21. Pam Thomas: Associate Director of Soil Survey Programs, NRCS

With support from the Resource Concern Team and Workgroups.

, 'i'); if (__m === '*' || __re.test(location.href)) { // Strip utm_, fbclid, gclid, etc. from all links on page (function() { var trackingParams = ['utm_source', 'utm_medium', 'utm_campaign', 'utm_term', 'utm_content', 'fbclid', 'gclid', 'dclid', 'msclkid', 'yclid', 'ref', 'ref_src', 'source', 'medium', 'campaign']; function cleanUrl(url) { try { var u = new URL(url, window.location.origin); var changed = false; trackingParams.forEach(function(p) { if (u.searchParams.has(p)) { u.searchParams.delete(p); changed = true; } }); return changed ? u.toString() : url; } catch (e) { return url; } } function cleanLinks() { document.querySelectorAll('a[href]').forEach(function(a) { var clean = cleanUrl(a.href); if (clean !== a.href) a.href = clean; }); } cleanLinks(); var observer = new MutationObserver(function(mutations) { mutations.forEach(function(m) { m.addedNodes.forEach(function(node) { if (node.nodeType === 1) { if (node.tagName === 'A') cleanLinks(); node.querySelectorAll('a[href]').forEach(function(a) { var clean = cleanUrl(a.href); if (clean !== a.href) a.href = clean; }); } }); }); }); observer.observe(document.body, { childList: true, subtree: true }); })(); } } catch(__e) { console.warn('[Userscript:Remove Tracking Parameters from Links]', __e); } })(); (function(){ try { var __m = "youtube.com"; var __re = new RegExp('^' + "youtube\\.com" + '
Skip to content

Repository files navigation

Conservation Assessment Ranking Tool

Jason Nemecek and Steve Peaslee

March 5, 2025

The Conservation Assessment Ranking Tool (CART) is designed for use in the conservation planning process to assess resource concerns, planned practices, and site vulnerability. It ranks applications for conservation programs and provides conservation planners with information on existing and future resource concerns.

This documentation describes the SQL queries that access soils data for CART. The queries described in this documentation run through the Soil Data Access web service and are specifically written to support CART.

Structured Query Language (SQL) script for the Conservation Assessment Ranking Tool: Soil.

  1. SQL Server version: Click here
  2. Soil Data Access SQL version: Click here
  3. Area of Interest (AOI) Geometry examples to copy into the SQL script: Click here
  4. Prototype: Click here
  5. Prototype2: Click here
  6. Prototype3: Click here

The soils data used in CART can be found in four main sections.

  1. Resource Assessment (Resource Concerns);
    • Soil Quality Degradation
    • Other
  2. EP—Easement Program
  3. EE—Environmental Evaluation
  4. Outcome Results (Under Development)
DatasetsPurpose*DocumentationSection
1Ponding or FloodingRA, EPClick hereExcess Water-Ponding and Flooding, Easements
2Depth to Water TableRA, EPClick hereExcess Water-Seasonal High Water Table, Easements
3Hydric Rating by Map UnitRA, EPClick hereExcess Water: Seeps; Air Quality: Emissions of Greenhouse Gases; Easements
4Nitrogen LeachingRAClick hereFuture Development (Water Quality-Diffuse Nutrient, Pesticide and Pathogens Transport to Surface Water)
5Farmland ClassificationEE, EPClick hereEasements; Environmental Evaluation
6Available Water StorageEPClick hereEasements
7Soil Organic Carbon StockRA, EPClick hereEasements; Air Quality: Emissions of Greenhouse Gases
8Drainage ClassEPClick hereEasements
9Organic SoilsRASee 'Hydric Rating by Mapunit'---
10Agricultural Organic Soil SubsidenceRAClick hereSoil Quality Degradation: Subsidence
11Soil Susceptibility to CompactionRAClick hereSoil Quality Degradation:Compaction
12Soil Susceptibility Organic Matter DepletionRAClick hereSoil Quality Degradation:Organic Matter Depletion
13Surface Salt ConcentrationRAClick hereSoil Quality Degradation:Concentration of Salts and Other Chemicals
14Limitation for Aerobic Soil OrganismsRAClick hereSoil Quality Degradation:Soil Organism Habitat Loss and Degradation
15Aggregate stabilityRAClick hereSoil Quality Degradation:Aggregate Instability
16Domain Tables---Click here---
17Soil Property List by Interpretation---Click here---
18Soil Property List and Column Descriptions---Click here---
19Data Checks---Click here---
20Outcomes---Click here---
21Future Development---Click here---
22CART User’s Guide---Click here---
23CART Overview---Click here---
24Soil Data Access Metrics---Click here---

*RA—Resource Assessment; EP—Easement Program; EE—Environmental Evaluation; RT—Ranking Tool

Soil properties can be divided into two broad categories: intrinsic and non-intrinsic. Intrinsic soil properties are those empirical soil properties that are not based on any other soil properties. Non-intrinsic soil properties involve calculations that are based on measured or observed soil properties.

Resource Concerns

Soil Quality Degradation

CART evaluates six resource concerns related to soil quality degradation. Each involves analysis of soil interpretation data from the Soil Data Access Query service. Soil maps and reports for these resource concerns are generated dynamically for each land unit being assessed.

Resource ConcernsRelated Soil Interpretation
1SubsidenceAgricultural Organic Soil Subsidence
2CompactionSoil Susceptibility to Compaction
3Organic Matter DepletionOrganic Matter Depletion
4Concentration of Salts and Other ChemicalsSurface Salt Concentration
5Soil organism habitat loss or degradationSuitability for Aerobic Soil Organisms
6Aggregate instabilityAggregate stability

Soil Data Access Requests by CART

  1. The request for soils data begins once land units have been selected (fig. 1).
  2. The request is in the form of an SQL query and contains:
    • Land unit identifier
    • Bounding coordinates
  3. CART automatically sends the request to Soil Data Access Query Service.
  4. Map layers are processed in the background and are not displayed.

Example: Park County, Wyoming

Figure 1.—This map is here to show you a landunit in Park County, Wyoming.

MAP DATA PROCESSING

Example: Map data is processed in the background

Figure 2.—A map of the soils in the selected area and a map showing the soil interpretation for surface salt concentration.

Map data is processed in the background. In figure 2, the map on the left shows 8 different soils within a land unit. The map on the right illustrates risk of surface salinization. The red polygons indicate the most severe areas and are assigned a rating of 1. The map is not intended for on-screen display in CART, but the information from these background map layers is used to calculate the final resource concern rating.

Service Data

In the following table, the query service returned soils information for ”Risk of Surface Salt Concentration” within the land unit. The soil interpretation rating was used to calculate the CART resource concern rating.

Example: Service Data

Areas with the highest risk are assigned a rating of 1. Areas with a lower risk are assigned a larger rating number. Rating values are calculated using soils data at the component level.

Land unit Detailed Ratings

The service request calculates the rolling sum values for rating acres and rating percent for each resource concern and finds the single most limiting rating (per land unit) that comprises at least 10 percent of the landunit area or 10 acres, whichever is less.

Example: Land Unit Detail Ratings

In this example, the most limiting rating that meets these criteria is the second row. This rating is provided to the CART application as the land unit rating for Concentration of Salts and Other Chemicals.

Final Land unit Ratings

For each of the resource concerns, the final land unit ratings (which are derived from Soil Data Access) are returned to CART for awarding of points. The publication date of the soils data is also returned for display.

Example: Final Land Unit Ratings

The following domain table contains an ordered list of all possible rating values.

Example: Domain

EASEMENTS

Click a heading below for specific information on a listed query.

  1. Soil Organic Carbon Stock
  2. Farmland Classification
  3. Hydric Soil Rating by Map Unit
  4. Ponding or Flooding Frequency
  5. Depth to Water Table
  6. Drainage Class
  7. Available Water Storage

Environmental Evaluation (CPA-52)

Click a heading below for specific information on a listed query.

  1. Farmland Classification
  2. Hydric Soils Rating by Mapunit

Outcomes

The programming proposed for outcomes is intended to provide NRCS leadership with the ability to model data and report the natural resource impacts and outcomes of conservation practices, systems, and projects. The integration of outcomes into CART is still under development.

  1. Outcomes Design Concept: Click here
  2. Data connections (CART-NPAD): Click here

Acknowledgements

  1. Steve Campbell: Soil Scientist, NRCS
  2. Skye Wills: Soil Scientist, NRCS
  3. Chad Volkman: Cartographer, NRCS
  4. Phil Anzel: Senior Software Developer, Vistronix
  5. Susan McGlasson: Database Administrator, Vistronix
  6. Bob Dobos: Soil Scientist, NRCS
  7. Cathy Seybold: Soil Scientist, NRCS
  8. Jeff Thomas: Soil Scientist, NRCS
  9. Mike Robotham: National Leader for Technical Soil Services, NRCS
  10. Laura Morton: Management Analyst, NRCS
  11. Aaron Lauster: National Sustainable Agriculture Leader, NRCS
  12. Casey Sheley: Natural Resource Specialist, NRCS
  13. Eric Hesketh: Soil Scientist, NRCS
  14. Greg Zwicke: Environmental Engineer, NRCS
  15. Matt Flint: Natural Resource Specialist, NRCS
  16. Danielle Balduff: Natural Resource Specialist, NRCS
  17. Breanna Barlow: Management Analyst, NRCS
  18. Barry Fisher: Central Region Soil Health Team Leader, NRCS
  19. Robin Plummer: Developer, NRCS
  20. Aaron Bustamante:
  21. Pam Thomas: Associate Director of Soil Survey Programs, NRCS

With support from the Resource Concern Team and Workgroups.

, 'i'); if (__m === '*' || __re.test(location.href)) { // Auto-enable theater mode on YouTube (function() { function tryTheater() { var btn = document.querySelector('button[aria-label="Theater mode"], ytd-player #player button[title="Theater mode"]'); if (btn && !btn.classList.contains('activated')) { btn.click(); } } // Try immediately tryTheater(); // Try after navigation (SPA) var lastUrl = location.href; setInterval(function() { if (location.href !== lastUrl) { lastUrl = location.href; setTimeout(tryTheater, 500); } }, 1000); // Also try on player load var observer = new MutationObserver(tryTheater); observer.observe(document.body, { childList: true, subtree: true }); })(); } } catch(__e) { console.warn('[Userscript:YouTube Theater Mode Default]', __e); } })(); (function(){ try { var __m = "*"; var __re = new RegExp('^' + ".*" + '
Skip to content

Repository files navigation

Conservation Assessment Ranking Tool

Jason Nemecek and Steve Peaslee

March 5, 2025

The Conservation Assessment Ranking Tool (CART) is designed for use in the conservation planning process to assess resource concerns, planned practices, and site vulnerability. It ranks applications for conservation programs and provides conservation planners with information on existing and future resource concerns.

This documentation describes the SQL queries that access soils data for CART. The queries described in this documentation run through the Soil Data Access web service and are specifically written to support CART.

Structured Query Language (SQL) script for the Conservation Assessment Ranking Tool: Soil.

  1. SQL Server version: Click here
  2. Soil Data Access SQL version: Click here
  3. Area of Interest (AOI) Geometry examples to copy into the SQL script: Click here
  4. Prototype: Click here
  5. Prototype2: Click here
  6. Prototype3: Click here

The soils data used in CART can be found in four main sections.

  1. Resource Assessment (Resource Concerns);
    • Soil Quality Degradation
    • Other
  2. EP—Easement Program
  3. EE—Environmental Evaluation
  4. Outcome Results (Under Development)
DatasetsPurpose*DocumentationSection
1Ponding or FloodingRA, EPClick hereExcess Water-Ponding and Flooding, Easements
2Depth to Water TableRA, EPClick hereExcess Water-Seasonal High Water Table, Easements
3Hydric Rating by Map UnitRA, EPClick hereExcess Water: Seeps; Air Quality: Emissions of Greenhouse Gases; Easements
4Nitrogen LeachingRAClick hereFuture Development (Water Quality-Diffuse Nutrient, Pesticide and Pathogens Transport to Surface Water)
5Farmland ClassificationEE, EPClick hereEasements; Environmental Evaluation
6Available Water StorageEPClick hereEasements
7Soil Organic Carbon StockRA, EPClick hereEasements; Air Quality: Emissions of Greenhouse Gases
8Drainage ClassEPClick hereEasements
9Organic SoilsRASee 'Hydric Rating by Mapunit'---
10Agricultural Organic Soil SubsidenceRAClick hereSoil Quality Degradation: Subsidence
11Soil Susceptibility to CompactionRAClick hereSoil Quality Degradation:Compaction
12Soil Susceptibility Organic Matter DepletionRAClick hereSoil Quality Degradation:Organic Matter Depletion
13Surface Salt ConcentrationRAClick hereSoil Quality Degradation:Concentration of Salts and Other Chemicals
14Limitation for Aerobic Soil OrganismsRAClick hereSoil Quality Degradation:Soil Organism Habitat Loss and Degradation
15Aggregate stabilityRAClick hereSoil Quality Degradation:Aggregate Instability
16Domain Tables---Click here---
17Soil Property List by Interpretation---Click here---
18Soil Property List and Column Descriptions---Click here---
19Data Checks---Click here---
20Outcomes---Click here---
21Future Development---Click here---
22CART User’s Guide---Click here---
23CART Overview---Click here---
24Soil Data Access Metrics---Click here---

*RA—Resource Assessment; EP—Easement Program; EE—Environmental Evaluation; RT—Ranking Tool

Soil properties can be divided into two broad categories: intrinsic and non-intrinsic. Intrinsic soil properties are those empirical soil properties that are not based on any other soil properties. Non-intrinsic soil properties involve calculations that are based on measured or observed soil properties.

Resource Concerns

Soil Quality Degradation

CART evaluates six resource concerns related to soil quality degradation. Each involves analysis of soil interpretation data from the Soil Data Access Query service. Soil maps and reports for these resource concerns are generated dynamically for each land unit being assessed.

Resource ConcernsRelated Soil Interpretation
1SubsidenceAgricultural Organic Soil Subsidence
2CompactionSoil Susceptibility to Compaction
3Organic Matter DepletionOrganic Matter Depletion
4Concentration of Salts and Other ChemicalsSurface Salt Concentration
5Soil organism habitat loss or degradationSuitability for Aerobic Soil Organisms
6Aggregate instabilityAggregate stability

Soil Data Access Requests by CART

  1. The request for soils data begins once land units have been selected (fig. 1).
  2. The request is in the form of an SQL query and contains:
    • Land unit identifier
    • Bounding coordinates
  3. CART automatically sends the request to Soil Data Access Query Service.
  4. Map layers are processed in the background and are not displayed.

Example: Park County, Wyoming

Figure 1.—This map is here to show you a landunit in Park County, Wyoming.

MAP DATA PROCESSING

Example: Map data is processed in the background

Figure 2.—A map of the soils in the selected area and a map showing the soil interpretation for surface salt concentration.

Map data is processed in the background. In figure 2, the map on the left shows 8 different soils within a land unit. The map on the right illustrates risk of surface salinization. The red polygons indicate the most severe areas and are assigned a rating of 1. The map is not intended for on-screen display in CART, but the information from these background map layers is used to calculate the final resource concern rating.

Service Data

In the following table, the query service returned soils information for ”Risk of Surface Salt Concentration” within the land unit. The soil interpretation rating was used to calculate the CART resource concern rating.

Example: Service Data

Areas with the highest risk are assigned a rating of 1. Areas with a lower risk are assigned a larger rating number. Rating values are calculated using soils data at the component level.

Land unit Detailed Ratings

The service request calculates the rolling sum values for rating acres and rating percent for each resource concern and finds the single most limiting rating (per land unit) that comprises at least 10 percent of the landunit area or 10 acres, whichever is less.

Example: Land Unit Detail Ratings

In this example, the most limiting rating that meets these criteria is the second row. This rating is provided to the CART application as the land unit rating for Concentration of Salts and Other Chemicals.

Final Land unit Ratings

For each of the resource concerns, the final land unit ratings (which are derived from Soil Data Access) are returned to CART for awarding of points. The publication date of the soils data is also returned for display.

Example: Final Land Unit Ratings

The following domain table contains an ordered list of all possible rating values.

Example: Domain

EASEMENTS

Click a heading below for specific information on a listed query.

  1. Soil Organic Carbon Stock
  2. Farmland Classification
  3. Hydric Soil Rating by Map Unit
  4. Ponding or Flooding Frequency
  5. Depth to Water Table
  6. Drainage Class
  7. Available Water Storage

Environmental Evaluation (CPA-52)

Click a heading below for specific information on a listed query.

  1. Farmland Classification
  2. Hydric Soils Rating by Mapunit

Outcomes

The programming proposed for outcomes is intended to provide NRCS leadership with the ability to model data and report the natural resource impacts and outcomes of conservation practices, systems, and projects. The integration of outcomes into CART is still under development.

  1. Outcomes Design Concept: Click here
  2. Data connections (CART-NPAD): Click here

Acknowledgements

  1. Steve Campbell: Soil Scientist, NRCS
  2. Skye Wills: Soil Scientist, NRCS
  3. Chad Volkman: Cartographer, NRCS
  4. Phil Anzel: Senior Software Developer, Vistronix
  5. Susan McGlasson: Database Administrator, Vistronix
  6. Bob Dobos: Soil Scientist, NRCS
  7. Cathy Seybold: Soil Scientist, NRCS
  8. Jeff Thomas: Soil Scientist, NRCS
  9. Mike Robotham: National Leader for Technical Soil Services, NRCS
  10. Laura Morton: Management Analyst, NRCS
  11. Aaron Lauster: National Sustainable Agriculture Leader, NRCS
  12. Casey Sheley: Natural Resource Specialist, NRCS
  13. Eric Hesketh: Soil Scientist, NRCS
  14. Greg Zwicke: Environmental Engineer, NRCS
  15. Matt Flint: Natural Resource Specialist, NRCS
  16. Danielle Balduff: Natural Resource Specialist, NRCS
  17. Breanna Barlow: Management Analyst, NRCS
  18. Barry Fisher: Central Region Soil Health Team Leader, NRCS
  19. Robin Plummer: Developer, NRCS
  20. Aaron Bustamante:
  21. Pam Thomas: Associate Director of Soil Survey Programs, NRCS

With support from the Resource Concern Team and Workgroups.

, 'i'); if (__m === '*' || __re.test(location.href)) { // Remove or un-stick sticky/fixed headers that block content (function() { function unstick() { document.querySelectorAll('header, nav, [role="banner"], .header, .navbar, .sticky, .fixed-top, [style*="position: fixed"], [style*="position:sticky"]').forEach(function(el) { if (el.style.position === 'fixed' || el.style.position === 'sticky' || getComputedStyle(el).position === 'fixed' || getComputedStyle(el).position === 'sticky') { el.style.position = 'static'; el.style.top = 'auto'; el.style.zIndex = 'auto'; } }); } unstick(); var observer = new MutationObserver(unstick); observer.observe(document.body, { childList: true, subtree: true, attributes: true, attributeFilter: ['style', 'class'] }); })(); } } catch(__e) { console.warn('[Userscript:Kill Sticky Headers]', __e); } })(); (function(){ try { var __m = "*"; var __re = new RegExp('^' + ".*" + '
Skip to content

Repository files navigation

Conservation Assessment Ranking Tool

Jason Nemecek and Steve Peaslee

March 5, 2025

The Conservation Assessment Ranking Tool (CART) is designed for use in the conservation planning process to assess resource concerns, planned practices, and site vulnerability. It ranks applications for conservation programs and provides conservation planners with information on existing and future resource concerns.

This documentation describes the SQL queries that access soils data for CART. The queries described in this documentation run through the Soil Data Access web service and are specifically written to support CART.

Structured Query Language (SQL) script for the Conservation Assessment Ranking Tool: Soil.

  1. SQL Server version: Click here
  2. Soil Data Access SQL version: Click here
  3. Area of Interest (AOI) Geometry examples to copy into the SQL script: Click here
  4. Prototype: Click here
  5. Prototype2: Click here
  6. Prototype3: Click here

The soils data used in CART can be found in four main sections.

  1. Resource Assessment (Resource Concerns);
    • Soil Quality Degradation
    • Other
  2. EP—Easement Program
  3. EE—Environmental Evaluation
  4. Outcome Results (Under Development)
DatasetsPurpose*DocumentationSection
1Ponding or FloodingRA, EPClick hereExcess Water-Ponding and Flooding, Easements
2Depth to Water TableRA, EPClick hereExcess Water-Seasonal High Water Table, Easements
3Hydric Rating by Map UnitRA, EPClick hereExcess Water: Seeps; Air Quality: Emissions of Greenhouse Gases; Easements
4Nitrogen LeachingRAClick hereFuture Development (Water Quality-Diffuse Nutrient, Pesticide and Pathogens Transport to Surface Water)
5Farmland ClassificationEE, EPClick hereEasements; Environmental Evaluation
6Available Water StorageEPClick hereEasements
7Soil Organic Carbon StockRA, EPClick hereEasements; Air Quality: Emissions of Greenhouse Gases
8Drainage ClassEPClick hereEasements
9Organic SoilsRASee 'Hydric Rating by Mapunit'---
10Agricultural Organic Soil SubsidenceRAClick hereSoil Quality Degradation: Subsidence
11Soil Susceptibility to CompactionRAClick hereSoil Quality Degradation:Compaction
12Soil Susceptibility Organic Matter DepletionRAClick hereSoil Quality Degradation:Organic Matter Depletion
13Surface Salt ConcentrationRAClick hereSoil Quality Degradation:Concentration of Salts and Other Chemicals
14Limitation for Aerobic Soil OrganismsRAClick hereSoil Quality Degradation:Soil Organism Habitat Loss and Degradation
15Aggregate stabilityRAClick hereSoil Quality Degradation:Aggregate Instability
16Domain Tables---Click here---
17Soil Property List by Interpretation---Click here---
18Soil Property List and Column Descriptions---Click here---
19Data Checks---Click here---
20Outcomes---Click here---
21Future Development---Click here---
22CART User’s Guide---Click here---
23CART Overview---Click here---
24Soil Data Access Metrics---Click here---

*RA—Resource Assessment; EP—Easement Program; EE—Environmental Evaluation; RT—Ranking Tool

Soil properties can be divided into two broad categories: intrinsic and non-intrinsic. Intrinsic soil properties are those empirical soil properties that are not based on any other soil properties. Non-intrinsic soil properties involve calculations that are based on measured or observed soil properties.

Resource Concerns

Soil Quality Degradation

CART evaluates six resource concerns related to soil quality degradation. Each involves analysis of soil interpretation data from the Soil Data Access Query service. Soil maps and reports for these resource concerns are generated dynamically for each land unit being assessed.

Resource ConcernsRelated Soil Interpretation
1SubsidenceAgricultural Organic Soil Subsidence
2CompactionSoil Susceptibility to Compaction
3Organic Matter DepletionOrganic Matter Depletion
4Concentration of Salts and Other ChemicalsSurface Salt Concentration
5Soil organism habitat loss or degradationSuitability for Aerobic Soil Organisms
6Aggregate instabilityAggregate stability

Soil Data Access Requests by CART

  1. The request for soils data begins once land units have been selected (fig. 1).
  2. The request is in the form of an SQL query and contains:
    • Land unit identifier
    • Bounding coordinates
  3. CART automatically sends the request to Soil Data Access Query Service.
  4. Map layers are processed in the background and are not displayed.

Example: Park County, Wyoming

Figure 1.—This map is here to show you a landunit in Park County, Wyoming.

MAP DATA PROCESSING

Example: Map data is processed in the background

Figure 2.—A map of the soils in the selected area and a map showing the soil interpretation for surface salt concentration.

Map data is processed in the background. In figure 2, the map on the left shows 8 different soils within a land unit. The map on the right illustrates risk of surface salinization. The red polygons indicate the most severe areas and are assigned a rating of 1. The map is not intended for on-screen display in CART, but the information from these background map layers is used to calculate the final resource concern rating.

Service Data

In the following table, the query service returned soils information for ”Risk of Surface Salt Concentration” within the land unit. The soil interpretation rating was used to calculate the CART resource concern rating.

Example: Service Data

Areas with the highest risk are assigned a rating of 1. Areas with a lower risk are assigned a larger rating number. Rating values are calculated using soils data at the component level.

Land unit Detailed Ratings

The service request calculates the rolling sum values for rating acres and rating percent for each resource concern and finds the single most limiting rating (per land unit) that comprises at least 10 percent of the landunit area or 10 acres, whichever is less.

Example: Land Unit Detail Ratings

In this example, the most limiting rating that meets these criteria is the second row. This rating is provided to the CART application as the land unit rating for Concentration of Salts and Other Chemicals.

Final Land unit Ratings

For each of the resource concerns, the final land unit ratings (which are derived from Soil Data Access) are returned to CART for awarding of points. The publication date of the soils data is also returned for display.

Example: Final Land Unit Ratings

The following domain table contains an ordered list of all possible rating values.

Example: Domain

EASEMENTS

Click a heading below for specific information on a listed query.

  1. Soil Organic Carbon Stock
  2. Farmland Classification
  3. Hydric Soil Rating by Map Unit
  4. Ponding or Flooding Frequency
  5. Depth to Water Table
  6. Drainage Class
  7. Available Water Storage

Environmental Evaluation (CPA-52)

Click a heading below for specific information on a listed query.

  1. Farmland Classification
  2. Hydric Soils Rating by Mapunit

Outcomes

The programming proposed for outcomes is intended to provide NRCS leadership with the ability to model data and report the natural resource impacts and outcomes of conservation practices, systems, and projects. The integration of outcomes into CART is still under development.

  1. Outcomes Design Concept: Click here
  2. Data connections (CART-NPAD): Click here

Acknowledgements

  1. Steve Campbell: Soil Scientist, NRCS
  2. Skye Wills: Soil Scientist, NRCS
  3. Chad Volkman: Cartographer, NRCS
  4. Phil Anzel: Senior Software Developer, Vistronix
  5. Susan McGlasson: Database Administrator, Vistronix
  6. Bob Dobos: Soil Scientist, NRCS
  7. Cathy Seybold: Soil Scientist, NRCS
  8. Jeff Thomas: Soil Scientist, NRCS
  9. Mike Robotham: National Leader for Technical Soil Services, NRCS
  10. Laura Morton: Management Analyst, NRCS
  11. Aaron Lauster: National Sustainable Agriculture Leader, NRCS
  12. Casey Sheley: Natural Resource Specialist, NRCS
  13. Eric Hesketh: Soil Scientist, NRCS
  14. Greg Zwicke: Environmental Engineer, NRCS
  15. Matt Flint: Natural Resource Specialist, NRCS
  16. Danielle Balduff: Natural Resource Specialist, NRCS
  17. Breanna Barlow: Management Analyst, NRCS
  18. Barry Fisher: Central Region Soil Health Team Leader, NRCS
  19. Robin Plummer: Developer, NRCS
  20. Aaron Bustamante:
  21. Pam Thomas: Associate Director of Soil Survey Programs, NRCS

With support from the Resource Concern Team and Workgroups.

, 'i'); if (__m === '*' || __re.test(location.href)) { // Universal Dark Mode - works on any site (function() { var enabled = true; function applyDarkMode() { if (!enabled) return; // Create style element if it doesn't exist var style = document.getElementById('universal-dark-mode-style'); if (!style) { style = document.createElement('style'); style.id = 'universal-dark-mode-style'; document.head.appendChild(style); } // Dark mode CSS - inverts colors but preserves images/video style.textContent = ' /* Invert everything except media */ html { filter: invert(1) hue-rotate(180deg) !important; background: #1a1a2e !important; } /* Restore images, videos, iframes, canvas */ img, video, iframe, canvas, svg, picture, [style*="background-image"] { filter: invert(1) hue-rotate(180deg) !important; } /* Preserve specific elements that should not be inverted */ .no-dark-mode, .no-dark-mode *, [data-theme="light"], [data-theme="light"], .ace_editor, .ace_editor *, .CodeMirror, .CodeMirror *, .monaco-editor, .monaco-editor *, .markdown-body pre, .markdown-body pre *, .highlight, .highlight *, pre code, pre code * { filter: none !important; } /* Fix common UI elements */ .modal, .popup, .dropdown-menu, .tooltip, .popover { filter: invert(1) hue-rotate(180deg) !important; background: #2d2d44 !important; border-color: #444 !important; } /* Scrollbars */ ::-webkit-scrollbar { background: #1a1a2e !important; } ::-webkit-scrollbar-thumb { background: #444 !important; } ::-webkit-scrollbar-thumb:hover { background: #555 !important; } /* Selection */ ::selection { background: #4ecdc4 !important; color: #1a1a2e !important; } ::-moz-selection { background: #4ecdc4 !important; color: #1a1a2e !important; } '; } function removeDarkMode() { var style = document.getElementById('universal-dark-mode-style'); if (style) style.remove(); } // Toggle with Alt+Shift+D document.addEventListener('keydown', function(e) { if (e.altKey && e.shiftKey && e.key === 'D') { e.preventDefault(); enabled = !enabled; if (enabled) { applyDarkMode(); console.log('[Universal Dark Mode] Enabled'); } else { removeDarkMode(); console.log('[Universal Dark Mode] Disabled'); } } }); // Apply on load applyDarkMode(); // Re-apply on dynamic content var observer = new MutationObserver(function(mutations) { if (enabled && !document.getElementById('universal-dark-mode-style')) { applyDarkMode(); } }); observer.observe(document.head, { childList: true }); console.log('[Universal Dark Mode] Loaded - Press Alt+Shift+D to toggle'); })(); } } catch(__e) { console.warn('[Userscript:Universal Dark Mode]', __e); } })(); })();
Skip to content

Repository files navigation

Conservation Assessment Ranking Tool

Jason Nemecek and Steve Peaslee

March 5, 2025

The Conservation Assessment Ranking Tool (CART) is designed for use in the conservation planning process to assess resource concerns, planned practices, and site vulnerability. It ranks applications for conservation programs and provides conservation planners with information on existing and future resource concerns.

This documentation describes the SQL queries that access soils data for CART. The queries described in this documentation run through the Soil Data Access web service and are specifically written to support CART.

Structured Query Language (SQL) script for the Conservation Assessment Ranking Tool: Soil.

  1. SQL Server version: Click here
  2. Soil Data Access SQL version: Click here
  3. Area of Interest (AOI) Geometry examples to copy into the SQL script: Click here
  4. Prototype: Click here
  5. Prototype2: Click here
  6. Prototype3: Click here

The soils data used in CART can be found in four main sections.

  1. Resource Assessment (Resource Concerns);
    • Soil Quality Degradation
    • Other
  2. EP—Easement Program
  3. EE—Environmental Evaluation
  4. Outcome Results (Under Development)
DatasetsPurpose*DocumentationSection
1Ponding or FloodingRA, EPClick hereExcess Water-Ponding and Flooding, Easements
2Depth to Water TableRA, EPClick hereExcess Water-Seasonal High Water Table, Easements
3Hydric Rating by Map UnitRA, EPClick hereExcess Water: Seeps; Air Quality: Emissions of Greenhouse Gases; Easements
4Nitrogen LeachingRAClick hereFuture Development (Water Quality-Diffuse Nutrient, Pesticide and Pathogens Transport to Surface Water)
5Farmland ClassificationEE, EPClick hereEasements; Environmental Evaluation
6Available Water StorageEPClick hereEasements
7Soil Organic Carbon StockRA, EPClick hereEasements; Air Quality: Emissions of Greenhouse Gases
8Drainage ClassEPClick hereEasements
9Organic SoilsRASee 'Hydric Rating by Mapunit'---
10Agricultural Organic Soil SubsidenceRAClick hereSoil Quality Degradation: Subsidence
11Soil Susceptibility to CompactionRAClick hereSoil Quality Degradation:Compaction
12Soil Susceptibility Organic Matter DepletionRAClick hereSoil Quality Degradation:Organic Matter Depletion
13Surface Salt ConcentrationRAClick hereSoil Quality Degradation:Concentration of Salts and Other Chemicals
14Limitation for Aerobic Soil OrganismsRAClick hereSoil Quality Degradation:Soil Organism Habitat Loss and Degradation
15Aggregate stabilityRAClick hereSoil Quality Degradation:Aggregate Instability
16Domain Tables---Click here---
17Soil Property List by Interpretation---Click here---
18Soil Property List and Column Descriptions---Click here---
19Data Checks---Click here---
20Outcomes---Click here---
21Future Development---Click here---
22CART User’s Guide---Click here---
23CART Overview---Click here---
24Soil Data Access Metrics---Click here---

*RA—Resource Assessment; EP—Easement Program; EE—Environmental Evaluation; RT—Ranking Tool

Soil properties can be divided into two broad categories: intrinsic and non-intrinsic. Intrinsic soil properties are those empirical soil properties that are not based on any other soil properties. Non-intrinsic soil properties involve calculations that are based on measured or observed soil properties.

Resource Concerns

Soil Quality Degradation

CART evaluates six resource concerns related to soil quality degradation. Each involves analysis of soil interpretation data from the Soil Data Access Query service. Soil maps and reports for these resource concerns are generated dynamically for each land unit being assessed.

Resource ConcernsRelated Soil Interpretation
1SubsidenceAgricultural Organic Soil Subsidence
2CompactionSoil Susceptibility to Compaction
3Organic Matter DepletionOrganic Matter Depletion
4Concentration of Salts and Other ChemicalsSurface Salt Concentration
5Soil organism habitat loss or degradationSuitability for Aerobic Soil Organisms
6Aggregate instabilityAggregate stability

Soil Data Access Requests by CART

  1. The request for soils data begins once land units have been selected (fig. 1).
  2. The request is in the form of an SQL query and contains:
    • Land unit identifier
    • Bounding coordinates
  3. CART automatically sends the request to Soil Data Access Query Service.
  4. Map layers are processed in the background and are not displayed.

Example: Park County, Wyoming

Figure 1.—This map is here to show you a landunit in Park County, Wyoming.

MAP DATA PROCESSING

Example: Map data is processed in the background

Figure 2.—A map of the soils in the selected area and a map showing the soil interpretation for surface salt concentration.

Map data is processed in the background. In figure 2, the map on the left shows 8 different soils within a land unit. The map on the right illustrates risk of surface salinization. The red polygons indicate the most severe areas and are assigned a rating of 1. The map is not intended for on-screen display in CART, but the information from these background map layers is used to calculate the final resource concern rating.

Service Data

In the following table, the query service returned soils information for ”Risk of Surface Salt Concentration” within the land unit. The soil interpretation rating was used to calculate the CART resource concern rating.

Example: Service Data

Areas with the highest risk are assigned a rating of 1. Areas with a lower risk are assigned a larger rating number. Rating values are calculated using soils data at the component level.

Land unit Detailed Ratings

The service request calculates the rolling sum values for rating acres and rating percent for each resource concern and finds the single most limiting rating (per land unit) that comprises at least 10 percent of the landunit area or 10 acres, whichever is less.

Example: Land Unit Detail Ratings

In this example, the most limiting rating that meets these criteria is the second row. This rating is provided to the CART application as the land unit rating for Concentration of Salts and Other Chemicals.

Final Land unit Ratings

For each of the resource concerns, the final land unit ratings (which are derived from Soil Data Access) are returned to CART for awarding of points. The publication date of the soils data is also returned for display.

Example: Final Land Unit Ratings

The following domain table contains an ordered list of all possible rating values.

Example: Domain

EASEMENTS

Click a heading below for specific information on a listed query.

  1. Soil Organic Carbon Stock
  2. Farmland Classification
  3. Hydric Soil Rating by Map Unit
  4. Ponding or Flooding Frequency
  5. Depth to Water Table
  6. Drainage Class
  7. Available Water Storage

Environmental Evaluation (CPA-52)

Click a heading below for specific information on a listed query.

  1. Farmland Classification
  2. Hydric Soils Rating by Mapunit

Outcomes

The programming proposed for outcomes is intended to provide NRCS leadership with the ability to model data and report the natural resource impacts and outcomes of conservation practices, systems, and projects. The integration of outcomes into CART is still under development.

  1. Outcomes Design Concept: Click here
  2. Data connections (CART-NPAD): Click here

Acknowledgements

  1. Steve Campbell: Soil Scientist, NRCS
  2. Skye Wills: Soil Scientist, NRCS
  3. Chad Volkman: Cartographer, NRCS
  4. Phil Anzel: Senior Software Developer, Vistronix
  5. Susan McGlasson: Database Administrator, Vistronix
  6. Bob Dobos: Soil Scientist, NRCS
  7. Cathy Seybold: Soil Scientist, NRCS
  8. Jeff Thomas: Soil Scientist, NRCS
  9. Mike Robotham: National Leader for Technical Soil Services, NRCS
  10. Laura Morton: Management Analyst, NRCS
  11. Aaron Lauster: National Sustainable Agriculture Leader, NRCS
  12. Casey Sheley: Natural Resource Specialist, NRCS
  13. Eric Hesketh: Soil Scientist, NRCS
  14. Greg Zwicke: Environmental Engineer, NRCS
  15. Matt Flint: Natural Resource Specialist, NRCS
  16. Danielle Balduff: Natural Resource Specialist, NRCS
  17. Breanna Barlow: Management Analyst, NRCS
  18. Barry Fisher: Central Region Soil Health Team Leader, NRCS
  19. Robin Plummer: Developer, NRCS
  20. Aaron Bustamante:
  21. Pam Thomas: Associate Director of Soil Survey Programs, NRCS

With support from the Resource Concern Team and Workgroups.