


An open-source, Bloomberg-style stock dashboard for the terminal that also answers why the price moved. Live quotes and candlestick charts on one side; on the other, for the same ticker, AI-scored news with a full analysis of each story, the SEC Form 4 insider filings and a structured read of the last earnings report. A watchlist calendar brings upcoming company reports and US macro releases into the same workspace. One Rust binary built on ratatui, no browser tab, and no account needed for the prices. Coming from tickrs or ticker? See how it compares.

brew install makeev/tap/alphai-tui   # also cargo, apt, AUR, x-cmd, or a prebuilt binary
alphai-tui NVDA AVGO AAPL MSFT META TSLA AMZN GOOGL BTC-USD
Quotes and charts run keyless on Yahoo, or on Finnhub or Alpaca with their
own free keys. The News, Insider, Earnings and Calendar views run on a free
AlphAI key
that you paste once in the settings screen. The first run walks you through
both, and after that a bare alphai-tui reopens your watchlist.
Nine views, one keystroke apart (1 to 9, or Tab). Some follow the
selected ticker; Summary, Portfolio and Calendar cover several names.
One line under the tabs carries the selected ticker's price into all of them.

Price, the change on the day, the extended-hours print measured against the regular close, what you are up or down on the ticker if you hold any of it, what the US market is doing right now (pre, live, post or closed) and how long until the next bell, whether the feed is delayed, where the price sits between the day's low and high, and, where the source reports them and the terminal is wide enough, the year's range and the day's volume. The rest of the watchlist follows as percentages.
A flag shows the next high-importance macro event within seven days, or a
confirmed report date for the selected ticker within seven ET calendar
days. The ticker's report takes priority. It uses fresh cached dates only;
the flag never fetches a company's report dates itself. Estimated macro
dates keep an est. label, and postponed or cancelled events do not flag.
So the News, Insider and Earnings views are never a ticker name with no
price attached, and moving between tickers with the arrow keys is not a
blind jump. Parts drop one at a time as the terminal narrows, the symbol and
the price surviving to the last; [ui] quote_rail = false turns the line
off, and a terminal under 12 rows gives the row back to the view.
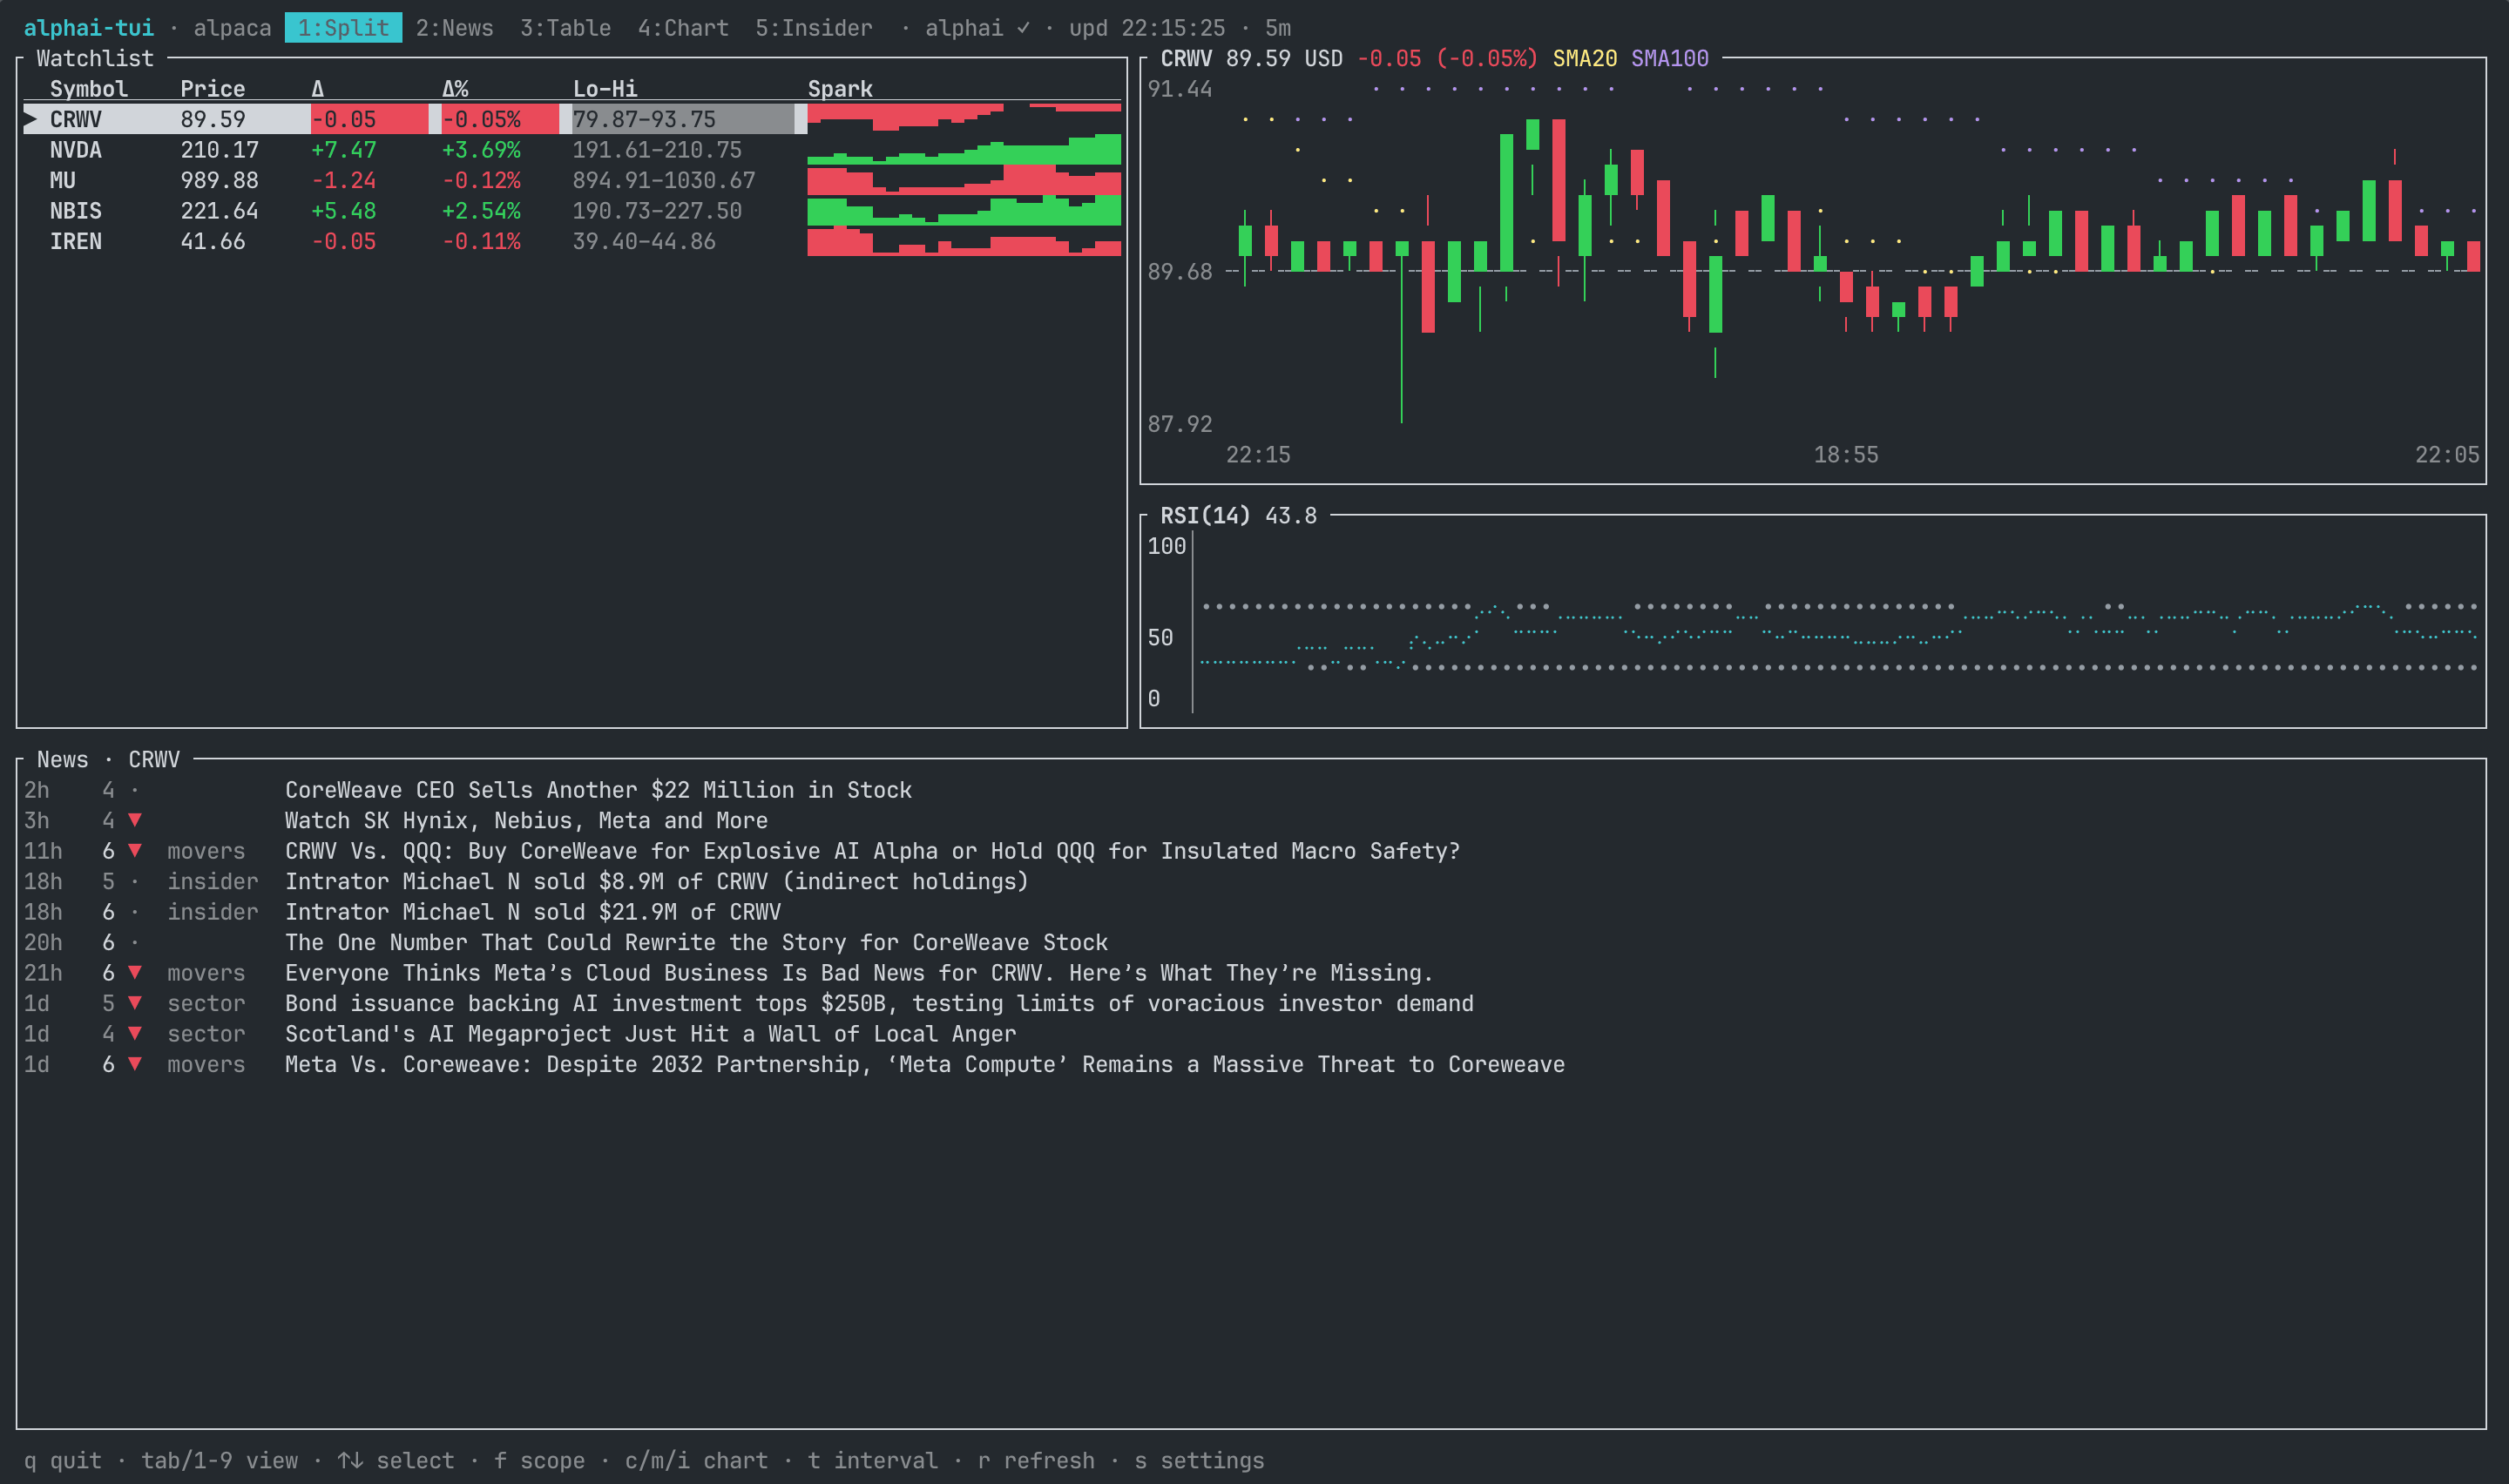
The watchlist and the chart in the top half, the news feed in the bottom half. One screen that says what you follow, what it is doing and what is being said about it. On very small terminals the feed steps aside.
a adds a ticker without leaving the app (type the symbol, Enter), d
drops the selected one. Both are session-only, like every other runtime
change here; Save in the settings screen writes the watchlist to the config.
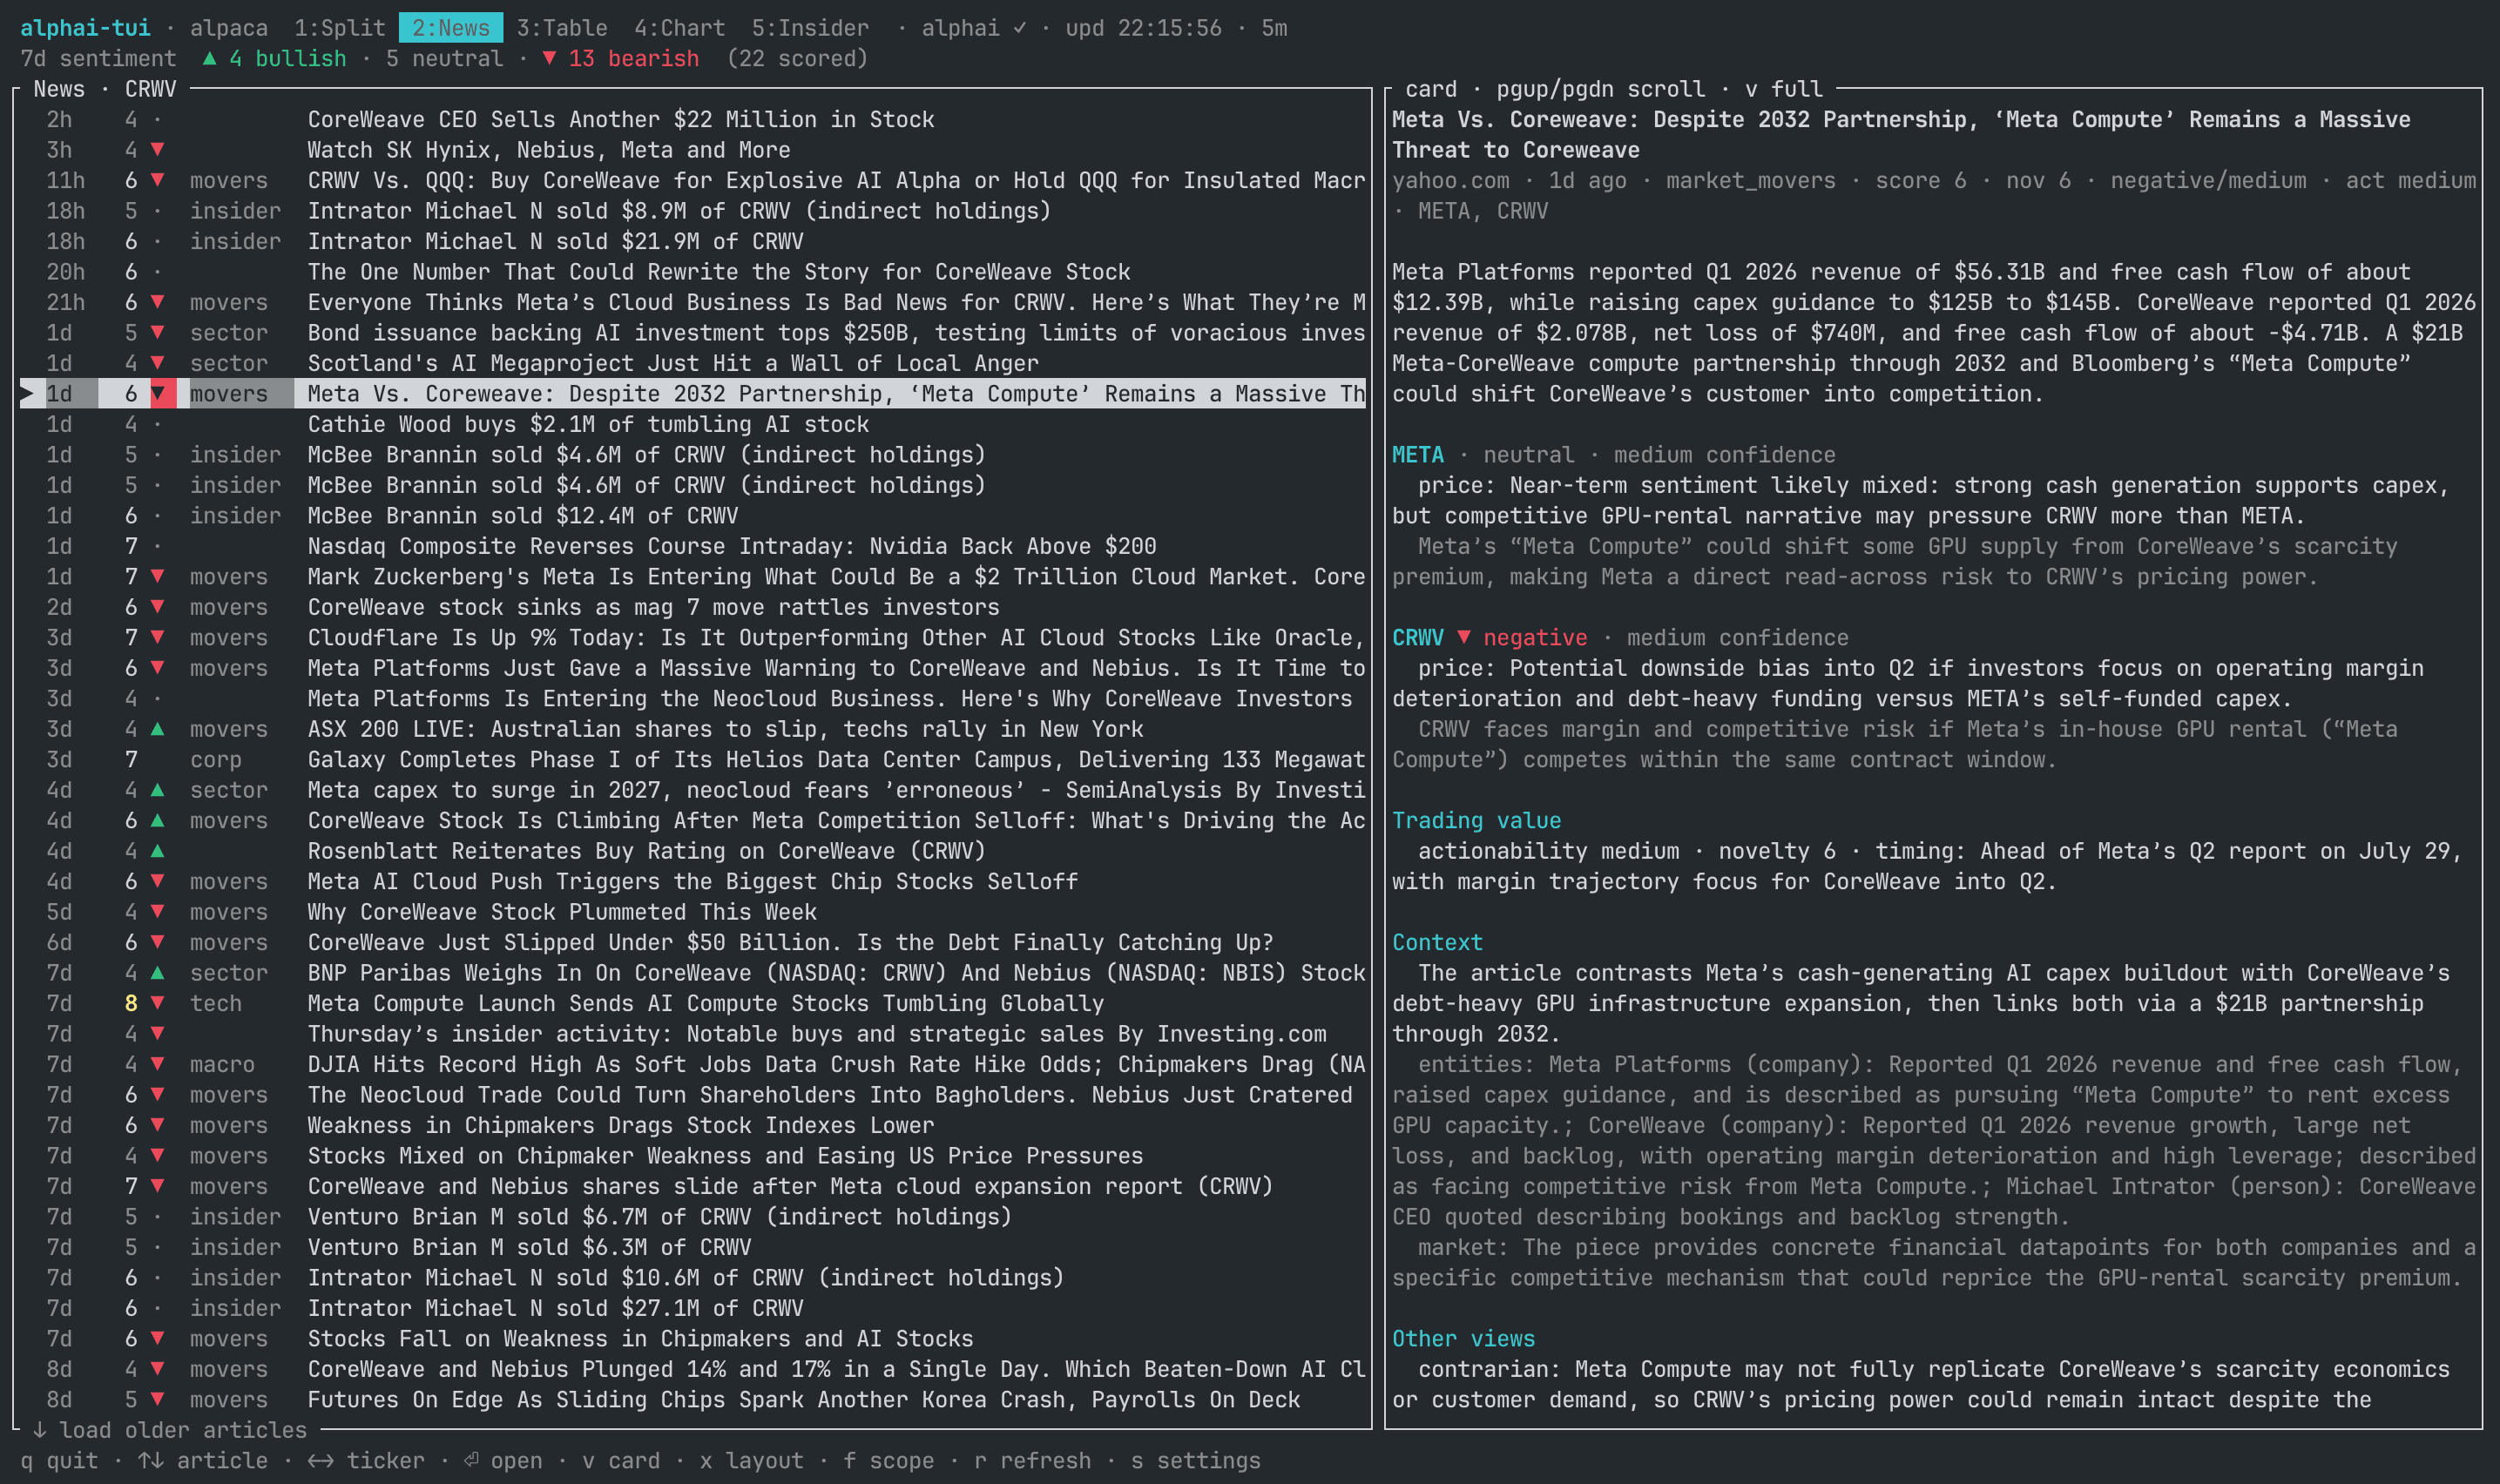
Every article carries a per-ticker analysis: the expected price impact and the confidence behind it, relevance and novelty scores, how actionable it is, the background context, the entities involved and a contrarian view. A seven-day bullish/bearish rollup tops the ticker scope.
The feed shows articles scoring 7 and up by default. + and - move that
bar live, the server does the filtering, so nothing you filtered out eats a
slot on the page. Articles fresher than 15 minutes light up their age, and
rows that arrived since you last looked carry a ● that goes out once the
cursor rests on them. New arrivals are placed at the top of the list even
when the rows below them are newer: a story reaches the feed a while after
it was published, and at its publish position it would land below the fold
and never be seen.
x flips the layout between side-by-side and list-over-card, v blows the
card up over the screen, Enter opens the article in the browser, and down
on the last row loads the next page.

f cycles the scope: the selected ticker, the whole market, or the 48-hour
trending top ten. The market-wide feed collapses syndicated reprints into
one row and says how many outlets carry the story (×4), marks an earnings
filing as 8-K or 6-K rather than as coverage of one, and mixes in the
insider rows.
The watchlist alone, full width: price, change in dollars and percent, the extended-hours change, the day's range and a sparkline of the session. The extended column appears only when some row actually has a print outside the session, so it costs no width during the trading day.

Candlesticks at half-block resolution with a previous-close reference line,
20 and 100 period moving average overlays threaded through them as thin
braille lines, a volume panel whose bars sit in their candles' own columns
and take their color, and an RSI(14) panel. c switches to a Braille line
chart, m, i and b toggle the overlays and the panels, e averages
simple or exponential, t cycles interval presets, and E draws the pre
and post market candles too (Yahoo and Alpaca), enabled by default. The
chart title keeps the switch beside the source: EXT: Yahoo (Shift+E: off)
or EXT: off (Shift+E: on) when hidden. The hint follows custom keybindings.
Charts start with five days of 15m candles; set the top-level range and
interval in the config to choose another window or size. The header shows
both values, 5d / 15m (t: change), because t and T cycle forward and
backward through presets that change the window as well as the candle size.
The ticker's news is marked on the candles it was published in: ▲ and
▼ for the AI sentiment call, ◆ when it is neutral, brighter for a
higher relevance score, and the freshest of them named on the bottom
border. So the move and its reason share a column instead of living in
different views. n turns the marks off. They are drawn from the news the
app already holds for that ticker, which the Split and News views keep
fresh, so they never cost an API request and they are simply absent until
one of those views has loaded that ticker's feed.
The client fetches extra history for indicator warm-up. Pre-market has a quiet warm background, after-hours a cool one, and regular trading keeps the terminal background. Price, volume and RSI share the same session columns and vertical grid in both candle and line mode. Aggregation never combines different sessions or feeds into one candle. These session rules apply to US stocks on intraday intervals, including scheduled 13:00 closes and 17:00 after-hours closes on half days; crypto remains 24/7.
A bar is its interval at every width. When the plot is too narrow for
every bar of the window, the newest bars that fit are drawn and the title
counts the rest: last 70 of 192 bars. Bars are never merged into larger
candles, so the half-width chart in the split view draws the same bars as
the chart view, fewer of them, and the price axis follows the bars on
screen. To see more of the window, widen the terminal or pick a coarser
interval with t.
The time axis adapts its label spacing to the terminal width, gives the
opening and closing bells priority, and puts dates on a second row. US
stocks use New York time (ET) by default; [chart] timezone = "local"
or "utc" changes the labels. Other instruments use local time under the
"exchange" default. Future labels in the right margin skip closed US
sessions, weekends and holidays, including daylight-saving changes.
session_shading = false and time_grid = false disable those layers.
The right margin carries the latest relevant price. A timestamped quote only updates a candle from the same source, interval and session: the regular close cannot overwrite a pre-market candle, and an IEX quote cannot rewrite a delayed SIP bar. Extended quotes at 0% still appear. The rail shows their source, timestamp and age; a new premarket retires the previous after-hours quote even if the first new trade has not arrived yet.
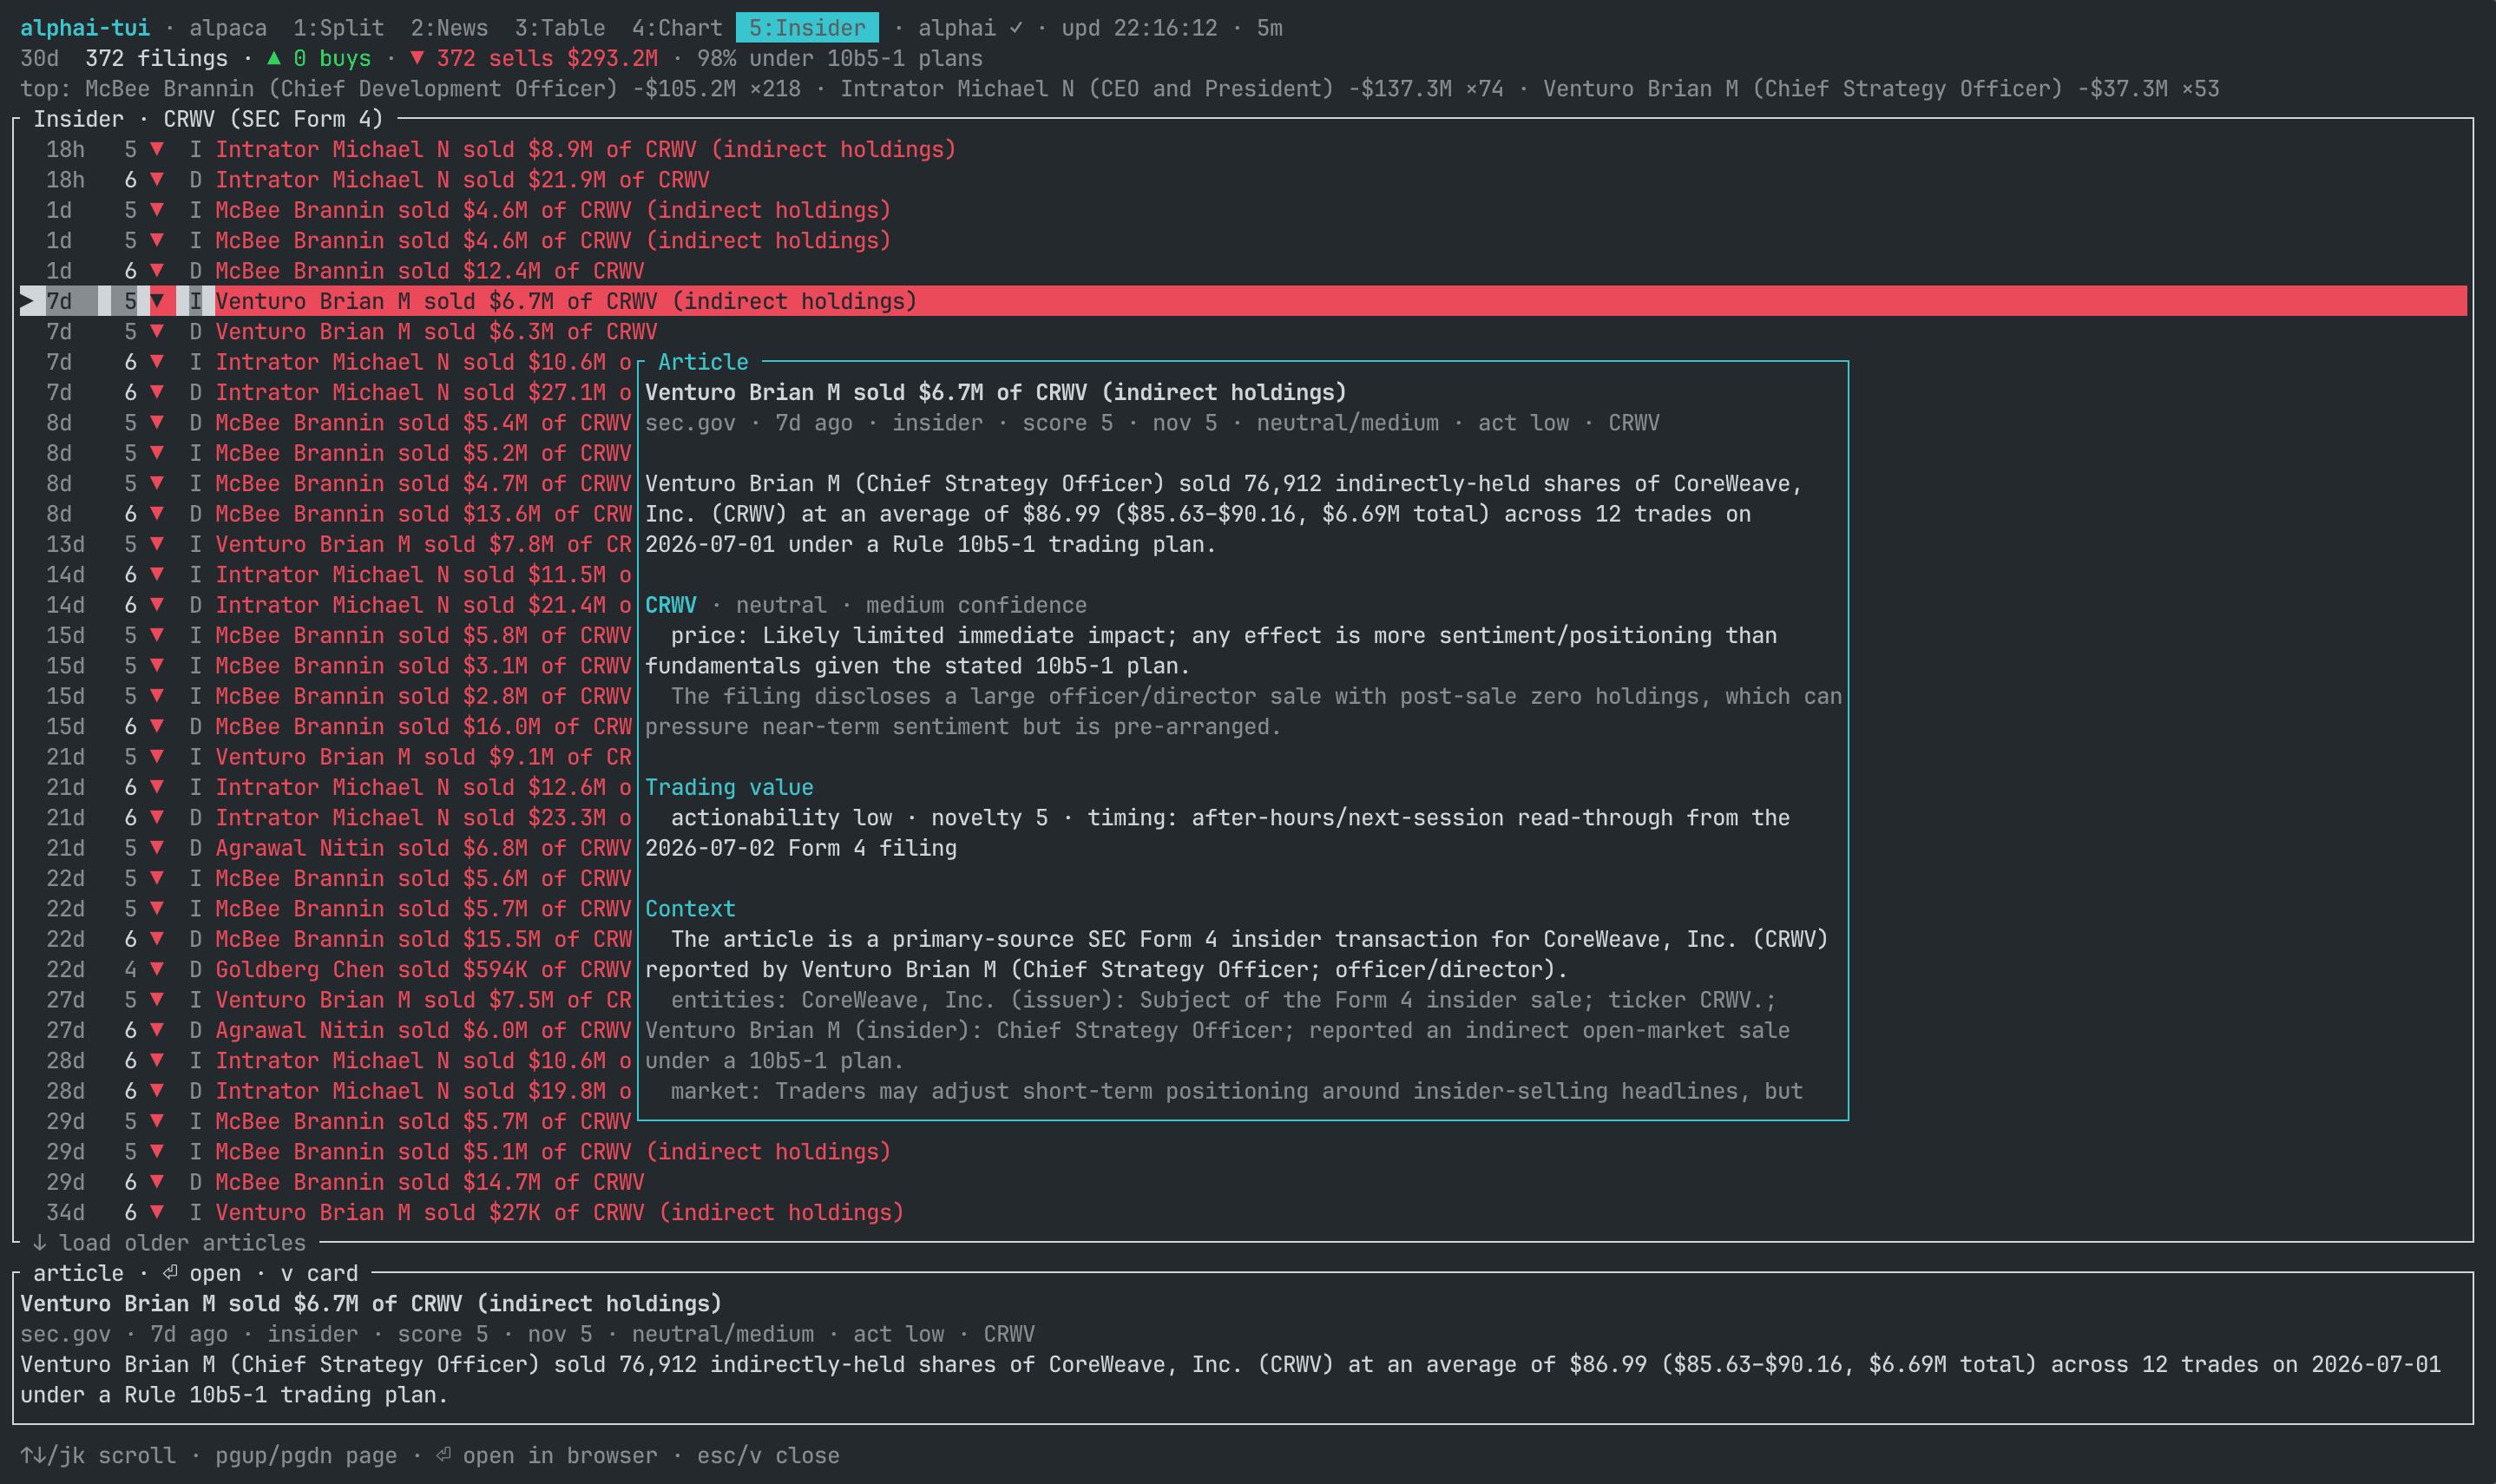
SEC Form 4 activity for the selected ticker: what its own officers and directors did with their shares. A 12-month rollup (buys against sells, dollar volumes, the share done under pre-arranged 10b5-1 plans, the most active insiders) sits above a trades chart and the stream of filings.
Every event in the window is a triangle placed by date on a log dollar
scale (▲ buy, ▼ sale, a hollow ▽ for shares sold back to the issuer,
dimmed when the trade ran under a plan), with weekly buy and sell dollar
bars underneath. The mark of the filing selected in the list renders
inverted, so the list and the chart always point at each other, and the
detail pane adds what share of the insider's stake the event moved, how many
tranches the filing folded into it and whether it was filed late. g cycles
the window between 3 months, 12 months and off; + and - filter the
stream by trade size.

AlphAI's structured read of the ticker's own earnings filing, the way the company reported it: the verdict and why, the metric table with the prior quarter, the prior year and both changes, segments, the outlook, concerns, what to watch and several paragraphs of analysis. Every figure was checked against the filing text before it was published, and it prints exactly as the filing wrote it, units shortened and nothing rounded into a new number. American and foreign filings both (an 8-K item 2.02, or a foreign private issuer's 6-K with its half years and its own currency).
← → walk the watchlist, older quarters continue below the newest read.
When a company has not reported since AlphAI began reading filings, the
view says so and gives the date of its next report if the company has
confirmed one. The bottom line carries the next couple of US macro releases
(CPI, the jobs report, an FOMC decision), which is the other half of what
moves a price you are about to read about.

Every ticker you follow as its own chart, in a grid sized to the terminal.
The table's one-row sparkline says up or down; this spends real rows on each
name, so one glance covers the shape of the session across the whole list.
↑ ↓ move between cards and page the grid when the watchlist outgrows the
screen.

What the watchlist cannot answer: the price times what you own of it. One
row per holding with its quantity, average price, value, the day's move in
money, the profit or loss since you bought and the share of the portfolio
it carries, and a total underneath. p opens a one-line prompt on the
ticker under the cursor, prefilled with what is held, so a correction is
two keystrokes and an emptied line drops the holding; the quantity and the
price are written to the config file right away rather than waiting for
Save. A holding that is not on the watchlist is polled all the same, so
every row has a price, and a row still waiting for its first one says so
instead of counting as zero. The same numbers turn up as two extra columns
in the Table view and as a zone in the quote rail, but only for the
tickers you actually hold.
Holdings use the premarket or after-hours price when the source reports
one, falling back to the regular quote otherwise. This applies to Last,
value, P&L, totals and the holding figures in the table and quote rail,
independently of the E candle toggle. An extended Last carries a *.
During premarket, Day starts at the latest regular close; after hours,
it includes both the regular session and the extended move.
There is no currency conversion here and there is not going to be one: if
the holdings quote in more than one currency, the total says mixed currencies rather than pretending the sum means something.
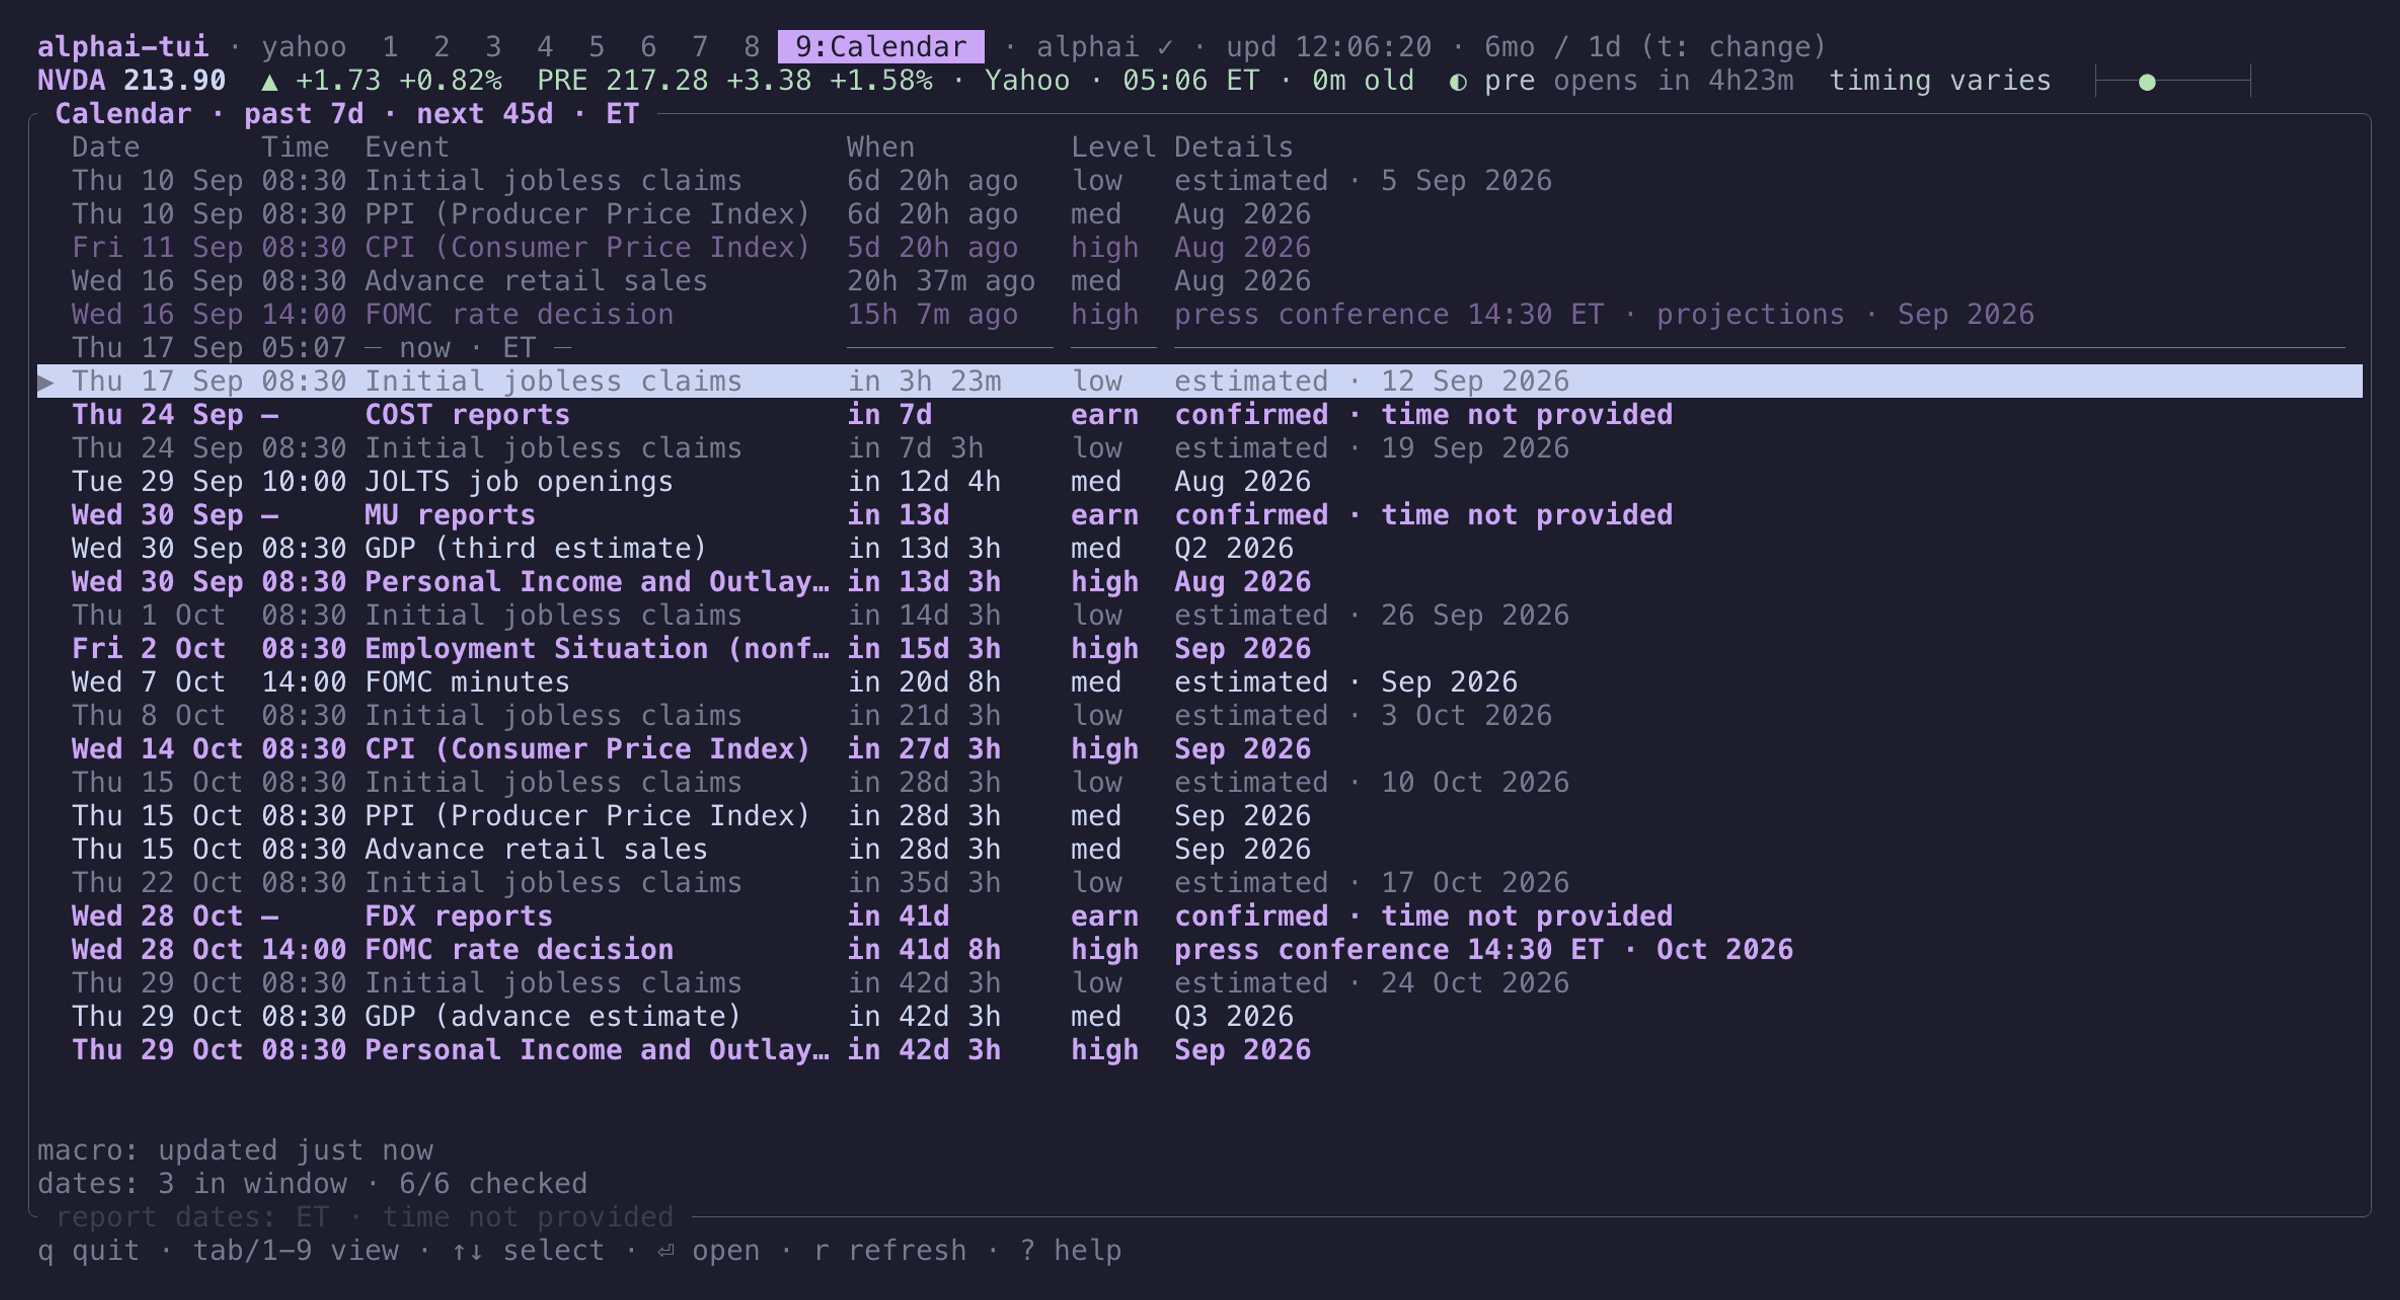
US macro releases and confirmed report dates from your watchlist in one
agenda: the past seven days and the next 45 days. The cursor starts at the
first upcoming event, a now line separates it from the past, and new
arrivals keep the event you selected in place. High-importance releases
and company reports stand out; estimated, postponed and cancelled
remain explicit even when the terminal is too narrow for the Details column.
↑ / ↓ select an event, PgUp / PgDn move ten events, and Enter
opens a macro event's source or the company's Earnings view. That view
contains published reads, so it may show the previous quarter until a new
read is available. Calendar is an agenda, not confirmation that a release
has been published; it has no actual, forecast or previous macro figures.
Macro times follow [chart] timezone (ET by default). Company report dates
stay in ET in every timezone and show — for time: the API confirms the
day, not the hour. A company without a confirmed date simply has no report
row; this does not mean it will not report. Coverage is partial. Historical
company dates are limited to the next-report dates still in the cache.
Dates are checked one company at a time while Calendar is open, at least four seconds apart. The progress line distinguishes unconfirmed dates, unchecked names and failed checks. A failed macro update keeps the last successful rows, marked as cached, alongside any available company dates.
r refreshes the macro window and resumes missing, stale or failed report
date checks. It keeps fresh successful company dates, so it is not a full
watchlist refresh. To recheck one fresh company date, open its Earnings
view and press r there. An access or rate-limit error pauses the date
sweep until a manual retry, rather than repeating it for every company.

? lists every action with the keys currently bound to it and the name to
use in the config to rebind it. s opens the settings: price source, API
keys, poll interval (applied immediately), color theme and where Enter opens
an article. Save writes all of it, plus the watchlist on screen, to the
config file. } and { walk the color presets live, z hides the header
and the footer for a tmux pane that carries its own status bar, and r
refreshes prices and the visible data.
There are good terminal stock tools already. The two you are most likely to be choosing between are tickrs, which is the closest in shape (Rust, ratatui, charts per ticker), and ticker, which is the most widely used and is built around tracking what you own.
The short version: both are built around the price. This one puts the filings and the scored news next to it, and pays for that with no options chain and a simpler idea of a position.
| alphai-tui | tickrs | ticker | |
|---|---|---|---|
| Price charts | candles, line, SMA/EMA, RSI, volume | line, candle, kagi, volume | none |
| Whole watchlist at once | summary grid, table with sparklines | summary pane | quote table |
| News with per-article analysis | yes, and marked on the price chart | no | no |
| SEC Form 4 insider activity | chart and filing stream | no | no |
| Earnings filing reads | yes | no | no |
| Extended hours | price and candles | candles | price |
| Options chain | no | yes | no |
| Positions and P&L | quantity and average price, in a view of its own | quantity and average price | cost-basis lots, groups, currencies |
| Export for scripts | --once text, --json |
no | CSV and JSON |
| Price sources | Yahoo, Finnhub, Alpaca | Yahoo | Yahoo, Coinbase |
| A source that stops answering | cached start, automatic switch | no | no |
| Add or remove a ticker in the app | yes | yes | no |
| Rebindable keys | any action, in the config | vim keys | no |
What they do better. tickrs has an options chain with calls and puts by expiry, which this has nothing to answer with, and a kagi chart if that is how you read price. ticker still has the most complete position tracking of the three: several cost-basis lots per holding, named groups and currency conversion, where this one keeps a single average price per ticker and sums in whatever currency the quotes come back in. If you track lots across currencies, ticker is the one to reach for.
One thing worth knowing. Yahoo rate-limits by IP, and every tool here
depends on it, this one included. Three price sources is the hedge: if
Yahoo starts refusing, s switches to Finnhub or Alpaca without leaving
the app.
Homebrew (macOS and Linux):
brew install makeev/tap/alphai-tuiArch Linux, from the AUR:
paru -S alphai-tui-binDebian and Ubuntu, from the apt repository (amd64 and arm64, Ubuntu 22.04 and Debian 12 or newer):
sudo install -d -m 0755 /etc/apt/keyrings
sudo curl -fsSL https://makeev.github.io/alphai-tui-apt/alphai-tui.gpg \
  -o /etc/apt/keyrings/alphai-tui.gpg
echo "deb [signed-by=/etc/apt/keyrings/alphai-tui.gpg] https://makeev.github.io/alphai-tui-apt stable main" \
  | sudo tee /etc/apt/sources.list.d/alphai-tui.list
sudo apt update && sudo apt install alphai-tui
Single .deb files, for an install without the repository, are linked from
the repository landing page.
Through x-cmd, which picks whichever of the methods above your system already has:
x install alphai-tuiPrebuilt binaries for macOS, Linux and Windows, no Rust needed:
curl -LsSf https://github.com/makeev/alphai-tui/releases/latest/download/alphai-tui-installer.sh | sh# Windows
powershell -ExecutionPolicy Bypass -c "irm https://github.com/makeev/alphai-tui/releases/latest/download/alphai-tui-installer.ps1 | iex"Archives for every platform, with checksums, live on the releases page.
With a Rust toolchain (1.85+):
cargo install alphai-tuiOr straight from the repository:
cargo install --git https://github.com/makeev/alphai-tuiOr from a clone:
git clone https://github.com/makeev/alphai-tui
cd alphai-tui
cargo run --release -- AAPL MSFT NVDA BTC-USDalphai-tui NVDA AVGO AAPL MSFT META TSLA AMZN GOOGL BTC-USDThe first run opens the settings screen: pick a price source and paste your
AlphAI key (get one free at alphai.io, Account >
API keys). Leave it empty if you only want quotes and charts. Your watchlist
and options persist in the config file, so next time plain alphai-tui works.
alphai-tui --once AAPL      # print quotes to stdout and exit (for scripts)
alphai-tui --json AAPL      # the same run as JSON, for a status bar
alphai-tui -s finnhub NVDA # explicit source for one run| Flag | Default | Meaning |
|---|---|---|
-s, --source |
yahoo |
Price source: yahoo, finnhub or alpaca |
-e, --every |
15 |
Poll interval, seconds (also a settings row, applied live) |
-r, --range |
5d |
History window: 1d 5d 1mo 3mo 6mo 1y 2y |
-i, --interval |
15m |
Candle size: 1m 2m 5m 15m 30m 60m 1d |
--theme |
default |
Color preset, e.g. catppuccin-mocha (also a key and a settings row) |
--bare |
off | Start without the header and footer, for a tmux pane (z toggles it live) |
--once |
Print quotes to stdout and exit | |
--json |
Print those quotes as JSON instead of a text table (implies --once) |
|
--earnings TICKER |
Print the latest earnings read to stdout and exit (needs an AlphAI key; one request) | |
--config |
Use an alternate config file (Save writes back to it) |
-r and -i set the startup window; the t key cycles the preset
combinations (configurable as [chart] presets) for the session without
persisting them.
--json prints one object per symbol, in the order they were asked for, so
a status bar or a cron job can read the numbers instead of parsing a table:
alphai-tui --json AAPL NVDA
alphai-tui --json AAPL | jq -r '.[0] | "\(.symbol) \(.price) \(.change_pct)%"'
[
{
"candles": 79,
"change": 11.23,
"change_pct": 3.5612,
"currency": "USD",
"day_range": { "high": 326.68, "low": 316.57 },
"extended": { "change": -1.07, "change_pct": -0.3276, "price": 325.5 },
"fetched": "2026-09-11T09:31:38Z",
"fifty_two_week": { "high": 344.57, "low": 226.65 },
"prev_close": 315.34,
"price": 326.57,
"source": "yahoo",
"symbol": "AAPL",
"volume": 69820744.0
}
]A ticker you hold also carries a position object with qty,
avg_price, cost, price (the price used to value the holding,
including extended trading), value, pnl, and pnl_pct and day_pnl when
those can be worked out, so a status bar can show the money rather than
the price:
alphai-tui --json AAPL | jq -r '.[0].position | "\(.pnl) (\(.pnl_pct)%)"'symbol and price are always there; the rest depends on what the source
answers, and a figure it does not answer is left out rather than sent as
null. change and change_pct count from the previous close, while the
extended object measures its own move from the regular session's close,
the way a broker screen does. A symbol that failed still gets a row, as
{"symbol": "…", "error": "…"}, so a watchlist of four always prints four.
Warnings go to stderr, so stdout stays a valid JSON document.
Without symbols it prints the watchlist you saved in the app, and -s,
-r and -i work the same as for a normal run:
alphai-tui --json                    # whatever the config file holds
alphai-tui --json -s alpaca AAPL     # another source for this one run

# a row per ticker for awk, a spreadsheet or a database
alphai-tui --json | jq -r '.[] | [.symbol, .price, .change_pct] | @tsv'

# append a snapshot to a log you can chart later; every row carries `fetched`
alphai-tui --json | jq -c '.[]' >> quotes.jsonl

# report only what broke, since the exit code is 0 either way
alphai-tui --json | jq -r '.[] | select(.error) | "\(.symbol): \(.error)"'

# watch a level from cron, printing nothing until it breaks
alphai-tui --json NVDA | jq -e '.[0].price > 200' >/dev/null &&
  echo 'NVDA above 200'
For a status bar, call a small wrapper instead of inlining the pipeline,
because a jq filter quoted inside tmux.conf or an i3blocks config turns
unreadable fast:
#!/bin/sh
# ~/bin/quote-bar
alphai-tui --json AAPL NVDA |
  jq -r 'map(select(.error | not)
             | "\(.symbol) \(.price) \(.change_pct * 100 | round / 100)%")
         | join("  ")'
set -g status-interval 60
set -g status-right '#(~/bin/quote-bar)'Dropping the error rows there keeps a dead symbol from writing null into
the bar, and the rounding trims -6.1302 to the two decimals a bar has
room for.
One run costs one request per symbol (two on alpaca), so give the loop an interval rather than letting the bar refresh as fast as it likes. Yahoo throttles by IP address and answers a burst with 429s for several minutes afterwards, which is long enough to lose the pane you built. A minute between runs is plenty for a status bar; below that, use a keyed source.
CLI arguments win over the config file; the config file wins over built-in
defaults. API keys can also come from env vars, which win over the config:
ALPHAI_API_KEY, FINNHUB_API_KEY, APCA_API_KEY_ID, APCA_API_SECRET_KEY.
| Key | Where | Action |
|---|---|---|
Tab / 1..9 |
everywhere | switch view |
↑ ↓ / j k |
table, chart, split | select ticker |
a |
everywhere | add a ticker: type the symbol, Enter adds it, Esc cancels |
d |
everywhere | remove the selected ticker (the last one stays) |
p |
everywhere | set what you hold of the ticker: qty avg, Enter saves it to the config, an empty line clears it |
↑ ↓ / j k |
news, insider | scroll articles |
↑ ↓ / j k |
earnings | scroll the read |
↑ ↓ / j k |
calendar | select event |
← → / h l |
news, insider, earnings | switch ticker |
Enter / o |
news, insider | open article in browser |
Enter / o |
earnings | open the read on alphai.io |
Enter / o |
calendar | open macro source or the company's Earnings view |
v |
news, insider | fullscreen article card; scroll with ↑ ↓, Esc closes |
E |
everywhere | draw pre and post market candles too (Yahoo and Alpaca) |
x |
news | flip the list/card layout: side-by-side or stacked |
PgUp PgDn |
news | scroll the article card pane |
PgUp PgDn |
earnings | page through the read |
PgUp PgDn |
calendar | move ten events |
↓ / j on the last row |
news, insider | load the next page of the feed |
f |
news, split | cycle news scope: selected ticker, whole market, trending |
+ / - |
news, insider, split | raise / lower the visible feed's score filter (news: relevance, starts at 7; insider: trade size, starts at 4) |
g |
insider | cycle the trades chart window: 3 months, 12 months, off |
c |
chart, split | toggle candlestick / line chart |
m |
chart, split | toggle the two moving average overlays |
e |
chart, split | average them simple (SMA) or exponential (EMA) |
i |
chart, split | toggle the RSI(14) panel |
b |
chart, split | toggle the volume panel |
n |
chart, split | mark the ticker's cached news on the candles |
t / T |
everywhere | cycle candle interval presets forward / back (each interval with a matching history window; the list is configurable as [chart] presets) |
r |
everywhere | refresh prices and visible data; Calendar refetches macro and retries missing, stale or failed dates |
z |
everywhere | bare mode: hide the header and footer, giving both rows to the view |
} / { |
everywhere | next / previous color preset (session-only until Save) |
s |
everywhere | settings |
? |
everywhere | help overlay: every action with its current keys |
q / Esc / Ctrl-C |
everywhere | quit |
alphai-tui is a single self-contained process, so a terminal multiplexer
(tmux, zellij, screen, or your terminal's own splits) turns it into a
custom trading workspace: run one instance per pane and switch each pane
to the view you want with 1..9.
tmux new-session -d -s market 'alphai-tui --bare NVDA'
tmux split-window -h -t market 'alphai-tui --bare AAPL'   # news pane on the right
tmux select-pane -t market -L
tmux split-window -v -t market 'alphai-tui --bare AVGO'
tmux split-window -v -t market 'alphai-tui --bare TSLA'
tmux attach -t market
--bare drops the header and the key hints, which a pane with tmux's own
status bar has little use for, and hands both rows to the view; z toggles
it in a running instance and [ui] bare = true makes it the default. The
quote rail stays, so a bare pane still names its ticker and its price.
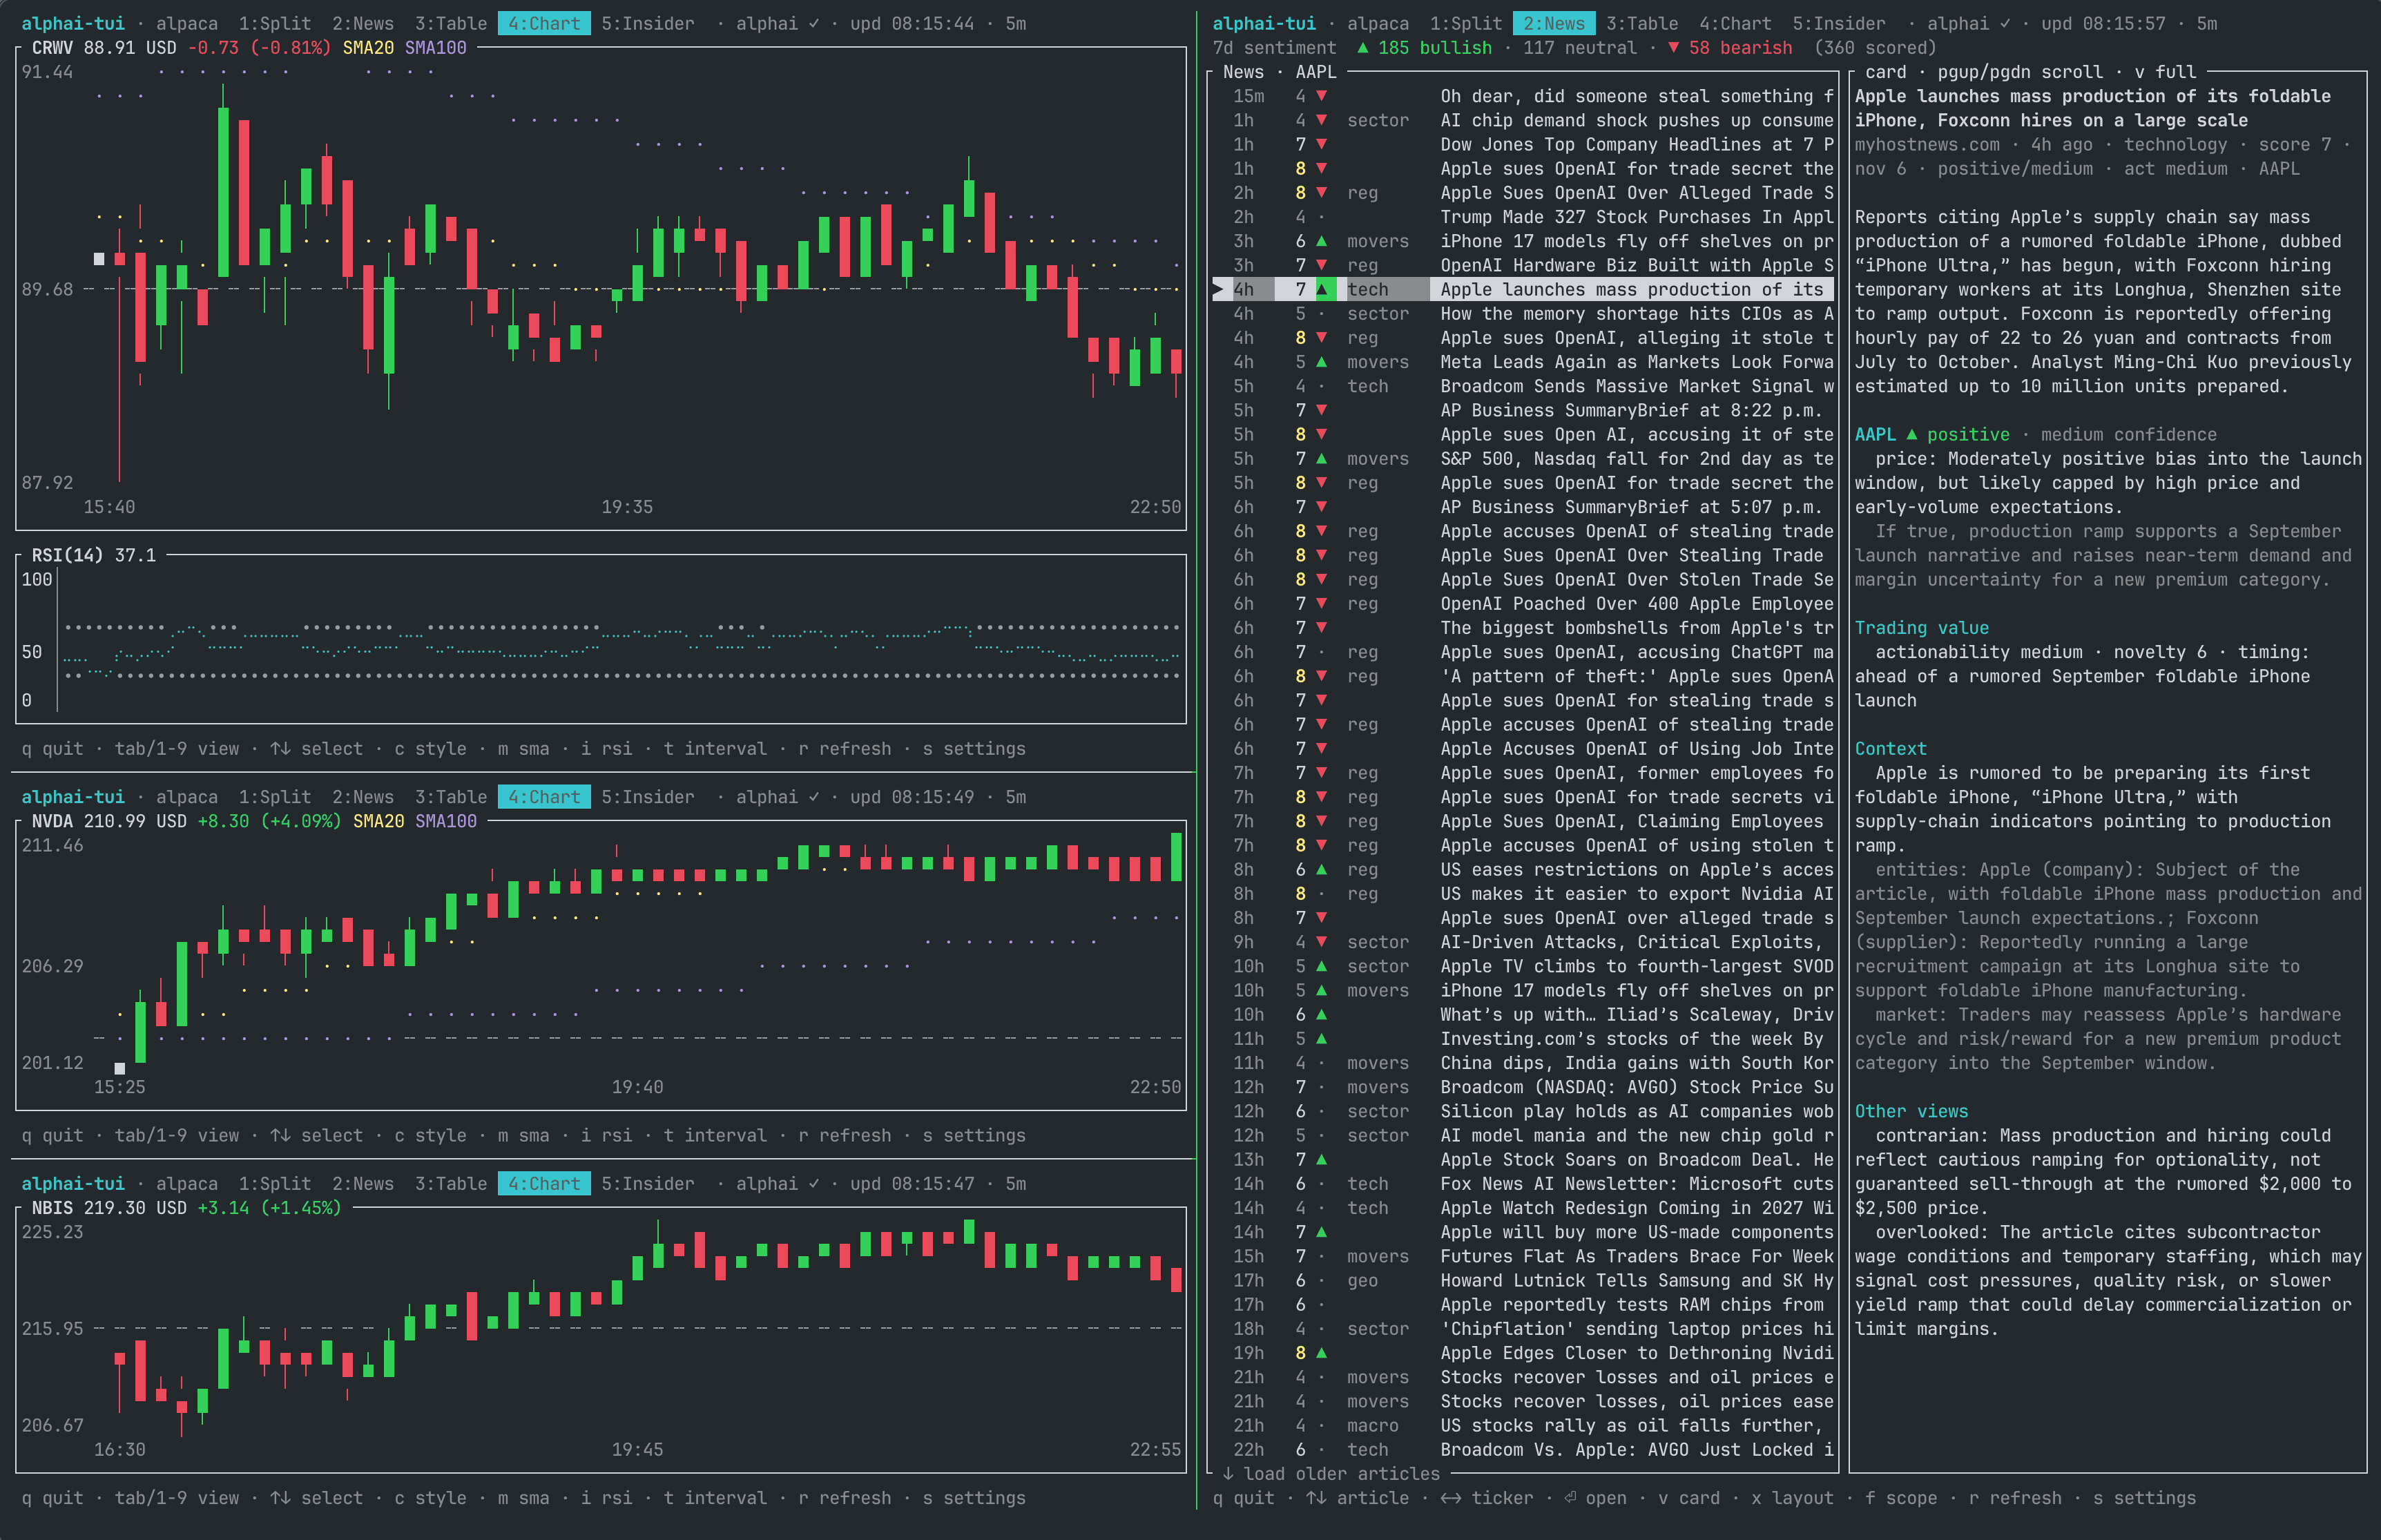
Press 4 in the three chart panes and 2 in the tall one, and you get a
wall of charts next to a live scored feed:
Two things the instances share. The config file is one: the last pane to save settings wins, so set things up once and let the other panes just read it. Your AlphAI key's rate budget is the other: every pane showing news or insider data spends requests from the same per-key allowance, so on a free key keep an eye on how many such panes you open.
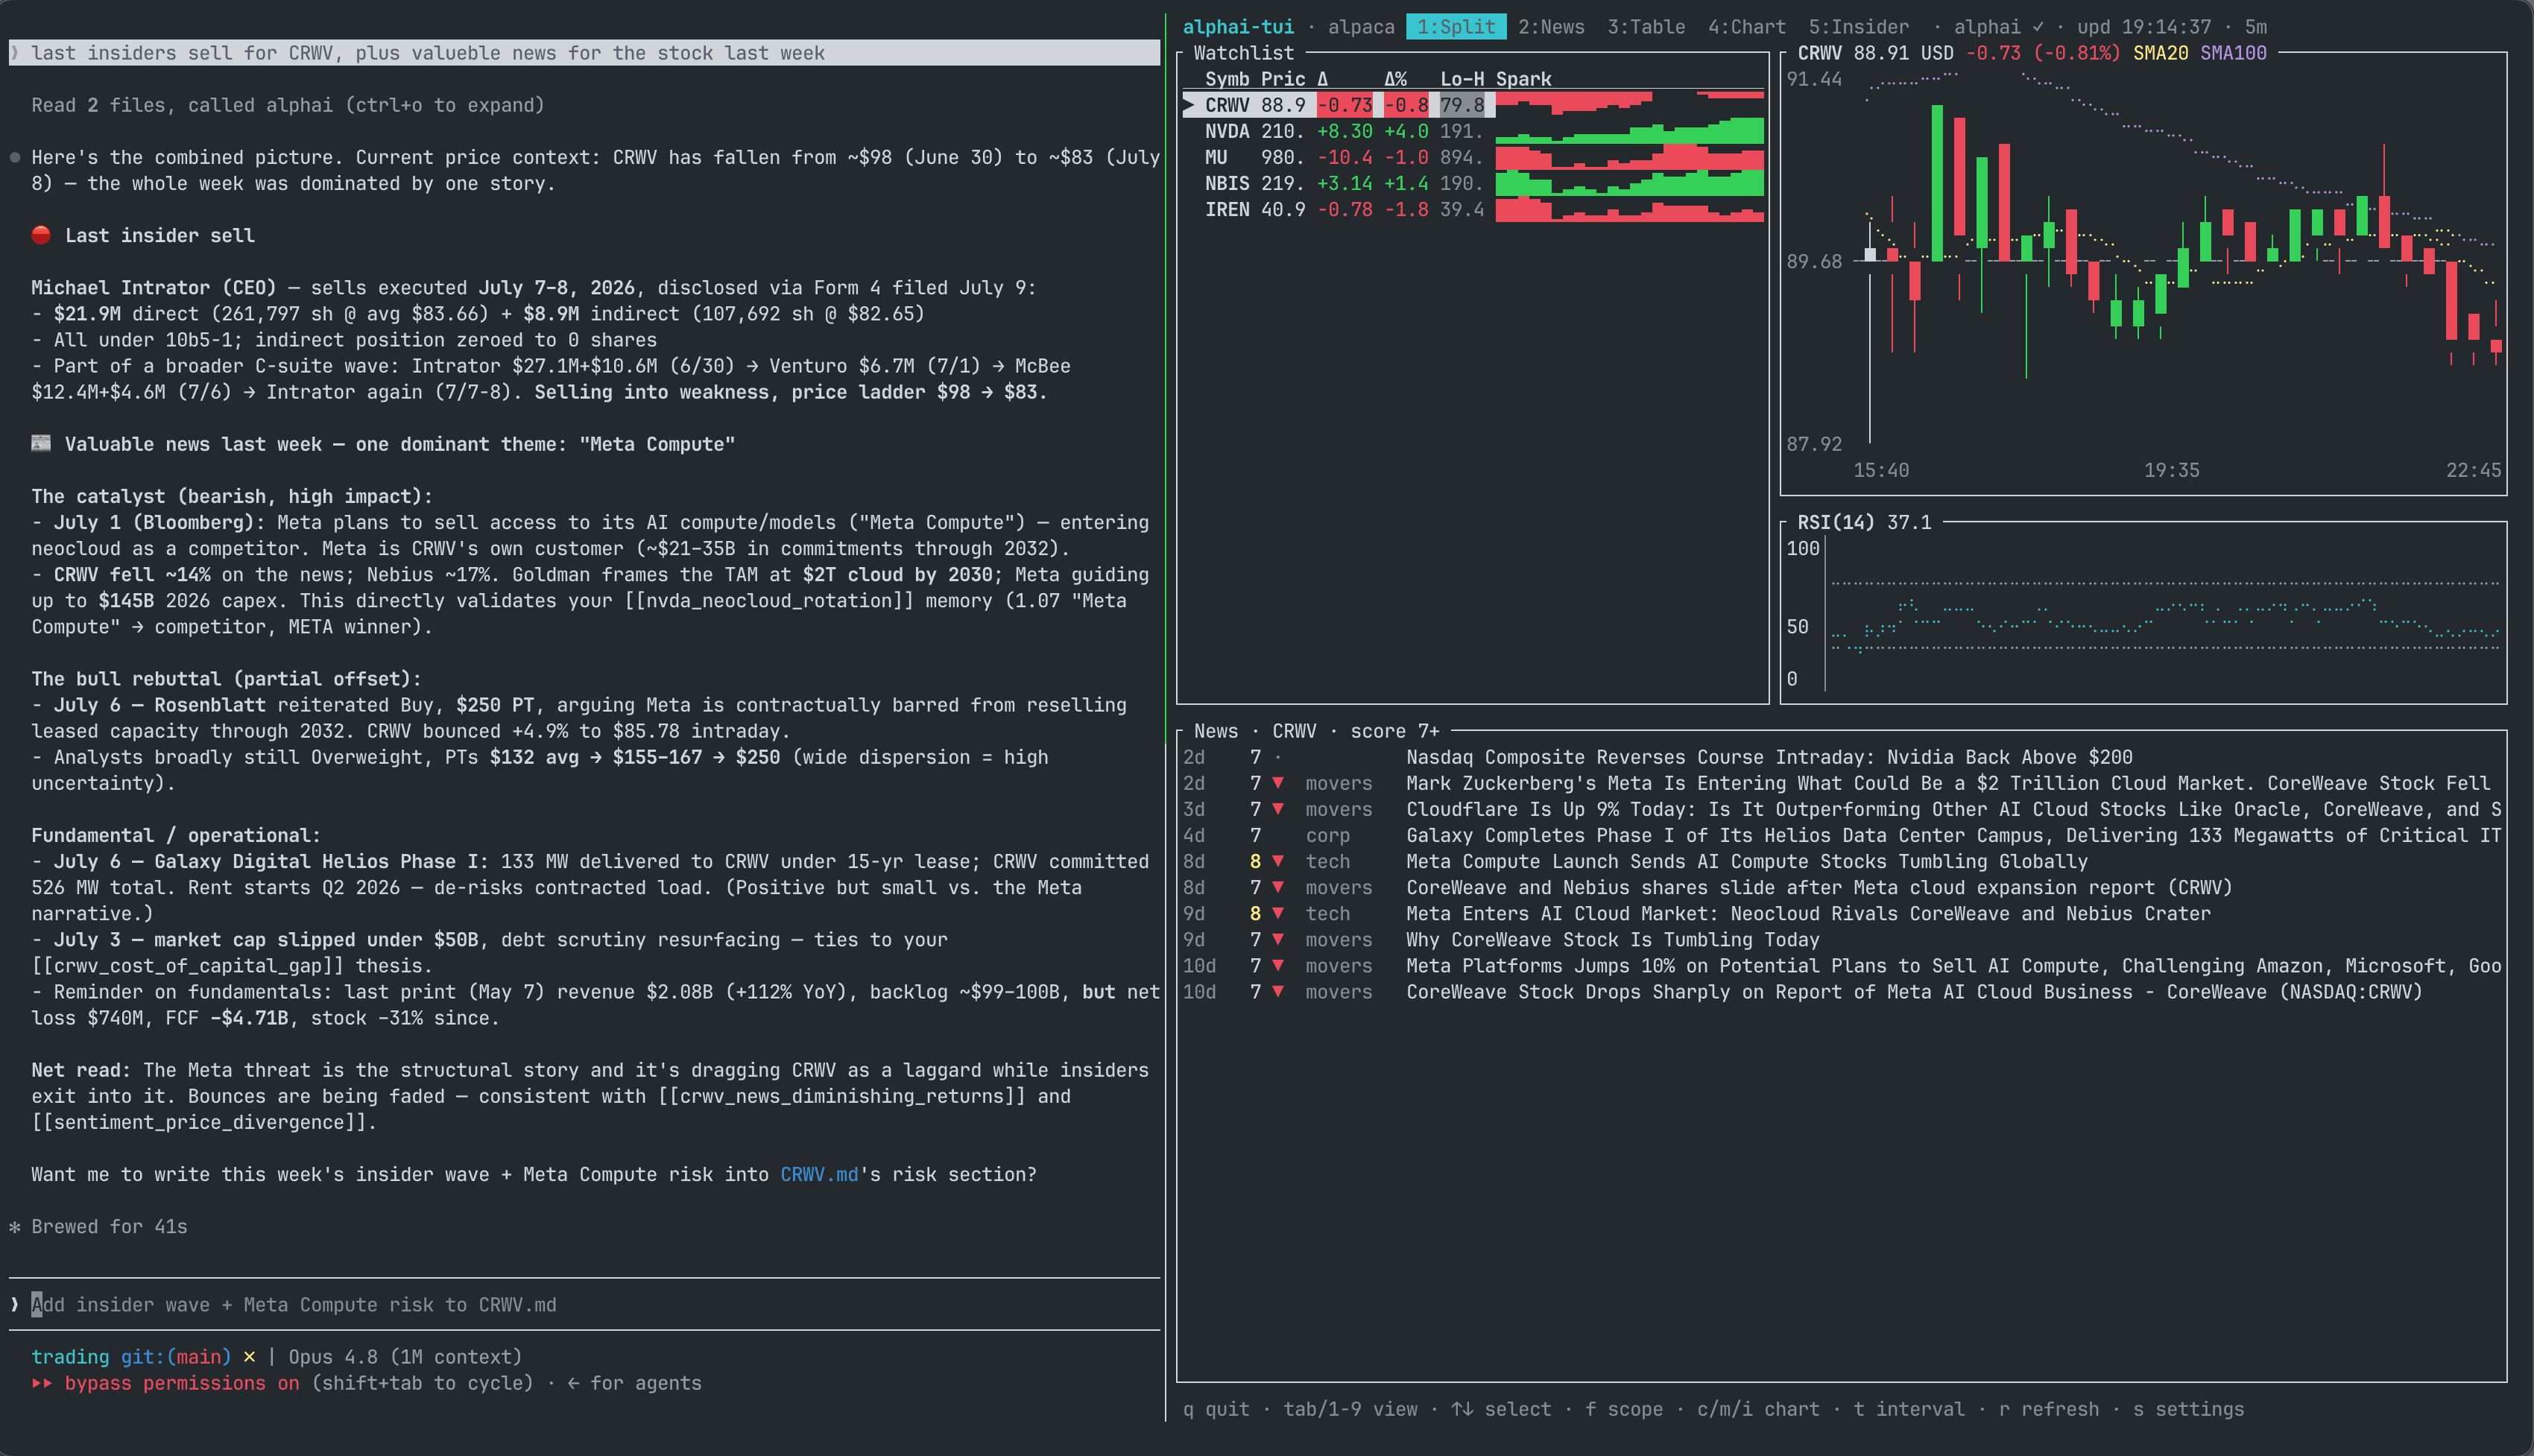
The same trick turns the terminal into a full trading desk with an AI analyst on staff. Run an agent such as Claude Code in the pane next to alphai-tui and connect it to the AlphAI MCP server, which serves the same news, sentiment and insider data as the dashboard. You watch the tape on one side while the agent digs through whatever the tape surfaces: ask it for the last insider sells and the news that moved the stock this week, and get a sourced brief without leaving the terminal.
Prices
-
yahoo: no API key, intraday quote and history in one request. Timing varies by exchange; extended quotes use the source's timestamps, never the time a response was fetched. Crypto and FX tickers work asBTC-USD,EURUSD=X. Includes extended hours, 52-week range and full market volume. A daily chart may make an additional cached intraday request to timestamp its extended quote.Econtrols which candles are drawn. -
finnhub: needs a key (free at finnhub.io). Real-time-ish quotes; historical candles are premium-only there, so charts build up from quotes collected during the session and reset on restart. Range/interval switching withtdoes not apply to that synthetic history, and candles degrade to flat marks. Free tier is 60 req/min, one request per ticker per poll; the app warns on startup and in the settings screen when the watchlist and the poll interval together go over that. Crypto needs exchange-prefixed symbols (BINANCE:BTCUSDT). Its quote endpoint covers the regular session only, so no extended-hours price, 52 week range or volume. -
alpaca: needs a key id and secret (free at alpaca.markets). Realtime quotes from the IEX feed plus real historical bars, so charts are complete right after start instead of growing over the session. Crypto works in the usualBTC-USDform. IEX covers one exchange, with sparse pre-market trading from 08:00 ET and after-hours until 17:00 ET on normal days. The default IEX mode supplements extended quotes and candles with consolidated SIP data delayed 15 minutes, then Yahoo if SIP is unavailable or missing the relevant session. Regular candles and the headline quote remain IEX. The chart labels the extended feed, and the rail labels the quote's own source and age. Volume bars from different feeds are not consolidated into a single session; IEX's total is not presented as whole-market volume. Once extended candles are on the chart, regular IEX candles take their volume from the same consolidated bars, so both sessions share one scale. The newest 15 minutes have no volume bar until the delayed feed covers them. With extended hours off, the panel shows IEX's own counts and labels themIEX only.Supplemental results are cached for 60 seconds per symbol/window. Empty or failed refreshes retain prior session data. A Yahoo IP block pauses supplemental Yahoo requests across the watchlist for 30 minutes; it does not fail an otherwise successful Alpaca poll. Extended quotes remain available with
Eoff, independently of the candle setting.ALPACA_FEED=delayed_sipuses consolidated data for both regular and extended sessions with a 15-minute delay.ALPACA_FEED=sipuses realtime SIP and requires a paid subscription. The delayed mode usesfeed=delayed_sipfor snapshots andfeed=sipfor historical bars; the client sets the historical end to 15 minutes ago on every subscription. During that lag after the opening bell, today's delayed pre-market quote remains visible until regular data arrives, with its PRE label and age. Getting free keys:- Sign up at alpaca.markets. Email is enough; market data and paper trading need no KYC.
- The free Basic data plan is enabled by default.
- In the dashboard switch the environment to Paper (fine for data), then Home > API Keys > Generate. Copy the Key ID and the Secret; the secret is shown only once.
- Paste both in the settings screen (
s) or exportAPCA_API_KEY_IDandAPCA_API_SECRET_KEY.
Free plan notes: the IEX feed is realtime but thin (roughly 2 to 3 percent of market volume, so charts of illiquid names can be sparse), and the API allows 200 requests/min. The app makes 2 requests per ticker per poll, plus up to 2 per minute for cached SIP supplementation. The startup and settings warnings include that supplemental allowance when suggesting a polling interval. Changing candle presets can trigger a fresh cache fill. Alpaca sizes a bars page by the minute bars behind it, roughly two weeks of a liquid name's extended hours, so the first fill of a chart window follows up to three more pages to reach the start of the IEX series; later refreshes take the newest page only.
When a source stops answering
Every keyless quote feed throttles by IP sooner or later, and Yahoo's blocks are long: measured from one address, the first arrived after about ten requests and held for 19 minutes, the second came after eight and held for over an hour. No client-side retry shortens that, which is why the usual report about tools in this category is that they just stop working. Three things happen here instead:
- Startup is never empty. The last good quotes and candles of every ticker
are kept in
<cache dir>/alphai-tui/quotes.json(~/.cacheon Linux,~/Library/Cacheson macOS), written at most once a minute, and put on screen while the first poll is in flight. The quote rail labels them (cached 2h ago) until live data replaces them, so old prices are never passed off as current. Entries older than a week, or taken with a different range and interval, are ignored rather than drawn. - A
429from Yahoo says what it actually is: an IP block that lasts tens of minutes, with the advice to switch source. It is also the one refusal the client does not retry, since another request only feeds the counter holding the block open. - If every ticker keeps failing for 45 seconds, the app switches to another
source that has its credentials and says so in the footer. It keeps the
rows already on screen, never switches back on its own (probing a
throttled feed is how a block gets extended) and never returns to a
source that failed this session. The header always names the source in
use,
spicks another by hand, andsource_fallback = falsein the config turns the whole thing off.
News, sentiment, insider
- AlphAI: AI-enriched financial news feed. Every
article carries validated tickers, a category, a deterministic 1 to 10
relevance score and a full per-ticker AI analysis (sentiment, price
impact, confidence, novelty, actionability); insider rows are generated
from SEC EDGAR Form 4 filings, one row per economic event. The free tier
(no card) allows 20 requests/min and 100/day. The app is careful with
that budget: news and insider feeds fetch only what the visible view needs
(the trending scope is one extra request), and cache each response for 5 minutes
(
[ui] alphai_ttl_secsin the config changes that), loads further pages only when you ask for them, and the article card reuses data already fetched with the list. The refresh at the end of that cache window asks the server what has arrived since the previous check rather than re-reading the newest page, which costs the same single request, keeps the pages you loaded and the row you are on, and is the only way to see an article that entered the feed behind its own publish time. The relevance filter is applied by the server, so filtered-out articles never occupy page slots; moving it with+/-refetches the visible feed, one request per press at most. The Insider view's rollup and trades chart arrive as one bundle alongside the feed's first page and live in the same cache, so the chart costs no extra requests and thegwindow switch is free. The Earnings view costs one request per ticker, made only while that view is on screen and cached for an hour, because a read is published once a quarter and never changes afterwards. That single response carries the whole history of reads for the ticker and its next confirmed report date, which is also what fills the read shown in the News card, so opening the card still costs nothing. The macro calendar is shared by all views, including the quote-rail flag, and costs one request per six hours by default. Calendar checks company dates using the same earnings response, one company at a time, and keeps them for six hours. These intervals arealphai_ttl_secs * 72; the Earnings view uses* 12. At the minimum setting of 30 seconds, Calendar's interval is 36 minutes, not six hours. Ten companies with Calendar continuously open for 24 hours cost roughly 44 requests at the default TTL, including the macro window. Twenty-five cost roughly 104, before other activity, so a larger list needs a longer TTL. There is no daily quota limiter, and restarting loses these caches. The four-second date-check pace limits this sweep, not other requests or other processes using the key. Manual refresh adds a macro request and any missing, stale or failed company checks. Errors wait for a manual retry; successful cached rows remain visible in Calendar. Feeds page 20 articles at a time, the most every plan allows (50 on Pro keys, detected automatically). Paging back past your plan's archive horizon (30 days on Free, 90 on Basic) shows an upgrade hint instead of older articles. Full API reference: alphai.io/developers.
Ticker forms follow the US/Yahoo convention (AAPL, BTC-USD, VOD.L),
which is also what AlphAI uses. Finnhub-specific symbols like
BINANCE:BTCUSDT will not have news attached.
~/.config/alphai-tui/config.toml on Linux and macOS (%APPDATA% on
Windows), created by the settings screen with mode 0600 since it can hold
keys; --config PATH points at a different file. Saving the settings also
persists the watchlist on screen. Every key is optional. A misspelled value
in the [ui], [chart], [theme] or [keybindings] sections prints a
warning on startup and keeps that entry's default; only a TOML syntax error
makes the whole file fall back to defaults. The [ui] and [chart] sections set startup
defaults; the session keys (x, f, g, +, -, c, m, i, b, e, n, t)
still change everything live without persisting it:
source = "yahoo"
watchlist = ["AAPL", "MSFT", "NVDA", "BTC-USD"]
every = 15
range = "5d"         # startup history window
interval = "15m"     # startup candle size; t cycles the chart presets live
news_open = "alphai"  # where enter opens news: "alphai" or "original"
source_fallback = true  # switch source when this one stops answering

[keys]
alphai = "ak_live_..."
finnhub = ""
alpaca_key_id = ""
alpaca_secret = ""

[ui]
default_view = "split"    # split | news | table | chart | insider | earnings | summary | portfolio | calendar
quote_rail = true         # the price line under the tabs
bare = false              # start with no header and no footer (--bare, z)
news_layout = "side"      # side | stacked
news_scope = "ticker"     # ticker | market | trending
borders = "rounded"       # panel frames: rounded | plain
news_min_score = 7        # minimum relevance score in news feeds, 1 to 10
insider_min_score = 4     # insider feed filter; the score tracks trade size
insider_chart = "3m"      # insider trades chart window at start: 3m | 12m | off
alphai_ttl_secs = 300     # news/sentiment/insider cache lifetime, 30 to 86400

[chart]
style = "candles"         # candles | line
sma = true                # moving average overlays visible at start
ma_type = "sma"           # sma | ema, both using the periods below
rsi = true                # RSI panel visible at start
volume = true             # volume panel visible at start
extended_hours = true     # draw pre and post market candles; Shift+E toggles live
timezone = "exchange"    # exchange (ET for US stocks), local, utc
session_shading = true   # warm pre-market / cool after-hours backgrounds
time_grid = true         # vertical grid shared by price, volume and RSI
news_markers = true       # mark the ticker's cached news on the candles
sma_fast = 20             # 2 to 250
sma_slow = 100            # 2 to 250; also sizes the history warm-up
rsi_period = 14           # 2 to 100
right_margin_pct = 20     # free space right of the newest candle, 0 to 50
presets = [               # the combos the t and T keys cycle
  ["1d", "5m"],
  ["5d", "15m"],
  ["1mo", "60m"],
  ["6mo", "1d"],
  ["1y", "1d"],
]

# What you hold, one entry per ticker. The p key writes these for you and
# saves them here immediately; editing them by hand works just as well.
# A ticker listed here is polled even when it is not on the watchlist.
[[positions]]
symbol = "AAPL"
qty = 12
avg_price = 182.31

[[positions]]
symbol = "BTC-USD"
qty = 0.25
avg_price = 58200
A quantity may be fractional, for crypto or for a broker that sells
slices, and negative for a short, in which case a falling price is a
profit. avg_price is what one unit cost on average: this is not a ledger
and it does not keep lots, so a second buy means updating the average
yourself (or letting p overwrite the line).
[theme] preset swaps in a ready-made palette:
[theme]
preset = "catppuccin-mocha"
} and { walk the presets live, --theme catppuccin-mocha picks one
for a single run, and the Theme row in the settings screen (s) does
both: ← → cycle it with a live preview, Save writes it here.
Available: default, catppuccin-mocha, catppuccin-macchiato,
catppuccin-frappe, catppuccin-latte, dracula, gruvbox-dark,
gruvbox-light, nord. Presets are written in hex, so they want a
terminal with 24-bit color. Regular-session backgrounds remain the
terminal's own background; the extended-session tints follow the palette.
default uses ANSI foregrounds and subtle RGB session backgrounds;
session_shading = false preserves a fully transparent chart background. The two
light ones (catppuccin-latte, gruvbox-light) expect a light terminal
background.
pre_market_bg and post_market_bg are the session background slots;
each accepts the same color formats as the foreground slots. Setting either
to "reset" uses the terminal background for that session.
Every color the views draw comes from a named slot, and the optional
[theme] table recolors any of them, over the preset when there is one.
Values are ANSI color names (case-insensitive, light-blue, grey),
#RRGGBB hex, or an ANSI-256 index written as a string like "245". A
bad color, a misspelled slot or an unknown preset prints a warning on
startup and keeps the default; it never breaks the config file. The
defaults are the values shown:
[theme]
accent = "cyan"          # header title, active tab, overlay borders, headings
accent_text = "black"    # text on the active tab
up = "green"             # price up: candles, deltas, sparklines
down = "red"             # price down
flat = "gray"            # unchanged / no data
pos = "green"            # bullish sentiment, insider buys
neg = "red"              # bearish sentiment, insider sells
error = "red"            # error messages
warn = "yellow"          # notices and the editing highlight
score_high = "yellow"    # relevance score 8 to 10
sma_fast = "yellow"      # fast moving average overlay
sma_slow = "magenta"     # slow moving average overlay
rsi_line = "cyan"        # RSI line
ref_line = "darkgray"    # previous close and RSI 30/70 reference lines
border = "reset" # panel frames; reset keeps the terminal's foregroundThe optional [keybindings] table rebinds any action. An action you list
replaces its default keys entirely; actions you leave out keep theirs. The
value is one key or a list of keys:
[keybindings]
quit = "ctrl-q"
open = ["enter", "w"]
next_preset = "]"
prev_preset = "["
A key is written as [ctrl-][alt-][shift-]<base>, where base is a single
character or one of the named keys: esc, enter, tab, backtab,
space, up, down, left, right, home, end, pgup, pgdn,
backspace, delete, insert, f1 to f12. shift- plus a letter
means the uppercase letter (shift-t equals T), and shift-tab equals
backtab.
The actions: quit, next_view, prev_view, settings, help,
refresh, up, down, left, right, page_up, page_down, open,
card, cycle_scope, cycle_layout, score_up, score_down,
insider_chart, chart_style, toggle_sma, toggle_rsi,
toggle_volume, news_markers, ma_type, next_preset, prev_preset,
next_theme, prev_theme, toggle_bare, add_ticker, remove_ticker,
position, extended_hours.
The ? help overlay shows this list with the current keys next to it.
Reserved and never remappable: ctrl-c (force quit), esc, the digits
1 to 9 (view hotkeys), and the keys inside the settings form. A bad or
reserved key, an unknown action, or a key claimed by two actions prints a
warning on startup and falls back safely; the footer always shows the keys
that are actually bound.
The AlphAI response cache (5 minutes), the feed page sizes, the 2 second
poll floor and the chart warm-up factors are fixed. They keep the app a
fair citizen of the free API tiers, and a config knob for them would turn
an innocent-looking file into an abuse vector. ALPACA_FEED,
ALPHAI_API_URL and ALPACA_DATA_URL stay env-only debug overrides for
the same reason.
src/
  domain.rs      Quote, Candle, TickerData, Range/Interval
  config.rs      config file load/save (CLI > env > file > defaults)
  source/        DataSource trait + implementations
    registry.rs  the one place a new source registers; CLI, settings and keys derive from it
    http.rs      shared client builder, JSON fetching and error helpers
    yahoo.rs     Yahoo v8 chart endpoint (quote + history in one call)
    finnhub.rs   Finnhub /quote with synthetic session history
    alpaca.rs    snapshot + real historical bars (IEX/SIP feeds, crypto)
  alphai.rs      AlphAI API client + demand-driven fetch task (TTL cache)
  keymap.rs      semantic actions + the key table (footer hints derive from it)
  theme.rs       semantic color palette ([theme] overrides)
  indicators.rs  SMA, EMA and RSI (Wilder smoothing)
  poller.rs      fetches all symbols concurrently on a timer -> mpsc channel
  app.rs         App state, event loop, key handling
    app/feeds.rs     feed cache and every AlphAI request-budget guard
    app/settings.rs  settings overlay state, rows derived from the registry
  ui/            View trait + implementations
    table.rs     watchlist table
    chart.rs     candlestick + line chart, SMA overlays, volume and RSI panels
    split.rs     table + chart
    news.rs      article list + sentiment rollup + detail pane
    insider.rs   Form 4 rollup + filing list
    insider_chart.rs  log-scale trades scatter + weekly dollar bars
    earnings.rs  structured earnings read + the schedule line
    calendar.rs  watchlist agenda, report-date progress and event flags
    article.rs   modal full-article card (AI analysis, context)
    settings.rs  modal settings overlay
Data flows one way: background tasks (price poller, AlphAI fetcher) push
events over an mpsc channel into App::apply; views are stateless renderers
over &mut App. The UI never blocks on the network, and every AlphAI
request-budget guard lives in one file (app/feeds.rs).
- Implement
source::DataSource(one asyncfetchreturning quote plus candles) in a new module undersrc/source/. The helpers insource/http.rscover the client, JSON fetching and error plumbing. - Append one
SourceInfoentry tosource/registry.rs: id, aliases, a settings hint, the key fields it needs and a constructor. The--sourcehelp and error list, the settings screen rows and picker cycle, config[keys]persistence and env-var overrides all derive from that entry, and the registry tests check it. - Describe the source in this README.
- Implement
ui::Viewas a unit struct in a new module undersrc/ui/: a statelessrenderover&mut App, a newViewIdvariant, a footer hint line, and the capability methods (feed_shown,navigates_articles,has_chart_panel,shows_earnings,shows_calendar) that opt into shared key handling and demand-driven AlphAI fetching. Views never fetch anything themselves. - Add it to
ui::VIEWS. Order in that array defines the tab cycle and the1..9hotkeys; the header pills and the footer hints derive from it.
cargo test          # unit + TestBackend rendering tests
cargo clippy --all-targets
cargo fmt --all -- --check
cargo run -- --once AAPL             # network smoke test without a TTY
ALPHAI_API_KEY=ak_live_... cargo test live_calendar_smoke -- --ignored  # 1 request
ALPHAI_API_KEY=ak_live_... cargo test live_api -- --ignored   # 14 requests
CI runs the first three on every push and pull request, on Linux, macOS and Windows. What changed in each release is in CHANGELOG.md.
Issues and PRs are welcome.
MIT. Not investment advice; data comes from third-party sources and can be delayed or wrong. Respect the terms of the data providers you enable.