

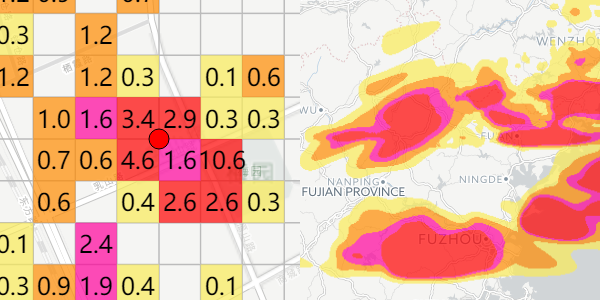
GridLayer plugin for maptalks.js. A layer draws grids.
- Install with npm:
npm install maptalks.gridlayer. - Download from dist directory.
- Use unpkg CDN:
https://cdn.jsdelivr.net/npm/maptalks.gridlayer/dist/maptalks.gridlayer.min.js
As a plugin, maptalks.gridlayer must be loaded after maptalks.js in browsers.
<linkrel="stylesheet" href="https://cdn.jsdelivr.net/npm/maptalks/dist/maptalks.css"><scripttype="text/javascript" src="https://cdn.jsdelivr.net/npm/maptalks/dist/maptalks.min.js"></script><scripttype="text/javascript" src="https://cdn.jsdelivr.net/npm/maptalks.gridlayer/dist/maptalks.gridlayer.min.js"></script><script>vargrids=[{center : [0,0],// center of the gridwidth : 100,// width of the grid cellheight : 100,// height of the grid cell// unit of cell width/height, possible values: // * projection : projected coordinate// * meter : meters of geographic distance// * degree : longtitude/latitude degreesaltitude : 0,// altitude of grid in meterunit : 'projection',cols : [-1,Infinity],rows : [-2,5],data : [//Each item is an array, arr[0] is cell idx on X axis, arr[1] is cell idx on Y axis, arr[2] is the data object, properties is data, symbol is cell style[1,2,{properties : {foo : 1,foo2 : 'foo'},symbol : { ... }}],//if arr[0] is an array, it means a range of cell on X axis, from cell[0][0] to cell [0][1][[2,4],5,{symbo : {...}}]//[]]}];varoptions={symbol : {lineWidth : 2}};vargridLayer=newmaptalks.GridLayer('grid',grids,options);gridLayer.addTo(map);</script>Chrome, Firefox, other modern and mobile browsers.
GridLayer is a subclass of maptalks.Layer and inherits all the methods of its parent.
newmaptalks.GridLayer(id,data,options)- id String layer id
- data Object[] | Object see data format below
- options Object options
- renderer String renderer, canvas or gl, gl by default
- symbol Object symbol of the grid, supported properties:
lineWidth(fixed to 1 in gl renderer on windows due to ANGLE),lineColor,polygonFill,polygonOpacity - Other options defined in maptalks.Layer
[{center : [0,0],// center of the gridwidth : 100,// width of the grid cellheight : 100,// height of the grid cell// unit of cell width/height, possible values: // * projection : projected coordinate// * meter : meters of geographic distance// * degree : longtitude/latitude degreesaltitude : 0,// altitude of grid in meterunit : 'projection',cols : [1,Infinity],rows : [2,5],// data formatdata : [//[col, row, { properties : properties, symbol : symbol}]//supported symbol properties : polygonFill, polygonOpacity//col: col_index or [beginIndex, endIndex]//row: col_index or [beginIndex, endIndex]// col is 1, row is 2[1,2,{properties : {foo : 1,foo2 : 'foo'},symbol : {polygonFill : '#f00'}}],//col is from 2 to 4 (3 columns), row is 5[[2,4],5,{symbol : {polygonFill : '#f00'}}],//col is from 2 to 4 (3 columns), row is from 7 to 8 (2 rows)[[2,4],[7,8],{symbol : {polygonFill : '#f00'}}]]}]get layer's grid value
- gridIndex Number grid's index, default is 0
ReturnsObject
set a new grid value to the layer
- grid Object new grid value
- gridIndex Number grid's index, default is 0
update layer's grid data
- data Array set new data
Returnsthis
redraw the layer
Returnsthis
If the layer is empty
ReturnsBoolean
clear the layer
Returnsthis
Get grid's geographic extent
- gridIndex Number grid's index, default is 0
Returnsmaptalks.Extent
Get cell index at coordinate
- coordinate maptalks.Coordinate coordinate
- gridIndex Number grid's index, default is 0
ReturnsNumber[] [col, row]
Get cell's geometry
- col Number cell's col
- row Number cell's row
- gridIndex Number grid's index, default is 0
Returnsmaptalks.Geometry cell geometry
Visit data cells around given coordinate
- coordinate maptalks.Coordinate coordinate
- cb Function callback function, parameter is [col, row, { properties, symbol }], return false to break the visiting
- gridIndex Number grid's index, default is 0
Return cell index and cell geometry at coordinate
- coordinate maptalks.Coordinate coordinate
- gridIndex Number grid's index, default is 0
ReturnsObject { col : col, row : row, geometry : cellGeometry }
export the GridLayer's JSON.
varjson=gridlayer.toJSON();ReturnsObject
We welcome any kind of contributions including issue reportings, pull requests, documentation corrections, feature requests and any other helps.
The only source file is index.js.
It is written in ES6.
- Install dependencies
$ pnpm i- Watch source changes and generate runnable bundle repeatedly
$ npm run dev- Tests
$ npm test- Watch source changes and run tests repeatedly
$ npm run dev- Package and generate minified bundles to dist directory
$ npm run build- Lint
$ npm run lint