





tmplot is a comprehensive Python package for topic modeling analysis and visualization. Built for data scientists and researchers, it provides powerful interactive reports and advanced analytics that extend beyond traditional LDAvis/pyLDAvis capabilities.
Analyze • Visualize • Compare multiple topic models with ease
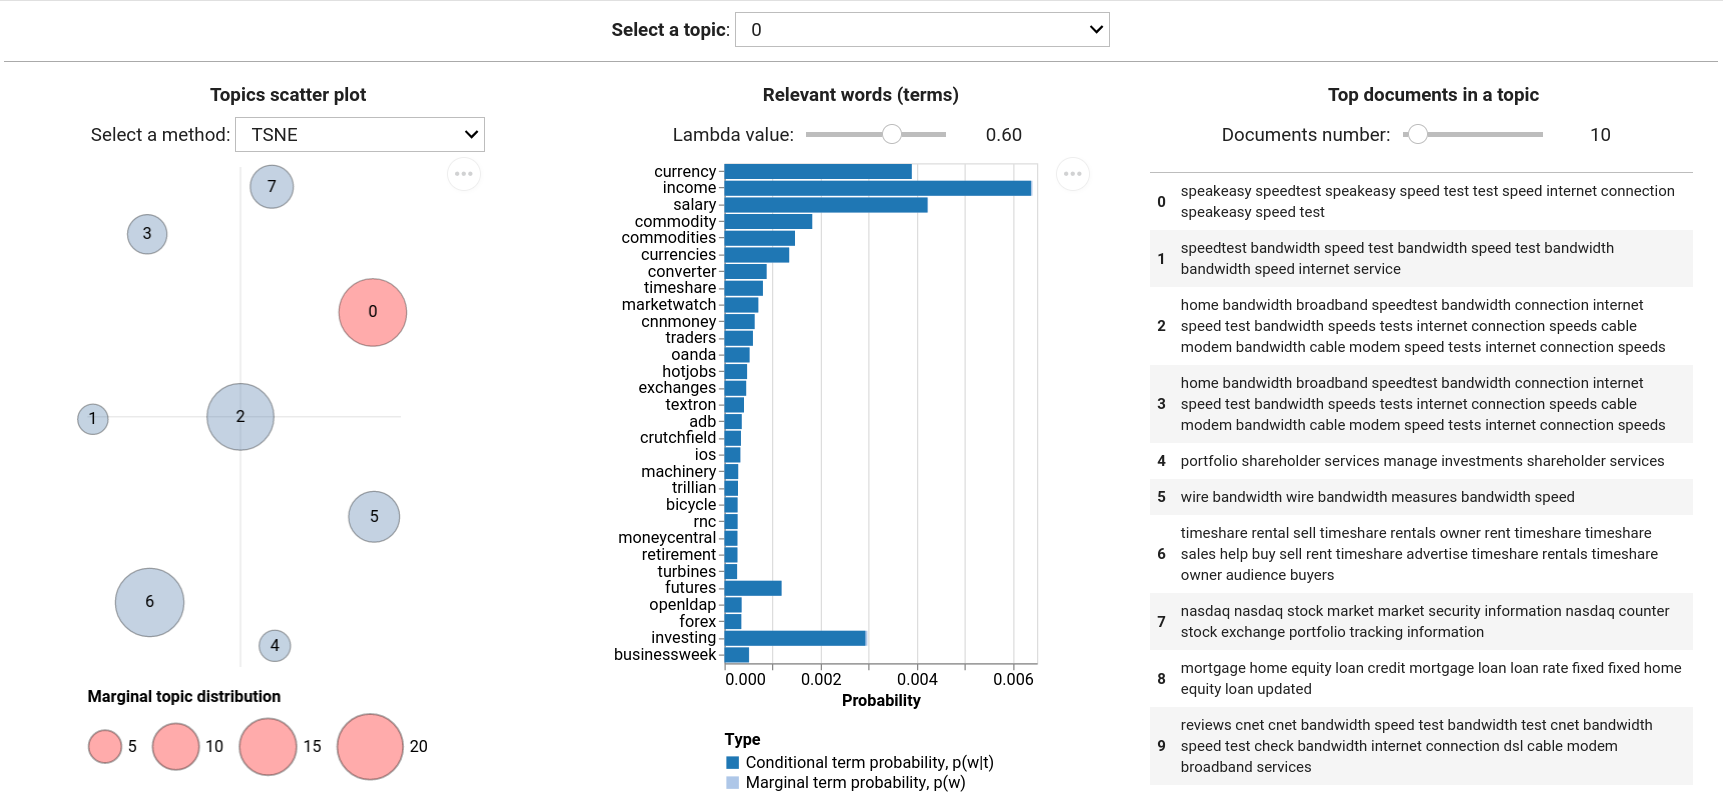
- Topic scatter plots with customizable coordinates and sizing
- Term probability charts with relevance weighting
- Document analysis showing top documents per topic
- Interactive reports with real-time parameter adjustment
- Topic stability analysis across multiple model runs
- Model comparison with sophisticated distance metrics
- Saliency calculations for term importance
- Entropy metrics for model optimization
- tomotopy:
LDAModel,LLDAModel,CTModel,DMRModel,HDPModel,PTModel,SLDAModel,GDMRModel - gensim:
LdaModel,LdaMulticore - bitermplus:
BTM
- Kullback-Leibler (symmetric & non-symmetric)
- Jensen-Shannon divergence
- Jeffrey's divergence
- Hellinger & Bhattacharyya distances
- Total variation distance
- Jaccard index
t-SNE, SpectralEmbedding, MDS, LocallyLinearEmbedding, Isomap
If you find this package useful, please consider donating any amount of money. This will help me spend more time on supporting open-source software.

# From PyPI (recommended)
pip install tmplot
# Development version
pip install git+https://github.com/maximtrp/tmplot.gitimporttmplotastmp# Load your topic model and documentsmodel=your_fitted_model# tomotopy, gensim, or bitermplusdocs=your_documents# Create interactive reporttmp.report(model, docs=docs)
# Or create individual visualizationscoords=tmp.prepare_coords(model)
tmp.plot_scatter_topics(coords, size_col='size')importtmplotastmp# Find stable topics across multiple modelsmodels= [model1, model2, model3, model4]
closest_topics, distances=tmp.get_closest_topics(models)
stable_topics, stable_distances=tmp.get_stable_topics(closest_topics, distances)# Calculate entropy for model selectionentropy_score=tmp.entropy(phi_matrix)
# Analyze topic stabilitysaliency=tmp.get_salient_terms(phi, theta)# Create topic distance matrix with different metricstopic_dists=tmp.get_topics_dist(phi, method='jensen-shannon')
# Generate coordinates with custom algorithmcoords=tmp.get_topics_scatter(topic_dists, theta, method='tsne')
tmp.plot_scatter_topics(coords, topic=3) # Highlight topic 3- Complete Tutorial - Step-by-step guide
- API Reference - Full documentation
- Example Notebooks - Jupyter examples
Core dependencies:numpy, scipy, scikit-learn, pandas, altair, ipywidgets
Optional models:tomotopy, gensim, bitermplus