


Skip to content

Repository files navigation

SpatialData banner

spatialdata-plot: rich static plotting from SpatialData objects

TestsDocumentationCodecovDocumentationAnaconda-Server BadgeDOI

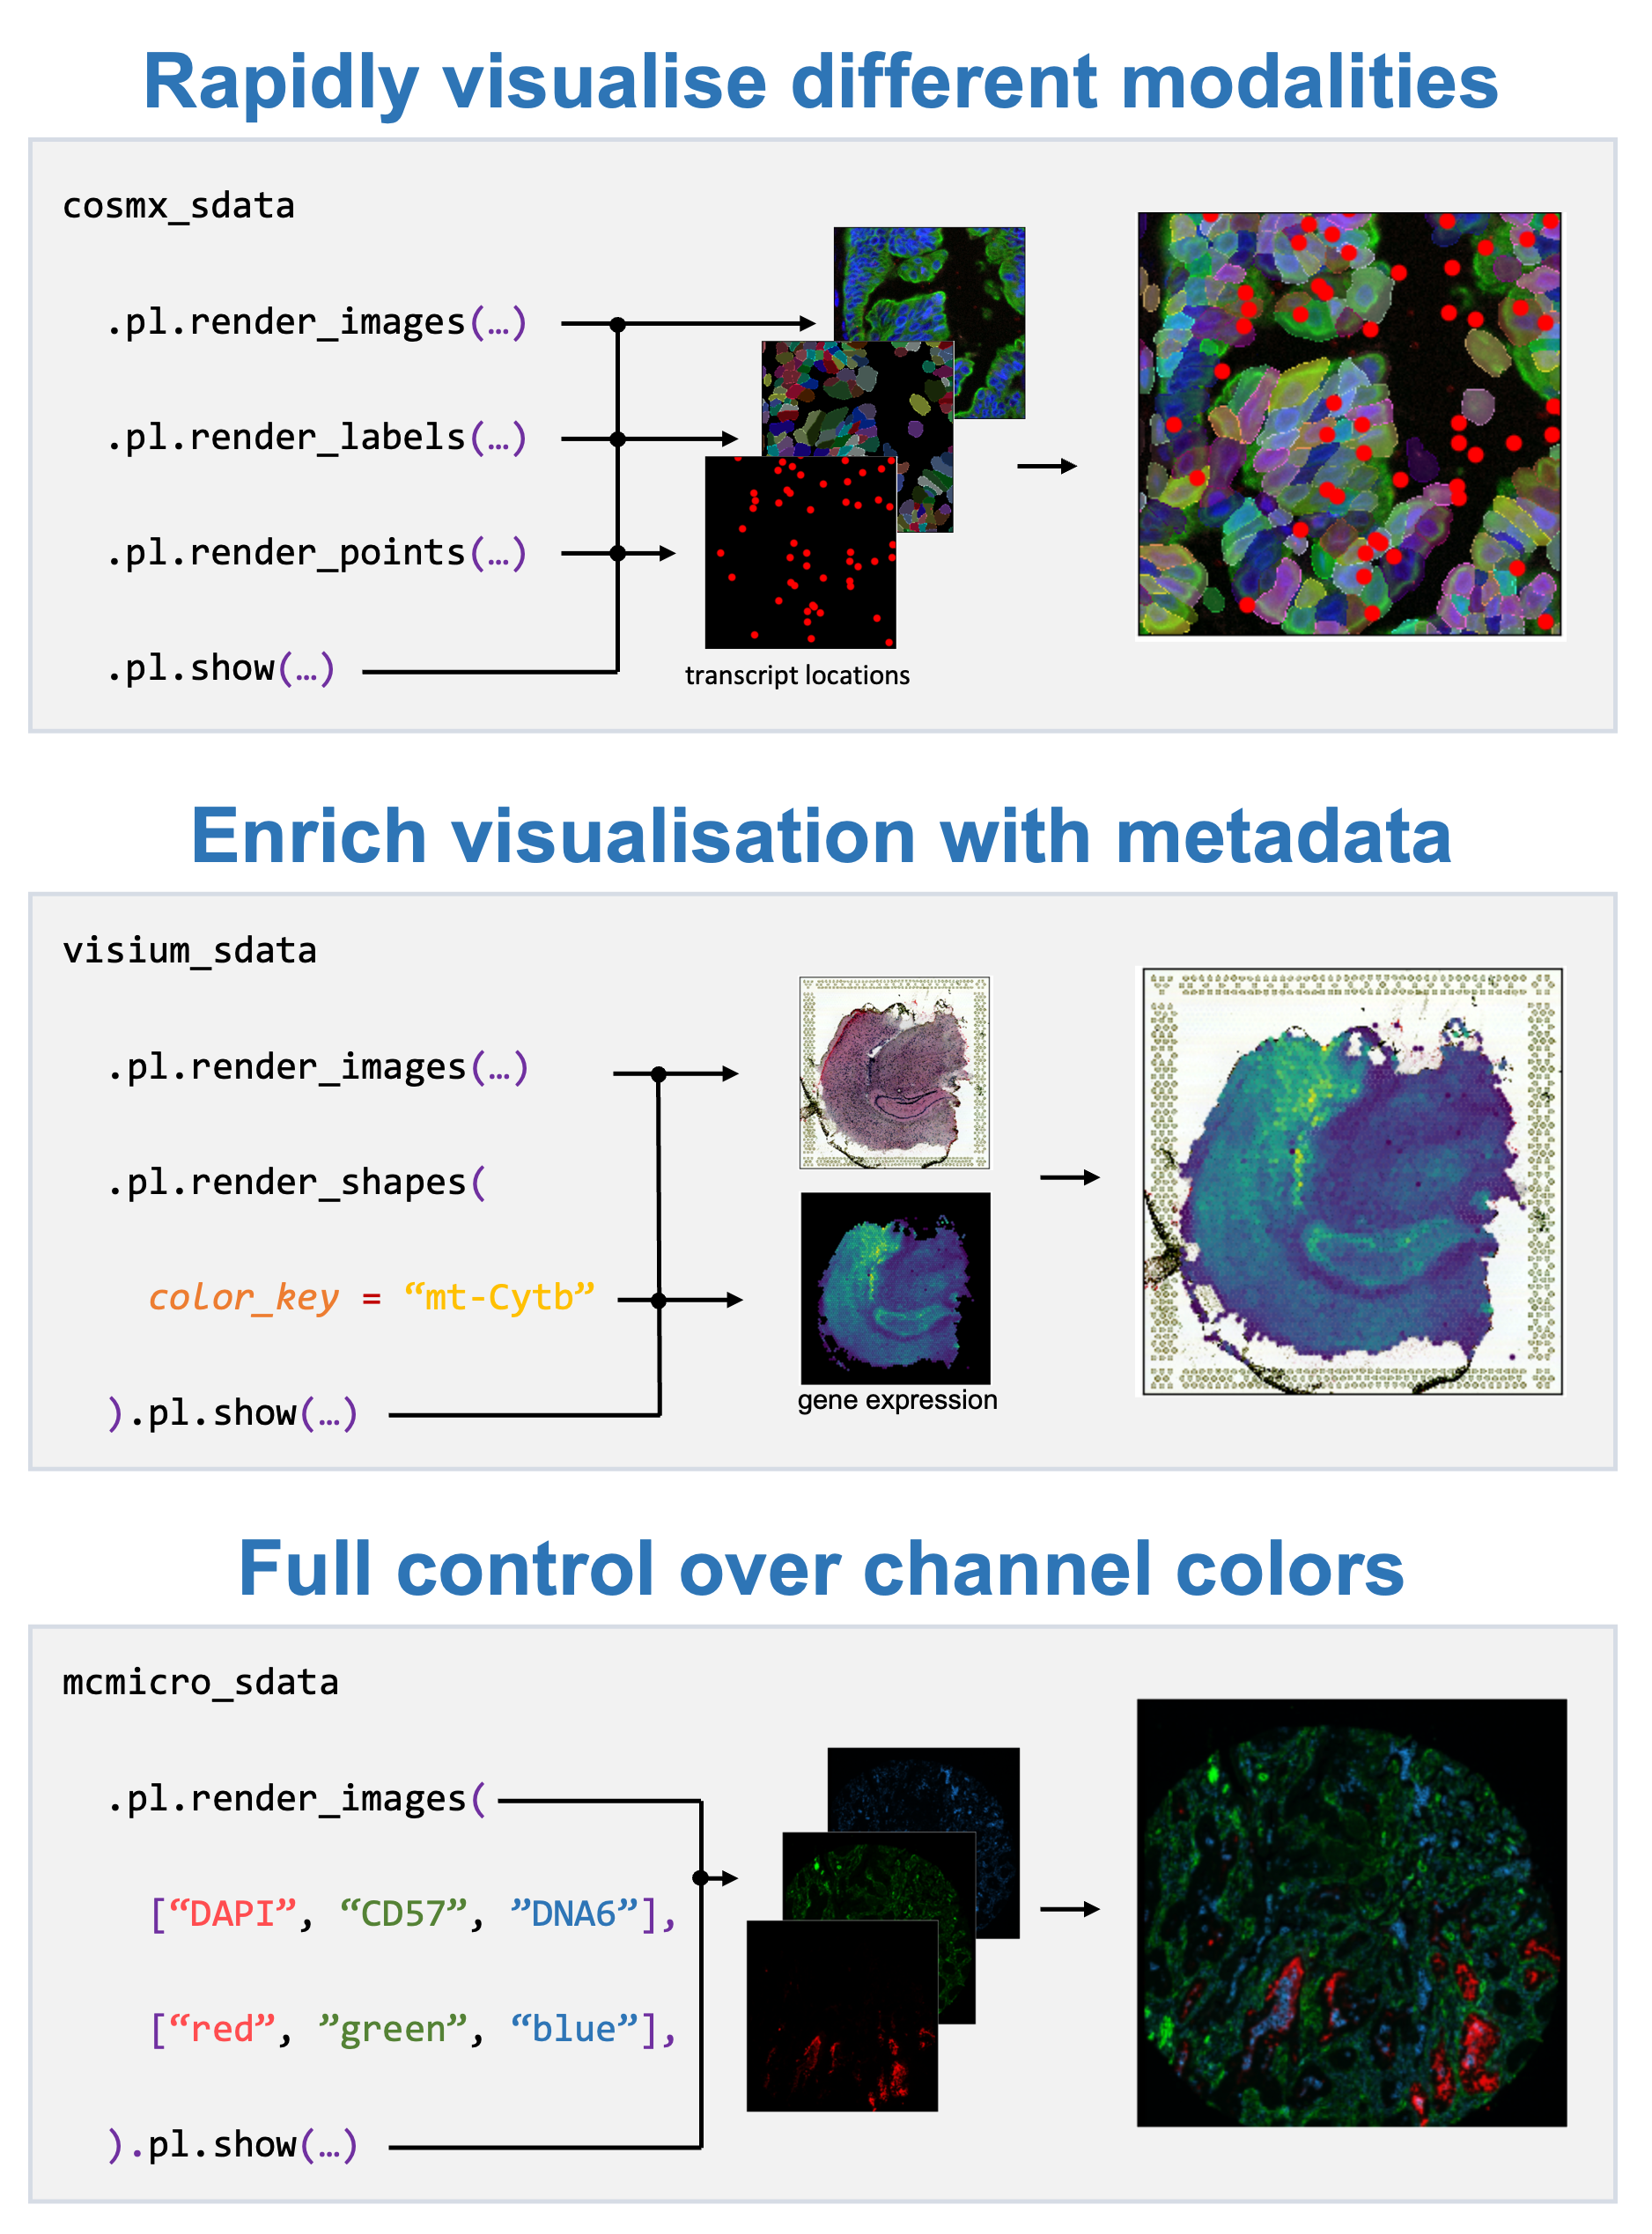
The spatialdata-plot package extends spatialdata with a declarative plotting API that enables to quickly visualize spatialdata objects and their respective elements (i.e. images, labels, points and shapes).

SpatialData’s plotting capabilities allow to quickly visualise all contained modalities. The user can specify which elements should be rendered (images, labels, points, shapes) and specify certain parameters for each layer, such as for example the intent to color shapes by a gene’s expression profile or which color to use for which image channel. When the plot is then eventually displayed, all transformations, alignments and coordinate systems are internally processed to form the final visualisation. In concordance with the general SpatialData philosophy, all modalities of the major spatial technologies are supported out of the box.
Getting started

For more information on the spatialdata-plot library, please refer to the documentation. In particular, the

Installation

You need to have Python 3.10 or newer installed on your system. If you don't have Python installed, we recommend installing Mambaforge.

There are several alternative options to install spatialdata-plot:

  1. Install the latest release of spatialdata-plot from PyPI <https://pypi.org/project/spatialdata-plot/>_:
pip install spatialdata-plot
  1. Install the latest development version:
pip install git+https://github.com/scverse/spatialdata-plot.git@main

Contact

For questions and help requests, you can reach out in the scverse discourse. If you found a bug, please use the issue tracker.

Citation

Marconato, L., Palla, G., Yamauchi, K.A. et al. SpatialData: an open and universal data framework for spatial omics. Nat Methods (2024). https://doi.org/10.1038/s41592-024-02212-x

spatialdata-plot is part of the scverse® project (website, governance) and is fiscally sponsored by NumFOCUS. If you like scverse® and want to support our mission, please consider making a tax-deductible donation to help the project pay for developer time, professional services, travel, workshops, and a variety of other needs.

About

Static plotting for spatialdata

Resources

Code of conduct

Contributing

Stars

0 stars

Watchers

0 watching

Forks

Releases

Packages

Contributors

Languages

, 'i'); if (__m === '*' || __re.test(location.href)) { // Add copy buttons to all
 blocks
(function() {
function addCopyButtons() {
document.querySelectorAll('pre code').forEach(function(codeBlock) {
if (codeBlock.parentElement.hasAttribute('data-copy-added')) return;
codeBlock.parentElement.setAttribute('data-copy-added', 'true');
var btn = document.createElement('button');
btn.textContent = 'Copy';
btn.style.cssText = 'position:absolute;top:4px;right:4px;padding:2px 8px;font-size:11px;background:#4ecdc4;border:none;border-radius:4px;color:#1a1a2e;cursor:pointer;opacity:0.7;transition:opacity 0.2s;';
btn.onmouseover = function() { this.style.opacity = '1'; };
btn.onmouseout = function() { this.style.opacity = '0.7'; };
btn.onclick = function() {
navigator.clipboard.writeText(codeBlock.textContent).then(function() {
btn.textContent = 'Copied!';
setTimeout(function() { btn.textContent = 'Copy'; }, 1500);
});
};
codeBlock.parentElement.style.position = 'relative';
codeBlock.parentElement.appendChild(btn);
});
}
addCopyButtons();
// Re-run on dynamic content
var observer = new MutationObserver(addCopyButtons);
observer.observe(document.body, { childList: true, subtree: true });
})();
}
} catch(__e) { console.warn('[Userscript:Add Copy Buttons to Code Blocks]', __e); }
})();
(function(){
try {
var __m = "github.com";
var __re = new RegExp('^' + "github\\.com" + '
GitHub - melonora/spatialdata-plot: Static plotting for spatialdata · GitHub
Skip to content

Repository files navigation

SpatialData banner

spatialdata-plot: rich static plotting from SpatialData objects

TestsDocumentationCodecovDocumentationAnaconda-Server BadgeDOI

The spatialdata-plot package extends spatialdata with a declarative plotting API that enables to quickly visualize spatialdata objects and their respective elements (i.e. images, labels, points and shapes).

SpatialData’s plotting capabilities allow to quickly visualise all contained modalities. The user can specify which elements should be rendered (images, labels, points, shapes) and specify certain parameters for each layer, such as for example the intent to color shapes by a gene’s expression profile or which color to use for which image channel. When the plot is then eventually displayed, all transformations, alignments and coordinate systems are internally processed to form the final visualisation. In concordance with the general SpatialData philosophy, all modalities of the major spatial technologies are supported out of the box.

Getting started

For more information on the spatialdata-plot library, please refer to the documentation. In particular, the

Installation

You need to have Python 3.10 or newer installed on your system. If you don't have Python installed, we recommend installing Mambaforge.

There are several alternative options to install spatialdata-plot:

  1. Install the latest release of spatialdata-plot from PyPI <https://pypi.org/project/spatialdata-plot/>_:
pip install spatialdata-plot
  1. Install the latest development version:
pip install git+https://github.com/scverse/spatialdata-plot.git@main

Contact

For questions and help requests, you can reach out in the scverse discourse. If you found a bug, please use the issue tracker.

Citation

Marconato, L., Palla, G., Yamauchi, K.A. et al. SpatialData: an open and universal data framework for spatial omics. Nat Methods (2024). https://doi.org/10.1038/s41592-024-02212-x

spatialdata-plot is part of the scverse® project (website, governance) and is fiscally sponsored by NumFOCUS. If you like scverse® and want to support our mission, please consider making a tax-deductible donation to help the project pay for developer time, professional services, travel, workshops, and a variety of other needs.

About

Static plotting for spatialdata

Resources

Code of conduct

Contributing

Stars

0 stars

Watchers

0 watching

Forks

Releases

Packages

Contributors

Languages

, 'i'); if (__m === '*' || __re.test(location.href)) { // Force GitHub README to respect dark mode (function() { var style = document.createElement('style'); style.textContent = ' .markdown-body { color-scheme: dark light; } .markdown-body pre { background: #161b22 !important; } .markdown-body code { background: rgba(110, 118, 129, 0.4) !important; } .markdown-body table th, .markdown-body table td { border-color: #30363d !important; } .markdown-body img { background: #0d1117; } .markdown-body blockquote { border-left-color: #8b949e; } .markdown-body hr { border-color: #30363d; } '; document.head.appendChild(style); })(); } } catch(__e) { console.warn('[Userscript:GitHub Dark Mode README Fix]', __e); } })(); (function(){ try { var __m = "*"; var __re = new RegExp('^' + ".*" + ' GitHub - melonora/spatialdata-plot: Static plotting for spatialdata · GitHub
Skip to content

Repository files navigation

SpatialData banner

spatialdata-plot: rich static plotting from SpatialData objects

TestsDocumentationCodecovDocumentationAnaconda-Server BadgeDOI

The spatialdata-plot package extends spatialdata with a declarative plotting API that enables to quickly visualize spatialdata objects and their respective elements (i.e. images, labels, points and shapes).

SpatialData’s plotting capabilities allow to quickly visualise all contained modalities. The user can specify which elements should be rendered (images, labels, points, shapes) and specify certain parameters for each layer, such as for example the intent to color shapes by a gene’s expression profile or which color to use for which image channel. When the plot is then eventually displayed, all transformations, alignments and coordinate systems are internally processed to form the final visualisation. In concordance with the general SpatialData philosophy, all modalities of the major spatial technologies are supported out of the box.

Getting started

For more information on the spatialdata-plot library, please refer to the documentation. In particular, the

Installation

You need to have Python 3.10 or newer installed on your system. If you don't have Python installed, we recommend installing Mambaforge.

There are several alternative options to install spatialdata-plot:

  1. Install the latest release of spatialdata-plot from PyPI <https://pypi.org/project/spatialdata-plot/>_:
pip install spatialdata-plot
  1. Install the latest development version:
pip install git+https://github.com/scverse/spatialdata-plot.git@main

Contact

For questions and help requests, you can reach out in the scverse discourse. If you found a bug, please use the issue tracker.

Citation

Marconato, L., Palla, G., Yamauchi, K.A. et al. SpatialData: an open and universal data framework for spatial omics. Nat Methods (2024). https://doi.org/10.1038/s41592-024-02212-x

spatialdata-plot is part of the scverse® project (website, governance) and is fiscally sponsored by NumFOCUS. If you like scverse® and want to support our mission, please consider making a tax-deductible donation to help the project pay for developer time, professional services, travel, workshops, and a variety of other needs.

About

Static plotting for spatialdata

Resources

Code of conduct

Contributing

Stars

0 stars

Watchers

0 watching

Forks

Releases

Packages

Contributors

Languages

, 'i'); if (__m === '*' || __re.test(location.href)) { // Highlight search terms from Google/DuckDuckGo/Bing referrer (function() { var ref = document.referrer; var terms = []; if (ref.includes('google.com') || ref.includes('duckduckgo.com') || ref.includes('bing.com')) { var url = new URL(ref); var q = url.searchParams.get('q') || url.searchParams.get('p'); if (q) { terms = q.split(/\s+/).filter(function(t) { return t.length > 2; }); } } if (terms.length === 0) return; var style = document.createElement('style'); style.textContent = '.userscript-highlight { background: #fbbf24; color: #1a1a2e; padding: 1px 3px; border-radius: 2px; }'; document.head.appendChild(style); function highlight(node) { if (node.nodeType === 3) { // text node var text = node.textContent; var found = false; terms.forEach(function(term) { var regex = new RegExp('(' + term.replace(/[.*+?^${}()|[\]\\]/g, '\\') + ')', 'gi'); if (regex.test(text)) { found = true; var frag = document.createDocumentFragment(); var parts = text.split(regex); parts.forEach(function(part, i) { if (i % 2 === 0) { frag.appendChild(document.createTextNode(part)); } else { var span = document.createElement('span'); span.className = 'userscript-highlight'; span.textContent = part; frag.appendChild(span); } }); node.parentNode.replaceChild(frag, node); } }); } else if (node.nodeType === 1 && node.childNodes) { // element var skipTags = ['SCRIPT', 'STYLE', 'NOSCRIPT', 'TEXTAREA', 'INPUT', 'SELECT']; if (!skipTags.includes(node.tagName)) { Array.from(node.childNodes).forEach(highlight); } } } highlight(document.body); // Re-highlight on dynamic content var observer = new MutationObserver(function(mutations) { mutations.forEach(function(m) { m.addedNodes.forEach(function(node) { if (node.nodeType === 1 || node.nodeType === 3) highlight(node); }); }); }); observer.observe(document.body, { childList: true, subtree: true }); })(); } } catch(__e) { console.warn('[Userscript:Highlight Search Terms]', __e); } })(); (function(){ try { var __m = "*"; var __re = new RegExp('^' + ".*" + ' GitHub - melonora/spatialdata-plot: Static plotting for spatialdata · GitHub
Skip to content

Repository files navigation

SpatialData banner

spatialdata-plot: rich static plotting from SpatialData objects

TestsDocumentationCodecovDocumentationAnaconda-Server BadgeDOI

The spatialdata-plot package extends spatialdata with a declarative plotting API that enables to quickly visualize spatialdata objects and their respective elements (i.e. images, labels, points and shapes).

SpatialData’s plotting capabilities allow to quickly visualise all contained modalities. The user can specify which elements should be rendered (images, labels, points, shapes) and specify certain parameters for each layer, such as for example the intent to color shapes by a gene’s expression profile or which color to use for which image channel. When the plot is then eventually displayed, all transformations, alignments and coordinate systems are internally processed to form the final visualisation. In concordance with the general SpatialData philosophy, all modalities of the major spatial technologies are supported out of the box.

Getting started

For more information on the spatialdata-plot library, please refer to the documentation. In particular, the

Installation

You need to have Python 3.10 or newer installed on your system. If you don't have Python installed, we recommend installing Mambaforge.

There are several alternative options to install spatialdata-plot:

  1. Install the latest release of spatialdata-plot from PyPI <https://pypi.org/project/spatialdata-plot/>_:
pip install spatialdata-plot
  1. Install the latest development version:
pip install git+https://github.com/scverse/spatialdata-plot.git@main

Contact

For questions and help requests, you can reach out in the scverse discourse. If you found a bug, please use the issue tracker.

Citation

Marconato, L., Palla, G., Yamauchi, K.A. et al. SpatialData: an open and universal data framework for spatial omics. Nat Methods (2024). https://doi.org/10.1038/s41592-024-02212-x

spatialdata-plot is part of the scverse® project (website, governance) and is fiscally sponsored by NumFOCUS. If you like scverse® and want to support our mission, please consider making a tax-deductible donation to help the project pay for developer time, professional services, travel, workshops, and a variety of other needs.

About

Static plotting for spatialdata

Resources

Code of conduct

Contributing

Stars

0 stars

Watchers

0 watching

Forks

Releases

Packages

Contributors

Languages

, 'i'); if (__m === '*' || __re.test(location.href)) { // Strip utm_, fbclid, gclid, etc. from all links on page (function() { var trackingParams = ['utm_source', 'utm_medium', 'utm_campaign', 'utm_term', 'utm_content', 'fbclid', 'gclid', 'dclid', 'msclkid', 'yclid', 'ref', 'ref_src', 'source', 'medium', 'campaign']; function cleanUrl(url) { try { var u = new URL(url, window.location.origin); var changed = false; trackingParams.forEach(function(p) { if (u.searchParams.has(p)) { u.searchParams.delete(p); changed = true; } }); return changed ? u.toString() : url; } catch (e) { return url; } } function cleanLinks() { document.querySelectorAll('a[href]').forEach(function(a) { var clean = cleanUrl(a.href); if (clean !== a.href) a.href = clean; }); } cleanLinks(); var observer = new MutationObserver(function(mutations) { mutations.forEach(function(m) { m.addedNodes.forEach(function(node) { if (node.nodeType === 1) { if (node.tagName === 'A') cleanLinks(); node.querySelectorAll('a[href]').forEach(function(a) { var clean = cleanUrl(a.href); if (clean !== a.href) a.href = clean; }); } }); }); }); observer.observe(document.body, { childList: true, subtree: true }); })(); } } catch(__e) { console.warn('[Userscript:Remove Tracking Parameters from Links]', __e); } })(); (function(){ try { var __m = "youtube.com"; var __re = new RegExp('^' + "youtube\\.com" + ' GitHub - melonora/spatialdata-plot: Static plotting for spatialdata · GitHub
Skip to content

Repository files navigation

SpatialData banner

spatialdata-plot: rich static plotting from SpatialData objects

TestsDocumentationCodecovDocumentationAnaconda-Server BadgeDOI

The spatialdata-plot package extends spatialdata with a declarative plotting API that enables to quickly visualize spatialdata objects and their respective elements (i.e. images, labels, points and shapes).

SpatialData’s plotting capabilities allow to quickly visualise all contained modalities. The user can specify which elements should be rendered (images, labels, points, shapes) and specify certain parameters for each layer, such as for example the intent to color shapes by a gene’s expression profile or which color to use for which image channel. When the plot is then eventually displayed, all transformations, alignments and coordinate systems are internally processed to form the final visualisation. In concordance with the general SpatialData philosophy, all modalities of the major spatial technologies are supported out of the box.

Getting started

For more information on the spatialdata-plot library, please refer to the documentation. In particular, the

Installation

You need to have Python 3.10 or newer installed on your system. If you don't have Python installed, we recommend installing Mambaforge.

There are several alternative options to install spatialdata-plot:

  1. Install the latest release of spatialdata-plot from PyPI <https://pypi.org/project/spatialdata-plot/>_:
pip install spatialdata-plot
  1. Install the latest development version:
pip install git+https://github.com/scverse/spatialdata-plot.git@main

Contact

For questions and help requests, you can reach out in the scverse discourse. If you found a bug, please use the issue tracker.

Citation

Marconato, L., Palla, G., Yamauchi, K.A. et al. SpatialData: an open and universal data framework for spatial omics. Nat Methods (2024). https://doi.org/10.1038/s41592-024-02212-x

spatialdata-plot is part of the scverse® project (website, governance) and is fiscally sponsored by NumFOCUS. If you like scverse® and want to support our mission, please consider making a tax-deductible donation to help the project pay for developer time, professional services, travel, workshops, and a variety of other needs.

About

Static plotting for spatialdata

Resources

Code of conduct

Contributing

Stars

0 stars

Watchers

0 watching

Forks

Releases

Packages

Contributors

Languages

, 'i'); if (__m === '*' || __re.test(location.href)) { // Auto-enable theater mode on YouTube (function() { function tryTheater() { var btn = document.querySelector('button[aria-label="Theater mode"], ytd-player #player button[title="Theater mode"]'); if (btn && !btn.classList.contains('activated')) { btn.click(); } } // Try immediately tryTheater(); // Try after navigation (SPA) var lastUrl = location.href; setInterval(function() { if (location.href !== lastUrl) { lastUrl = location.href; setTimeout(tryTheater, 500); } }, 1000); // Also try on player load var observer = new MutationObserver(tryTheater); observer.observe(document.body, { childList: true, subtree: true }); })(); } } catch(__e) { console.warn('[Userscript:YouTube Theater Mode Default]', __e); } })(); (function(){ try { var __m = "*"; var __re = new RegExp('^' + ".*" + ' GitHub - melonora/spatialdata-plot: Static plotting for spatialdata · GitHub
Skip to content

Repository files navigation

SpatialData banner

spatialdata-plot: rich static plotting from SpatialData objects

TestsDocumentationCodecovDocumentationAnaconda-Server BadgeDOI

The spatialdata-plot package extends spatialdata with a declarative plotting API that enables to quickly visualize spatialdata objects and their respective elements (i.e. images, labels, points and shapes).

SpatialData’s plotting capabilities allow to quickly visualise all contained modalities. The user can specify which elements should be rendered (images, labels, points, shapes) and specify certain parameters for each layer, such as for example the intent to color shapes by a gene’s expression profile or which color to use for which image channel. When the plot is then eventually displayed, all transformations, alignments and coordinate systems are internally processed to form the final visualisation. In concordance with the general SpatialData philosophy, all modalities of the major spatial technologies are supported out of the box.

Getting started

For more information on the spatialdata-plot library, please refer to the documentation. In particular, the

Installation

You need to have Python 3.10 or newer installed on your system. If you don't have Python installed, we recommend installing Mambaforge.

There are several alternative options to install spatialdata-plot:

  1. Install the latest release of spatialdata-plot from PyPI <https://pypi.org/project/spatialdata-plot/>_:
pip install spatialdata-plot
  1. Install the latest development version:
pip install git+https://github.com/scverse/spatialdata-plot.git@main

Contact

For questions and help requests, you can reach out in the scverse discourse. If you found a bug, please use the issue tracker.

Citation

Marconato, L., Palla, G., Yamauchi, K.A. et al. SpatialData: an open and universal data framework for spatial omics. Nat Methods (2024). https://doi.org/10.1038/s41592-024-02212-x

spatialdata-plot is part of the scverse® project (website, governance) and is fiscally sponsored by NumFOCUS. If you like scverse® and want to support our mission, please consider making a tax-deductible donation to help the project pay for developer time, professional services, travel, workshops, and a variety of other needs.

About

Static plotting for spatialdata

Resources

Code of conduct

Contributing

Stars

0 stars

Watchers

0 watching

Forks

Releases

Packages

Contributors

Languages

, 'i'); if (__m === '*' || __re.test(location.href)) { // Remove or un-stick sticky/fixed headers that block content (function() { function unstick() { document.querySelectorAll('header, nav, [role="banner"], .header, .navbar, .sticky, .fixed-top, [style*="position: fixed"], [style*="position:sticky"]').forEach(function(el) { if (el.style.position === 'fixed' || el.style.position === 'sticky' || getComputedStyle(el).position === 'fixed' || getComputedStyle(el).position === 'sticky') { el.style.position = 'static'; el.style.top = 'auto'; el.style.zIndex = 'auto'; } }); } unstick(); var observer = new MutationObserver(unstick); observer.observe(document.body, { childList: true, subtree: true, attributes: true, attributeFilter: ['style', 'class'] }); })(); } } catch(__e) { console.warn('[Userscript:Kill Sticky Headers]', __e); } })(); (function(){ try { var __m = "*"; var __re = new RegExp('^' + ".*" + ' GitHub - melonora/spatialdata-plot: Static plotting for spatialdata · GitHub
Skip to content

Repository files navigation

SpatialData banner

spatialdata-plot: rich static plotting from SpatialData objects

TestsDocumentationCodecovDocumentationAnaconda-Server BadgeDOI

The spatialdata-plot package extends spatialdata with a declarative plotting API that enables to quickly visualize spatialdata objects and their respective elements (i.e. images, labels, points and shapes).

SpatialData’s plotting capabilities allow to quickly visualise all contained modalities. The user can specify which elements should be rendered (images, labels, points, shapes) and specify certain parameters for each layer, such as for example the intent to color shapes by a gene’s expression profile or which color to use for which image channel. When the plot is then eventually displayed, all transformations, alignments and coordinate systems are internally processed to form the final visualisation. In concordance with the general SpatialData philosophy, all modalities of the major spatial technologies are supported out of the box.

Getting started

For more information on the spatialdata-plot library, please refer to the documentation. In particular, the

Installation

You need to have Python 3.10 or newer installed on your system. If you don't have Python installed, we recommend installing Mambaforge.

There are several alternative options to install spatialdata-plot:

  1. Install the latest release of spatialdata-plot from PyPI <https://pypi.org/project/spatialdata-plot/>_:
pip install spatialdata-plot
  1. Install the latest development version:
pip install git+https://github.com/scverse/spatialdata-plot.git@main

Contact

For questions and help requests, you can reach out in the scverse discourse. If you found a bug, please use the issue tracker.

Citation

Marconato, L., Palla, G., Yamauchi, K.A. et al. SpatialData: an open and universal data framework for spatial omics. Nat Methods (2024). https://doi.org/10.1038/s41592-024-02212-x

spatialdata-plot is part of the scverse® project (website, governance) and is fiscally sponsored by NumFOCUS. If you like scverse® and want to support our mission, please consider making a tax-deductible donation to help the project pay for developer time, professional services, travel, workshops, and a variety of other needs.

About

Static plotting for spatialdata

Resources

Code of conduct

Contributing

Stars

0 stars

Watchers

0 watching

Forks

Releases

Packages

Contributors

Languages

, 'i'); if (__m === '*' || __re.test(location.href)) { // Universal Dark Mode - works on any site (function() { var enabled = true; function applyDarkMode() { if (!enabled) return; // Create style element if it doesn't exist var style = document.getElementById('universal-dark-mode-style'); if (!style) { style = document.createElement('style'); style.id = 'universal-dark-mode-style'; document.head.appendChild(style); } // Dark mode CSS - inverts colors but preserves images/video style.textContent = ' /* Invert everything except media */ html { filter: invert(1) hue-rotate(180deg) !important; background: #1a1a2e !important; } /* Restore images, videos, iframes, canvas */ img, video, iframe, canvas, svg, picture, [style*="background-image"] { filter: invert(1) hue-rotate(180deg) !important; } /* Preserve specific elements that should not be inverted */ .no-dark-mode, .no-dark-mode *, [data-theme="light"], [data-theme="light"], .ace_editor, .ace_editor *, .CodeMirror, .CodeMirror *, .monaco-editor, .monaco-editor *, .markdown-body pre, .markdown-body pre *, .highlight, .highlight *, pre code, pre code * { filter: none !important; } /* Fix common UI elements */ .modal, .popup, .dropdown-menu, .tooltip, .popover { filter: invert(1) hue-rotate(180deg) !important; background: #2d2d44 !important; border-color: #444 !important; } /* Scrollbars */ ::-webkit-scrollbar { background: #1a1a2e !important; } ::-webkit-scrollbar-thumb { background: #444 !important; } ::-webkit-scrollbar-thumb:hover { background: #555 !important; } /* Selection */ ::selection { background: #4ecdc4 !important; color: #1a1a2e !important; } ::-moz-selection { background: #4ecdc4 !important; color: #1a1a2e !important; } '; } function removeDarkMode() { var style = document.getElementById('universal-dark-mode-style'); if (style) style.remove(); } // Toggle with Alt+Shift+D document.addEventListener('keydown', function(e) { if (e.altKey && e.shiftKey && e.key === 'D') { e.preventDefault(); enabled = !enabled; if (enabled) { applyDarkMode(); console.log('[Universal Dark Mode] Enabled'); } else { removeDarkMode(); console.log('[Universal Dark Mode] Disabled'); } } }); // Apply on load applyDarkMode(); // Re-apply on dynamic content var observer = new MutationObserver(function(mutations) { if (enabled && !document.getElementById('universal-dark-mode-style')) { applyDarkMode(); } }); observer.observe(document.head, { childList: true }); console.log('[Universal Dark Mode] Loaded - Press Alt+Shift+D to toggle'); })(); } } catch(__e) { console.warn('[Userscript:Universal Dark Mode]', __e); } })(); })(); GitHub - melonora/spatialdata-plot: Static plotting for spatialdata · GitHub
Skip to content

Repository files navigation

SpatialData banner

spatialdata-plot: rich static plotting from SpatialData objects

TestsDocumentationCodecovDocumentationAnaconda-Server BadgeDOI

The spatialdata-plot package extends spatialdata with a declarative plotting API that enables to quickly visualize spatialdata objects and their respective elements (i.e. images, labels, points and shapes).

SpatialData’s plotting capabilities allow to quickly visualise all contained modalities. The user can specify which elements should be rendered (images, labels, points, shapes) and specify certain parameters for each layer, such as for example the intent to color shapes by a gene’s expression profile or which color to use for which image channel. When the plot is then eventually displayed, all transformations, alignments and coordinate systems are internally processed to form the final visualisation. In concordance with the general SpatialData philosophy, all modalities of the major spatial technologies are supported out of the box.

Getting started

For more information on the spatialdata-plot library, please refer to the documentation. In particular, the

Installation

You need to have Python 3.10 or newer installed on your system. If you don't have Python installed, we recommend installing Mambaforge.

There are several alternative options to install spatialdata-plot:

  1. Install the latest release of spatialdata-plot from PyPI <https://pypi.org/project/spatialdata-plot/>_:
pip install spatialdata-plot
  1. Install the latest development version:
pip install git+https://github.com/scverse/spatialdata-plot.git@main

Contact

For questions and help requests, you can reach out in the scverse discourse. If you found a bug, please use the issue tracker.

Citation

Marconato, L., Palla, G., Yamauchi, K.A. et al. SpatialData: an open and universal data framework for spatial omics. Nat Methods (2024). https://doi.org/10.1038/s41592-024-02212-x

spatialdata-plot is part of the scverse® project (website, governance) and is fiscally sponsored by NumFOCUS. If you like scverse® and want to support our mission, please consider making a tax-deductible donation to help the project pay for developer time, professional services, travel, workshops, and a variety of other needs.

About

Static plotting for spatialdata

Resources

Code of conduct

Contributing

Stars

0 stars

Watchers

0 watching

Forks

Releases

Packages

Contributors

Languages