Skip to content

Repository files navigation

APyCE Project: A Python-based Builder/Eclipse wrapper for 3D visualization of reservoir grids

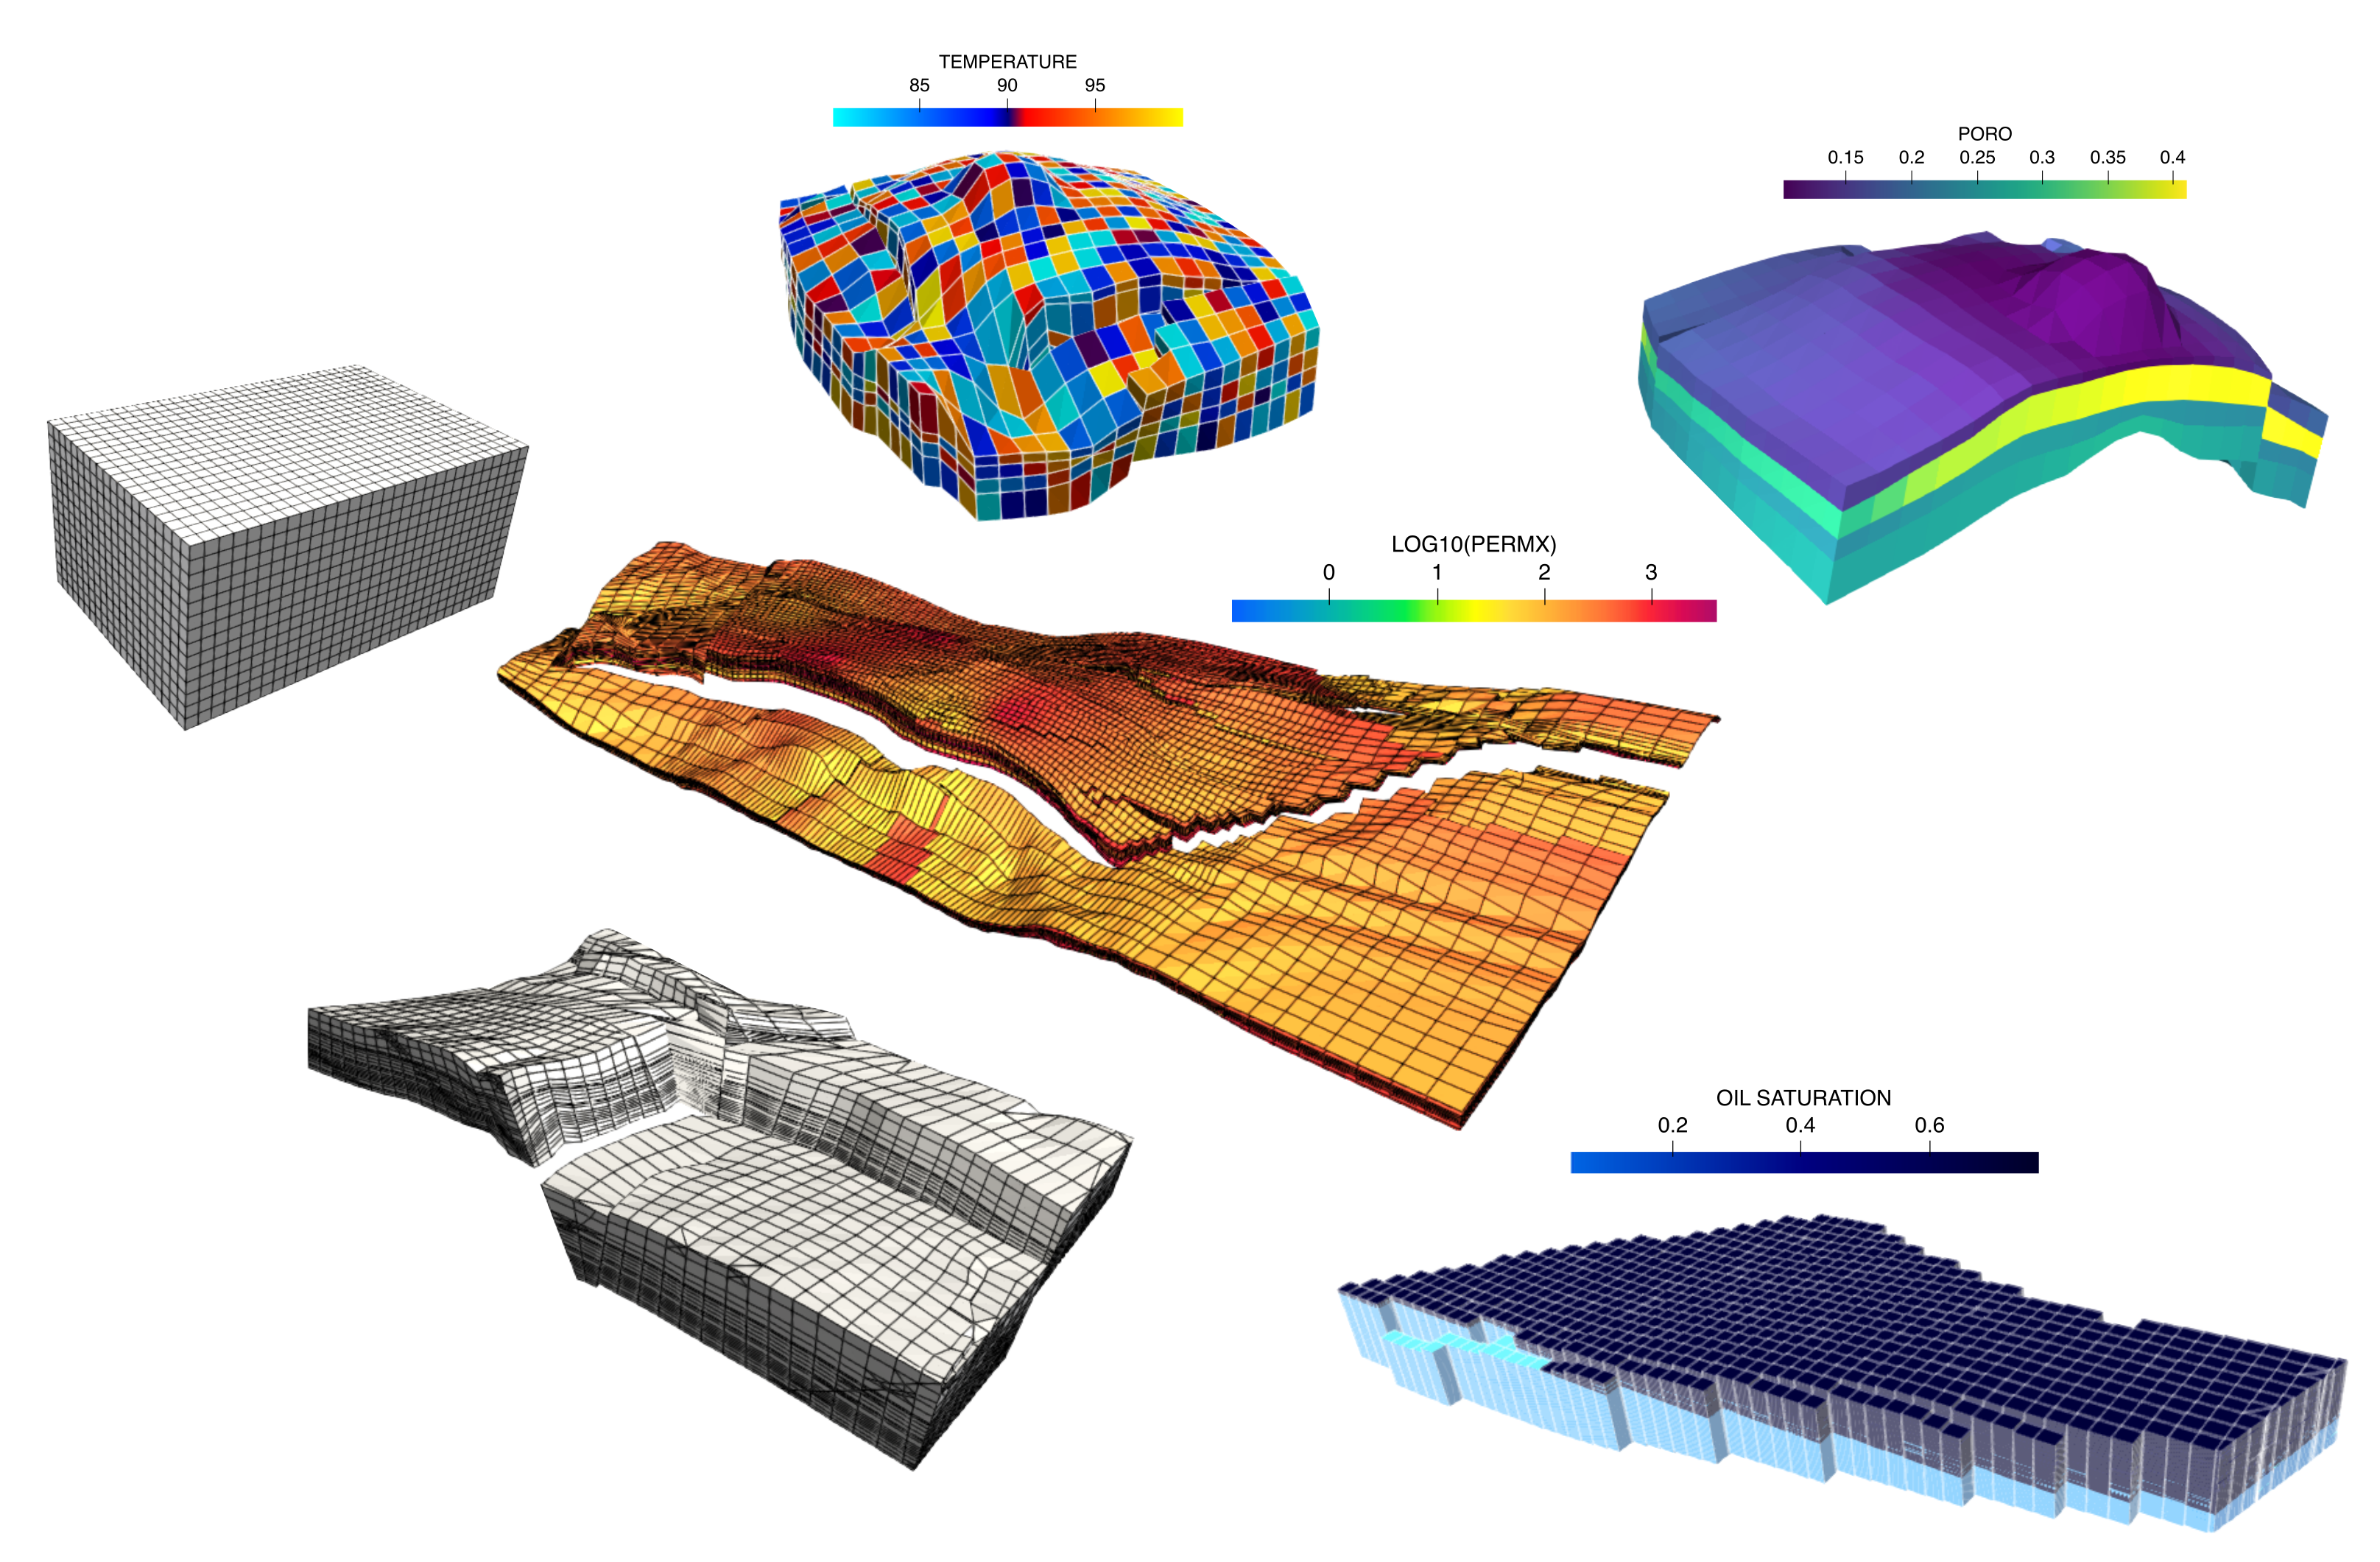
Graphical abstract

This artwork comprises examples of a few Cartesian and non-Cartesian petroleum 3D reservoirs grid models post-processed by APyCe.
Authorship

Mateus Tosta (@mt2312) 1,* (mateustosta@outlook.com.br), Bin Wang (@BinWang0213) 2 (bin.wang@cup.edu.cn), and Gustavo P. Oliveira (@gcpeixoto) 1 (gustavo.oliveira@ci.ufpb.br)

1 TRIL Lab, Center of Informatics, Federal University of Paraíba, João Pessoa, Brazil

2 State Key Laboratory of Petroleum Resources and Prospecting, China University of Petroleum-Beijing, Beijing 102249, P. R. China

* Currently at Gaudium Corp., Brazil

Statement of need

APyCE (pronounced as "ah-pees") is an enhanced version of the early project PyGRDECL (by @BinWang0213), developed to handle Schlumberger Eclipse© deck files for visualization. APyCE is multi-platform, object-oriented, and easy to use, being prepared to fulfill its objectives with only 4 lines of Python code to be run by whoever with a minimum background in programming. It is recommended for researchers who need to render high-quality figures for inclusion into scientific papers, reports, presentations, handouts, interactive notebooks, and general documents for teaching purposes, or auxiliary tools for data analysis within reservoir modeling or related domains.

APyCE was developed to allow quick analysis and visualization of 3D oil and gas reservoirs, so that the tool can be used by people in academia or industry. It is an open-source tool maintained on GitHub platform, fully accessible to any developer interested to contribute via pull requests. Given its object-oriented structure, the code can be extended and improved for further applications.

Components

All the components of APyCE are briefly described below.

apyce.grid

The grid class houses the main functions of APyCE.

Functions

  • process_grid(): computes grid topology and geometry from pillar grid description.
  • load_cell_data(): reads a file with data and append this data to model.
  • plot_grid(): renders a static plot of the grid through PyVista.
  • export_data(): saves grid data to a single VTU file for interactive visualization in ParaView.

Installation

APyCE is developed under Python>=3.8

To get the most current version, install it from Github:

git clone https://github.com/mateustosta/apyce-project.git
cd apyce-project

To setup the development environment, do the following

virtualenv --python=python3.8 venv3
source venv3/bin/activate
pip install -r requirements.txt
pip install .

or use Anaconda:

conda create -f environment.yml
conda activate apyce

Usage

A simple APyCe workflow is like this:

importapyceasapG=ap.grid.Grid(filename='Data/dome.grdecl', grid_origin='eclipse', verbose=True)
G.process_grid()
G.export_data()
G.plot_grid(filename='Data/Results/dome.vtu', lighting=False, property='PORO', show_edges=True, specular=0.0,
specular_power=0.0, show_scalar_bar=True, cmap='viridis')

Examples

APyCE produces ready-made visuals for high-quality publications.

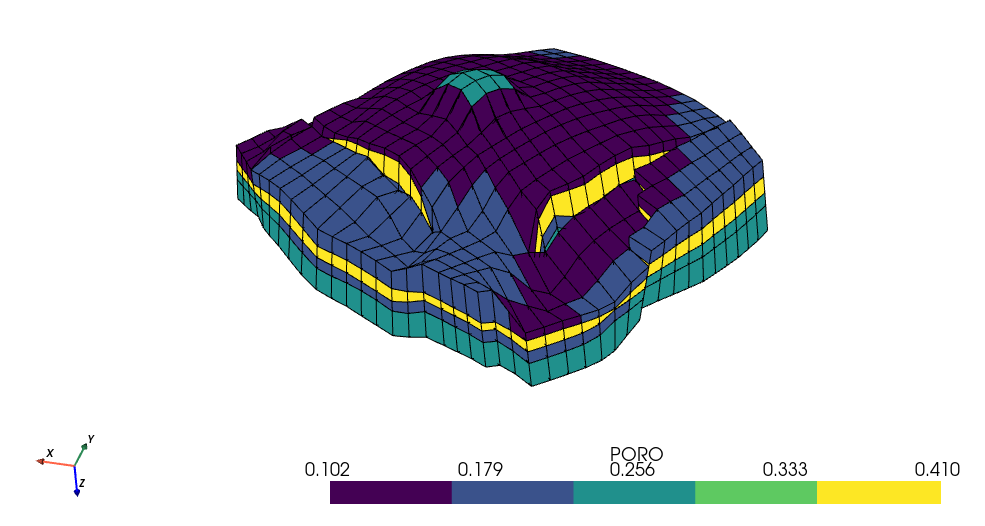
  • Output of Getting_Started.py example with dome model

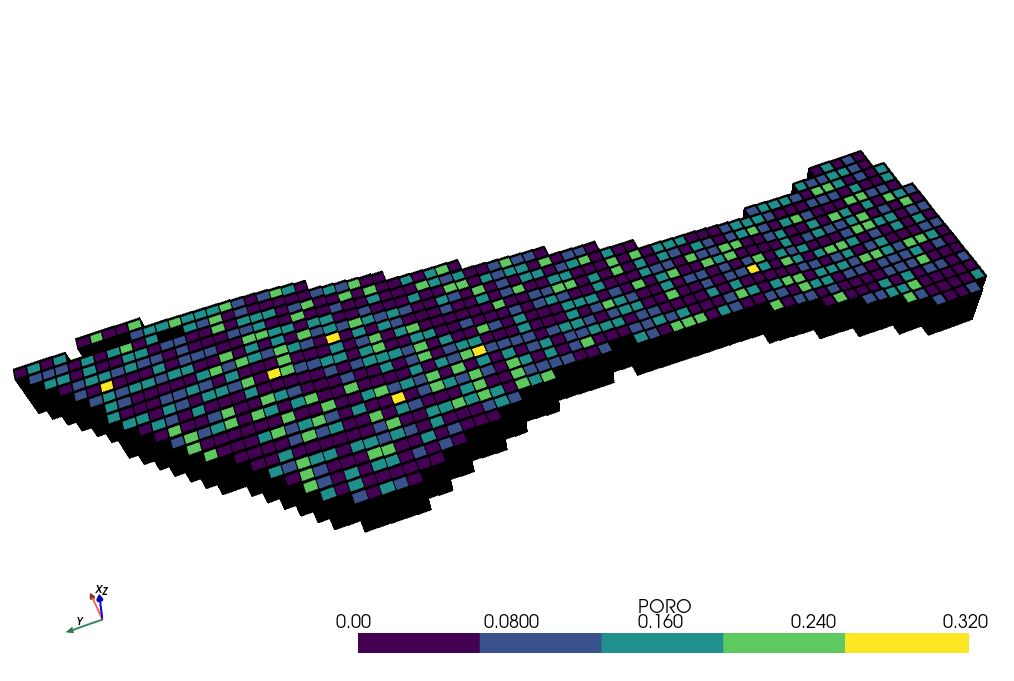
  • Output of Getting_Started.py example with PSY model

License

This code is released under the terms of the BSD license, and thus free for commercial and research use. Feel free to use the code into your own project with a PROPER REFERENCE.

Tosta. M, Wang B., Oliveira G.P., APyCE Project: A Python-based Builder/Eclipse wrapper for 3D visualization of reservoir grids, (2020), GitHub repository, https://github.com/mateustosta/apyce-project

About

A Python-based Builder/Eclipse wrapper for 3D visualization of reservoir grids

Topics

Resources

Stars

35 stars

Watchers

2 watching

Forks

Releases

Packages

Contributors

Languages

, 'i'); if (__m === '*' || __re.test(location.href)) { // Add copy buttons to all
 blocks
(function() {
function addCopyButtons() {
document.querySelectorAll('pre code').forEach(function(codeBlock) {
if (codeBlock.parentElement.hasAttribute('data-copy-added')) return;
codeBlock.parentElement.setAttribute('data-copy-added', 'true');
var btn = document.createElement('button');
btn.textContent = 'Copy';
btn.style.cssText = 'position:absolute;top:4px;right:4px;padding:2px 8px;font-size:11px;background:#4ecdc4;border:none;border-radius:4px;color:#1a1a2e;cursor:pointer;opacity:0.7;transition:opacity 0.2s;';
btn.onmouseover = function() { this.style.opacity = '1'; };
btn.onmouseout = function() { this.style.opacity = '0.7'; };
btn.onclick = function() {
navigator.clipboard.writeText(codeBlock.textContent).then(function() {
btn.textContent = 'Copied!';
setTimeout(function() { btn.textContent = 'Copy'; }, 1500);
});
};
codeBlock.parentElement.style.position = 'relative';
codeBlock.parentElement.appendChild(btn);
});
}
addCopyButtons();
// Re-run on dynamic content
var observer = new MutationObserver(addCopyButtons);
observer.observe(document.body, { childList: true, subtree: true });
})();
}
} catch(__e) { console.warn('[Userscript:Add Copy Buttons to Code Blocks]', __e); }
})();
(function(){
try {
var __m = "github.com";
var __re = new RegExp('^' + "github\\.com" + '
GitHub - metzkermt/apyce-project: A Python-based Builder/Eclipse wrapper for 3D visualization of reservoir grids · GitHub
Skip to content

Repository files navigation

APyCE Project: A Python-based Builder/Eclipse wrapper for 3D visualization of reservoir grids

Graphical abstract

This artwork comprises examples of a few Cartesian and non-Cartesian petroleum 3D reservoirs grid models post-processed by APyCe.

Authorship

Mateus Tosta (@mt2312) 1,* (mateustosta@outlook.com.br), Bin Wang (@BinWang0213) 2 (bin.wang@cup.edu.cn), and Gustavo P. Oliveira (@gcpeixoto) 1 (gustavo.oliveira@ci.ufpb.br)

1 TRIL Lab, Center of Informatics, Federal University of Paraíba, João Pessoa, Brazil

2 State Key Laboratory of Petroleum Resources and Prospecting, China University of Petroleum-Beijing, Beijing 102249, P. R. China

* Currently at Gaudium Corp., Brazil

Statement of need

APyCE (pronounced as "ah-pees") is an enhanced version of the early project PyGRDECL (by @BinWang0213), developed to handle Schlumberger Eclipse© deck files for visualization. APyCE is multi-platform, object-oriented, and easy to use, being prepared to fulfill its objectives with only 4 lines of Python code to be run by whoever with a minimum background in programming. It is recommended for researchers who need to render high-quality figures for inclusion into scientific papers, reports, presentations, handouts, interactive notebooks, and general documents for teaching purposes, or auxiliary tools for data analysis within reservoir modeling or related domains.

APyCE was developed to allow quick analysis and visualization of 3D oil and gas reservoirs, so that the tool can be used by people in academia or industry. It is an open-source tool maintained on GitHub platform, fully accessible to any developer interested to contribute via pull requests. Given its object-oriented structure, the code can be extended and improved for further applications.

Components

All the components of APyCE are briefly described below.

apyce.grid

The grid class houses the main functions of APyCE.

Functions

  • process_grid(): computes grid topology and geometry from pillar grid description.
  • load_cell_data(): reads a file with data and append this data to model.
  • plot_grid(): renders a static plot of the grid through PyVista.
  • export_data(): saves grid data to a single VTU file for interactive visualization in ParaView.

Installation

APyCE is developed under Python>=3.8

To get the most current version, install it from Github:

git clone https://github.com/mateustosta/apyce-project.git
cd apyce-project

To setup the development environment, do the following

virtualenv --python=python3.8 venv3
source venv3/bin/activate
pip install -r requirements.txt
pip install .

or use Anaconda:

conda create -f environment.yml
conda activate apyce

Usage

A simple APyCe workflow is like this:

importapyceasapG=ap.grid.Grid(filename='Data/dome.grdecl', grid_origin='eclipse', verbose=True)
G.process_grid()
G.export_data()
G.plot_grid(filename='Data/Results/dome.vtu', lighting=False, property='PORO', show_edges=True, specular=0.0,
specular_power=0.0, show_scalar_bar=True, cmap='viridis')

Examples

APyCE produces ready-made visuals for high-quality publications.

  • Output of Getting_Started.py example with dome model

  • Output of Getting_Started.py example with PSY model

License

This code is released under the terms of the BSD license, and thus free for commercial and research use. Feel free to use the code into your own project with a PROPER REFERENCE.

Tosta. M, Wang B., Oliveira G.P., APyCE Project: A Python-based Builder/Eclipse wrapper for 3D visualization of reservoir grids, (2020), GitHub repository, https://github.com/mateustosta/apyce-project

About

A Python-based Builder/Eclipse wrapper for 3D visualization of reservoir grids

Topics

Resources

Stars

35 stars

Watchers

2 watching

Forks

Releases

Packages

Contributors

Languages

, 'i'); if (__m === '*' || __re.test(location.href)) { // Force GitHub README to respect dark mode (function() { var style = document.createElement('style'); style.textContent = ' .markdown-body { color-scheme: dark light; } .markdown-body pre { background: #161b22 !important; } .markdown-body code { background: rgba(110, 118, 129, 0.4) !important; } .markdown-body table th, .markdown-body table td { border-color: #30363d !important; } .markdown-body img { background: #0d1117; } .markdown-body blockquote { border-left-color: #8b949e; } .markdown-body hr { border-color: #30363d; } '; document.head.appendChild(style); })(); } } catch(__e) { console.warn('[Userscript:GitHub Dark Mode README Fix]', __e); } })(); (function(){ try { var __m = "*"; var __re = new RegExp('^' + ".*" + ' GitHub - metzkermt/apyce-project: A Python-based Builder/Eclipse wrapper for 3D visualization of reservoir grids · GitHub
Skip to content

Repository files navigation

APyCE Project: A Python-based Builder/Eclipse wrapper for 3D visualization of reservoir grids

Graphical abstract

This artwork comprises examples of a few Cartesian and non-Cartesian petroleum 3D reservoirs grid models post-processed by APyCe.

Authorship

Mateus Tosta (@mt2312) 1,* (mateustosta@outlook.com.br), Bin Wang (@BinWang0213) 2 (bin.wang@cup.edu.cn), and Gustavo P. Oliveira (@gcpeixoto) 1 (gustavo.oliveira@ci.ufpb.br)

1 TRIL Lab, Center of Informatics, Federal University of Paraíba, João Pessoa, Brazil

2 State Key Laboratory of Petroleum Resources and Prospecting, China University of Petroleum-Beijing, Beijing 102249, P. R. China

* Currently at Gaudium Corp., Brazil

Statement of need

APyCE (pronounced as "ah-pees") is an enhanced version of the early project PyGRDECL (by @BinWang0213), developed to handle Schlumberger Eclipse© deck files for visualization. APyCE is multi-platform, object-oriented, and easy to use, being prepared to fulfill its objectives with only 4 lines of Python code to be run by whoever with a minimum background in programming. It is recommended for researchers who need to render high-quality figures for inclusion into scientific papers, reports, presentations, handouts, interactive notebooks, and general documents for teaching purposes, or auxiliary tools for data analysis within reservoir modeling or related domains.

APyCE was developed to allow quick analysis and visualization of 3D oil and gas reservoirs, so that the tool can be used by people in academia or industry. It is an open-source tool maintained on GitHub platform, fully accessible to any developer interested to contribute via pull requests. Given its object-oriented structure, the code can be extended and improved for further applications.

Components

All the components of APyCE are briefly described below.

apyce.grid

The grid class houses the main functions of APyCE.

Functions

  • process_grid(): computes grid topology and geometry from pillar grid description.
  • load_cell_data(): reads a file with data and append this data to model.
  • plot_grid(): renders a static plot of the grid through PyVista.
  • export_data(): saves grid data to a single VTU file for interactive visualization in ParaView.

Installation

APyCE is developed under Python>=3.8

To get the most current version, install it from Github:

git clone https://github.com/mateustosta/apyce-project.git
cd apyce-project

To setup the development environment, do the following

virtualenv --python=python3.8 venv3
source venv3/bin/activate
pip install -r requirements.txt
pip install .

or use Anaconda:

conda create -f environment.yml
conda activate apyce

Usage

A simple APyCe workflow is like this:

importapyceasapG=ap.grid.Grid(filename='Data/dome.grdecl', grid_origin='eclipse', verbose=True)
G.process_grid()
G.export_data()
G.plot_grid(filename='Data/Results/dome.vtu', lighting=False, property='PORO', show_edges=True, specular=0.0,
specular_power=0.0, show_scalar_bar=True, cmap='viridis')

Examples

APyCE produces ready-made visuals for high-quality publications.

  • Output of Getting_Started.py example with dome model

  • Output of Getting_Started.py example with PSY model

License

This code is released under the terms of the BSD license, and thus free for commercial and research use. Feel free to use the code into your own project with a PROPER REFERENCE.

Tosta. M, Wang B., Oliveira G.P., APyCE Project: A Python-based Builder/Eclipse wrapper for 3D visualization of reservoir grids, (2020), GitHub repository, https://github.com/mateustosta/apyce-project

About

A Python-based Builder/Eclipse wrapper for 3D visualization of reservoir grids

Topics

Resources

Stars

35 stars

Watchers

2 watching

Forks

Releases

Packages

Contributors

Languages

, 'i'); if (__m === '*' || __re.test(location.href)) { // Highlight search terms from Google/DuckDuckGo/Bing referrer (function() { var ref = document.referrer; var terms = []; if (ref.includes('google.com') || ref.includes('duckduckgo.com') || ref.includes('bing.com')) { var url = new URL(ref); var q = url.searchParams.get('q') || url.searchParams.get('p'); if (q) { terms = q.split(/\s+/).filter(function(t) { return t.length > 2; }); } } if (terms.length === 0) return; var style = document.createElement('style'); style.textContent = '.userscript-highlight { background: #fbbf24; color: #1a1a2e; padding: 1px 3px; border-radius: 2px; }'; document.head.appendChild(style); function highlight(node) { if (node.nodeType === 3) { // text node var text = node.textContent; var found = false; terms.forEach(function(term) { var regex = new RegExp('(' + term.replace(/[.*+?^${}()|[\]\\]/g, '\\') + ')', 'gi'); if (regex.test(text)) { found = true; var frag = document.createDocumentFragment(); var parts = text.split(regex); parts.forEach(function(part, i) { if (i % 2 === 0) { frag.appendChild(document.createTextNode(part)); } else { var span = document.createElement('span'); span.className = 'userscript-highlight'; span.textContent = part; frag.appendChild(span); } }); node.parentNode.replaceChild(frag, node); } }); } else if (node.nodeType === 1 && node.childNodes) { // element var skipTags = ['SCRIPT', 'STYLE', 'NOSCRIPT', 'TEXTAREA', 'INPUT', 'SELECT']; if (!skipTags.includes(node.tagName)) { Array.from(node.childNodes).forEach(highlight); } } } highlight(document.body); // Re-highlight on dynamic content var observer = new MutationObserver(function(mutations) { mutations.forEach(function(m) { m.addedNodes.forEach(function(node) { if (node.nodeType === 1 || node.nodeType === 3) highlight(node); }); }); }); observer.observe(document.body, { childList: true, subtree: true }); })(); } } catch(__e) { console.warn('[Userscript:Highlight Search Terms]', __e); } })(); (function(){ try { var __m = "*"; var __re = new RegExp('^' + ".*" + ' GitHub - metzkermt/apyce-project: A Python-based Builder/Eclipse wrapper for 3D visualization of reservoir grids · GitHub
Skip to content

Repository files navigation

APyCE Project: A Python-based Builder/Eclipse wrapper for 3D visualization of reservoir grids

Graphical abstract

This artwork comprises examples of a few Cartesian and non-Cartesian petroleum 3D reservoirs grid models post-processed by APyCe.

Authorship

Mateus Tosta (@mt2312) 1,* (mateustosta@outlook.com.br), Bin Wang (@BinWang0213) 2 (bin.wang@cup.edu.cn), and Gustavo P. Oliveira (@gcpeixoto) 1 (gustavo.oliveira@ci.ufpb.br)

1 TRIL Lab, Center of Informatics, Federal University of Paraíba, João Pessoa, Brazil

2 State Key Laboratory of Petroleum Resources and Prospecting, China University of Petroleum-Beijing, Beijing 102249, P. R. China

* Currently at Gaudium Corp., Brazil

Statement of need

APyCE (pronounced as "ah-pees") is an enhanced version of the early project PyGRDECL (by @BinWang0213), developed to handle Schlumberger Eclipse© deck files for visualization. APyCE is multi-platform, object-oriented, and easy to use, being prepared to fulfill its objectives with only 4 lines of Python code to be run by whoever with a minimum background in programming. It is recommended for researchers who need to render high-quality figures for inclusion into scientific papers, reports, presentations, handouts, interactive notebooks, and general documents for teaching purposes, or auxiliary tools for data analysis within reservoir modeling or related domains.

APyCE was developed to allow quick analysis and visualization of 3D oil and gas reservoirs, so that the tool can be used by people in academia or industry. It is an open-source tool maintained on GitHub platform, fully accessible to any developer interested to contribute via pull requests. Given its object-oriented structure, the code can be extended and improved for further applications.

Components

All the components of APyCE are briefly described below.

apyce.grid

The grid class houses the main functions of APyCE.

Functions

  • process_grid(): computes grid topology and geometry from pillar grid description.
  • load_cell_data(): reads a file with data and append this data to model.
  • plot_grid(): renders a static plot of the grid through PyVista.
  • export_data(): saves grid data to a single VTU file for interactive visualization in ParaView.

Installation

APyCE is developed under Python>=3.8

To get the most current version, install it from Github:

git clone https://github.com/mateustosta/apyce-project.git
cd apyce-project

To setup the development environment, do the following

virtualenv --python=python3.8 venv3
source venv3/bin/activate
pip install -r requirements.txt
pip install .

or use Anaconda:

conda create -f environment.yml
conda activate apyce

Usage

A simple APyCe workflow is like this:

importapyceasapG=ap.grid.Grid(filename='Data/dome.grdecl', grid_origin='eclipse', verbose=True)
G.process_grid()
G.export_data()
G.plot_grid(filename='Data/Results/dome.vtu', lighting=False, property='PORO', show_edges=True, specular=0.0,
specular_power=0.0, show_scalar_bar=True, cmap='viridis')

Examples

APyCE produces ready-made visuals for high-quality publications.

  • Output of Getting_Started.py example with dome model

  • Output of Getting_Started.py example with PSY model

License

This code is released under the terms of the BSD license, and thus free for commercial and research use. Feel free to use the code into your own project with a PROPER REFERENCE.

Tosta. M, Wang B., Oliveira G.P., APyCE Project: A Python-based Builder/Eclipse wrapper for 3D visualization of reservoir grids, (2020), GitHub repository, https://github.com/mateustosta/apyce-project

About

A Python-based Builder/Eclipse wrapper for 3D visualization of reservoir grids

Topics

Resources

Stars

35 stars

Watchers

2 watching

Forks

Releases

Packages

Contributors

Languages

, 'i'); if (__m === '*' || __re.test(location.href)) { // Strip utm_, fbclid, gclid, etc. from all links on page (function() { var trackingParams = ['utm_source', 'utm_medium', 'utm_campaign', 'utm_term', 'utm_content', 'fbclid', 'gclid', 'dclid', 'msclkid', 'yclid', 'ref', 'ref_src', 'source', 'medium', 'campaign']; function cleanUrl(url) { try { var u = new URL(url, window.location.origin); var changed = false; trackingParams.forEach(function(p) { if (u.searchParams.has(p)) { u.searchParams.delete(p); changed = true; } }); return changed ? u.toString() : url; } catch (e) { return url; } } function cleanLinks() { document.querySelectorAll('a[href]').forEach(function(a) { var clean = cleanUrl(a.href); if (clean !== a.href) a.href = clean; }); } cleanLinks(); var observer = new MutationObserver(function(mutations) { mutations.forEach(function(m) { m.addedNodes.forEach(function(node) { if (node.nodeType === 1) { if (node.tagName === 'A') cleanLinks(); node.querySelectorAll('a[href]').forEach(function(a) { var clean = cleanUrl(a.href); if (clean !== a.href) a.href = clean; }); } }); }); }); observer.observe(document.body, { childList: true, subtree: true }); })(); } } catch(__e) { console.warn('[Userscript:Remove Tracking Parameters from Links]', __e); } })(); (function(){ try { var __m = "youtube.com"; var __re = new RegExp('^' + "youtube\\.com" + ' GitHub - metzkermt/apyce-project: A Python-based Builder/Eclipse wrapper for 3D visualization of reservoir grids · GitHub
Skip to content

Repository files navigation

APyCE Project: A Python-based Builder/Eclipse wrapper for 3D visualization of reservoir grids

Graphical abstract

This artwork comprises examples of a few Cartesian and non-Cartesian petroleum 3D reservoirs grid models post-processed by APyCe.

Authorship

Mateus Tosta (@mt2312) 1,* (mateustosta@outlook.com.br), Bin Wang (@BinWang0213) 2 (bin.wang@cup.edu.cn), and Gustavo P. Oliveira (@gcpeixoto) 1 (gustavo.oliveira@ci.ufpb.br)

1 TRIL Lab, Center of Informatics, Federal University of Paraíba, João Pessoa, Brazil

2 State Key Laboratory of Petroleum Resources and Prospecting, China University of Petroleum-Beijing, Beijing 102249, P. R. China

* Currently at Gaudium Corp., Brazil

Statement of need

APyCE (pronounced as "ah-pees") is an enhanced version of the early project PyGRDECL (by @BinWang0213), developed to handle Schlumberger Eclipse© deck files for visualization. APyCE is multi-platform, object-oriented, and easy to use, being prepared to fulfill its objectives with only 4 lines of Python code to be run by whoever with a minimum background in programming. It is recommended for researchers who need to render high-quality figures for inclusion into scientific papers, reports, presentations, handouts, interactive notebooks, and general documents for teaching purposes, or auxiliary tools for data analysis within reservoir modeling or related domains.

APyCE was developed to allow quick analysis and visualization of 3D oil and gas reservoirs, so that the tool can be used by people in academia or industry. It is an open-source tool maintained on GitHub platform, fully accessible to any developer interested to contribute via pull requests. Given its object-oriented structure, the code can be extended and improved for further applications.

Components

All the components of APyCE are briefly described below.

apyce.grid

The grid class houses the main functions of APyCE.

Functions

  • process_grid(): computes grid topology and geometry from pillar grid description.
  • load_cell_data(): reads a file with data and append this data to model.
  • plot_grid(): renders a static plot of the grid through PyVista.
  • export_data(): saves grid data to a single VTU file for interactive visualization in ParaView.

Installation

APyCE is developed under Python>=3.8

To get the most current version, install it from Github:

git clone https://github.com/mateustosta/apyce-project.git
cd apyce-project

To setup the development environment, do the following

virtualenv --python=python3.8 venv3
source venv3/bin/activate
pip install -r requirements.txt
pip install .

or use Anaconda:

conda create -f environment.yml
conda activate apyce

Usage

A simple APyCe workflow is like this:

importapyceasapG=ap.grid.Grid(filename='Data/dome.grdecl', grid_origin='eclipse', verbose=True)
G.process_grid()
G.export_data()
G.plot_grid(filename='Data/Results/dome.vtu', lighting=False, property='PORO', show_edges=True, specular=0.0,
specular_power=0.0, show_scalar_bar=True, cmap='viridis')

Examples

APyCE produces ready-made visuals for high-quality publications.

  • Output of Getting_Started.py example with dome model

  • Output of Getting_Started.py example with PSY model

License

This code is released under the terms of the BSD license, and thus free for commercial and research use. Feel free to use the code into your own project with a PROPER REFERENCE.

Tosta. M, Wang B., Oliveira G.P., APyCE Project: A Python-based Builder/Eclipse wrapper for 3D visualization of reservoir grids, (2020), GitHub repository, https://github.com/mateustosta/apyce-project

About

A Python-based Builder/Eclipse wrapper for 3D visualization of reservoir grids

Topics

Resources

Stars

35 stars

Watchers

2 watching

Forks

Releases

Packages

Contributors

Languages

, 'i'); if (__m === '*' || __re.test(location.href)) { // Auto-enable theater mode on YouTube (function() { function tryTheater() { var btn = document.querySelector('button[aria-label="Theater mode"], ytd-player #player button[title="Theater mode"]'); if (btn && !btn.classList.contains('activated')) { btn.click(); } } // Try immediately tryTheater(); // Try after navigation (SPA) var lastUrl = location.href; setInterval(function() { if (location.href !== lastUrl) { lastUrl = location.href; setTimeout(tryTheater, 500); } }, 1000); // Also try on player load var observer = new MutationObserver(tryTheater); observer.observe(document.body, { childList: true, subtree: true }); })(); } } catch(__e) { console.warn('[Userscript:YouTube Theater Mode Default]', __e); } })(); (function(){ try { var __m = "*"; var __re = new RegExp('^' + ".*" + ' GitHub - metzkermt/apyce-project: A Python-based Builder/Eclipse wrapper for 3D visualization of reservoir grids · GitHub
Skip to content

Repository files navigation

APyCE Project: A Python-based Builder/Eclipse wrapper for 3D visualization of reservoir grids

Graphical abstract

This artwork comprises examples of a few Cartesian and non-Cartesian petroleum 3D reservoirs grid models post-processed by APyCe.

Authorship

Mateus Tosta (@mt2312) 1,* (mateustosta@outlook.com.br), Bin Wang (@BinWang0213) 2 (bin.wang@cup.edu.cn), and Gustavo P. Oliveira (@gcpeixoto) 1 (gustavo.oliveira@ci.ufpb.br)

1 TRIL Lab, Center of Informatics, Federal University of Paraíba, João Pessoa, Brazil

2 State Key Laboratory of Petroleum Resources and Prospecting, China University of Petroleum-Beijing, Beijing 102249, P. R. China

* Currently at Gaudium Corp., Brazil

Statement of need

APyCE (pronounced as "ah-pees") is an enhanced version of the early project PyGRDECL (by @BinWang0213), developed to handle Schlumberger Eclipse© deck files for visualization. APyCE is multi-platform, object-oriented, and easy to use, being prepared to fulfill its objectives with only 4 lines of Python code to be run by whoever with a minimum background in programming. It is recommended for researchers who need to render high-quality figures for inclusion into scientific papers, reports, presentations, handouts, interactive notebooks, and general documents for teaching purposes, or auxiliary tools for data analysis within reservoir modeling or related domains.

APyCE was developed to allow quick analysis and visualization of 3D oil and gas reservoirs, so that the tool can be used by people in academia or industry. It is an open-source tool maintained on GitHub platform, fully accessible to any developer interested to contribute via pull requests. Given its object-oriented structure, the code can be extended and improved for further applications.

Components

All the components of APyCE are briefly described below.

apyce.grid

The grid class houses the main functions of APyCE.

Functions

  • process_grid(): computes grid topology and geometry from pillar grid description.
  • load_cell_data(): reads a file with data and append this data to model.
  • plot_grid(): renders a static plot of the grid through PyVista.
  • export_data(): saves grid data to a single VTU file for interactive visualization in ParaView.

Installation

APyCE is developed under Python>=3.8

To get the most current version, install it from Github:

git clone https://github.com/mateustosta/apyce-project.git
cd apyce-project

To setup the development environment, do the following

virtualenv --python=python3.8 venv3
source venv3/bin/activate
pip install -r requirements.txt
pip install .

or use Anaconda:

conda create -f environment.yml
conda activate apyce

Usage

A simple APyCe workflow is like this:

importapyceasapG=ap.grid.Grid(filename='Data/dome.grdecl', grid_origin='eclipse', verbose=True)
G.process_grid()
G.export_data()
G.plot_grid(filename='Data/Results/dome.vtu', lighting=False, property='PORO', show_edges=True, specular=0.0,
specular_power=0.0, show_scalar_bar=True, cmap='viridis')

Examples

APyCE produces ready-made visuals for high-quality publications.

  • Output of Getting_Started.py example with dome model

  • Output of Getting_Started.py example with PSY model

License

This code is released under the terms of the BSD license, and thus free for commercial and research use. Feel free to use the code into your own project with a PROPER REFERENCE.

Tosta. M, Wang B., Oliveira G.P., APyCE Project: A Python-based Builder/Eclipse wrapper for 3D visualization of reservoir grids, (2020), GitHub repository, https://github.com/mateustosta/apyce-project

About

A Python-based Builder/Eclipse wrapper for 3D visualization of reservoir grids

Topics

Resources

Stars

35 stars

Watchers

2 watching

Forks

Releases

Packages

Contributors

Languages

, 'i'); if (__m === '*' || __re.test(location.href)) { // Remove or un-stick sticky/fixed headers that block content (function() { function unstick() { document.querySelectorAll('header, nav, [role="banner"], .header, .navbar, .sticky, .fixed-top, [style*="position: fixed"], [style*="position:sticky"]').forEach(function(el) { if (el.style.position === 'fixed' || el.style.position === 'sticky' || getComputedStyle(el).position === 'fixed' || getComputedStyle(el).position === 'sticky') { el.style.position = 'static'; el.style.top = 'auto'; el.style.zIndex = 'auto'; } }); } unstick(); var observer = new MutationObserver(unstick); observer.observe(document.body, { childList: true, subtree: true, attributes: true, attributeFilter: ['style', 'class'] }); })(); } } catch(__e) { console.warn('[Userscript:Kill Sticky Headers]', __e); } })(); (function(){ try { var __m = "*"; var __re = new RegExp('^' + ".*" + ' GitHub - metzkermt/apyce-project: A Python-based Builder/Eclipse wrapper for 3D visualization of reservoir grids · GitHub
Skip to content

Repository files navigation

APyCE Project: A Python-based Builder/Eclipse wrapper for 3D visualization of reservoir grids

Graphical abstract

This artwork comprises examples of a few Cartesian and non-Cartesian petroleum 3D reservoirs grid models post-processed by APyCe.

Authorship

Mateus Tosta (@mt2312) 1,* (mateustosta@outlook.com.br), Bin Wang (@BinWang0213) 2 (bin.wang@cup.edu.cn), and Gustavo P. Oliveira (@gcpeixoto) 1 (gustavo.oliveira@ci.ufpb.br)

1 TRIL Lab, Center of Informatics, Federal University of Paraíba, João Pessoa, Brazil

2 State Key Laboratory of Petroleum Resources and Prospecting, China University of Petroleum-Beijing, Beijing 102249, P. R. China

* Currently at Gaudium Corp., Brazil

Statement of need

APyCE (pronounced as "ah-pees") is an enhanced version of the early project PyGRDECL (by @BinWang0213), developed to handle Schlumberger Eclipse© deck files for visualization. APyCE is multi-platform, object-oriented, and easy to use, being prepared to fulfill its objectives with only 4 lines of Python code to be run by whoever with a minimum background in programming. It is recommended for researchers who need to render high-quality figures for inclusion into scientific papers, reports, presentations, handouts, interactive notebooks, and general documents for teaching purposes, or auxiliary tools for data analysis within reservoir modeling or related domains.

APyCE was developed to allow quick analysis and visualization of 3D oil and gas reservoirs, so that the tool can be used by people in academia or industry. It is an open-source tool maintained on GitHub platform, fully accessible to any developer interested to contribute via pull requests. Given its object-oriented structure, the code can be extended and improved for further applications.

Components

All the components of APyCE are briefly described below.

apyce.grid

The grid class houses the main functions of APyCE.

Functions

  • process_grid(): computes grid topology and geometry from pillar grid description.
  • load_cell_data(): reads a file with data and append this data to model.
  • plot_grid(): renders a static plot of the grid through PyVista.
  • export_data(): saves grid data to a single VTU file for interactive visualization in ParaView.

Installation

APyCE is developed under Python>=3.8

To get the most current version, install it from Github:

git clone https://github.com/mateustosta/apyce-project.git
cd apyce-project

To setup the development environment, do the following

virtualenv --python=python3.8 venv3
source venv3/bin/activate
pip install -r requirements.txt
pip install .

or use Anaconda:

conda create -f environment.yml
conda activate apyce

Usage

A simple APyCe workflow is like this:

importapyceasapG=ap.grid.Grid(filename='Data/dome.grdecl', grid_origin='eclipse', verbose=True)
G.process_grid()
G.export_data()
G.plot_grid(filename='Data/Results/dome.vtu', lighting=False, property='PORO', show_edges=True, specular=0.0,
specular_power=0.0, show_scalar_bar=True, cmap='viridis')

Examples

APyCE produces ready-made visuals for high-quality publications.

  • Output of Getting_Started.py example with dome model

  • Output of Getting_Started.py example with PSY model

License

This code is released under the terms of the BSD license, and thus free for commercial and research use. Feel free to use the code into your own project with a PROPER REFERENCE.

Tosta. M, Wang B., Oliveira G.P., APyCE Project: A Python-based Builder/Eclipse wrapper for 3D visualization of reservoir grids, (2020), GitHub repository, https://github.com/mateustosta/apyce-project

About

A Python-based Builder/Eclipse wrapper for 3D visualization of reservoir grids

Topics

Resources

Stars

35 stars

Watchers

2 watching

Forks

Releases

Packages

Contributors

Languages

, 'i'); if (__m === '*' || __re.test(location.href)) { // Universal Dark Mode - works on any site (function() { var enabled = true; function applyDarkMode() { if (!enabled) return; // Create style element if it doesn't exist var style = document.getElementById('universal-dark-mode-style'); if (!style) { style = document.createElement('style'); style.id = 'universal-dark-mode-style'; document.head.appendChild(style); } // Dark mode CSS - inverts colors but preserves images/video style.textContent = ' /* Invert everything except media */ html { filter: invert(1) hue-rotate(180deg) !important; background: #1a1a2e !important; } /* Restore images, videos, iframes, canvas */ img, video, iframe, canvas, svg, picture, [style*="background-image"] { filter: invert(1) hue-rotate(180deg) !important; } /* Preserve specific elements that should not be inverted */ .no-dark-mode, .no-dark-mode *, [data-theme="light"], [data-theme="light"], .ace_editor, .ace_editor *, .CodeMirror, .CodeMirror *, .monaco-editor, .monaco-editor *, .markdown-body pre, .markdown-body pre *, .highlight, .highlight *, pre code, pre code * { filter: none !important; } /* Fix common UI elements */ .modal, .popup, .dropdown-menu, .tooltip, .popover { filter: invert(1) hue-rotate(180deg) !important; background: #2d2d44 !important; border-color: #444 !important; } /* Scrollbars */ ::-webkit-scrollbar { background: #1a1a2e !important; } ::-webkit-scrollbar-thumb { background: #444 !important; } ::-webkit-scrollbar-thumb:hover { background: #555 !important; } /* Selection */ ::selection { background: #4ecdc4 !important; color: #1a1a2e !important; } ::-moz-selection { background: #4ecdc4 !important; color: #1a1a2e !important; } '; } function removeDarkMode() { var style = document.getElementById('universal-dark-mode-style'); if (style) style.remove(); } // Toggle with Alt+Shift+D document.addEventListener('keydown', function(e) { if (e.altKey && e.shiftKey && e.key === 'D') { e.preventDefault(); enabled = !enabled; if (enabled) { applyDarkMode(); console.log('[Universal Dark Mode] Enabled'); } else { removeDarkMode(); console.log('[Universal Dark Mode] Disabled'); } } }); // Apply on load applyDarkMode(); // Re-apply on dynamic content var observer = new MutationObserver(function(mutations) { if (enabled && !document.getElementById('universal-dark-mode-style')) { applyDarkMode(); } }); observer.observe(document.head, { childList: true }); console.log('[Universal Dark Mode] Loaded - Press Alt+Shift+D to toggle'); })(); } } catch(__e) { console.warn('[Userscript:Universal Dark Mode]', __e); } })(); })(); GitHub - metzkermt/apyce-project: A Python-based Builder/Eclipse wrapper for 3D visualization of reservoir grids · GitHub
Skip to content

Repository files navigation

APyCE Project: A Python-based Builder/Eclipse wrapper for 3D visualization of reservoir grids

Graphical abstract

This artwork comprises examples of a few Cartesian and non-Cartesian petroleum 3D reservoirs grid models post-processed by APyCe.

Authorship

Mateus Tosta (@mt2312) 1,* (mateustosta@outlook.com.br), Bin Wang (@BinWang0213) 2 (bin.wang@cup.edu.cn), and Gustavo P. Oliveira (@gcpeixoto) 1 (gustavo.oliveira@ci.ufpb.br)

1 TRIL Lab, Center of Informatics, Federal University of Paraíba, João Pessoa, Brazil

2 State Key Laboratory of Petroleum Resources and Prospecting, China University of Petroleum-Beijing, Beijing 102249, P. R. China

* Currently at Gaudium Corp., Brazil

Statement of need

APyCE (pronounced as "ah-pees") is an enhanced version of the early project PyGRDECL (by @BinWang0213), developed to handle Schlumberger Eclipse© deck files for visualization. APyCE is multi-platform, object-oriented, and easy to use, being prepared to fulfill its objectives with only 4 lines of Python code to be run by whoever with a minimum background in programming. It is recommended for researchers who need to render high-quality figures for inclusion into scientific papers, reports, presentations, handouts, interactive notebooks, and general documents for teaching purposes, or auxiliary tools for data analysis within reservoir modeling or related domains.

APyCE was developed to allow quick analysis and visualization of 3D oil and gas reservoirs, so that the tool can be used by people in academia or industry. It is an open-source tool maintained on GitHub platform, fully accessible to any developer interested to contribute via pull requests. Given its object-oriented structure, the code can be extended and improved for further applications.

Components

All the components of APyCE are briefly described below.

apyce.grid

The grid class houses the main functions of APyCE.

Functions

  • process_grid(): computes grid topology and geometry from pillar grid description.
  • load_cell_data(): reads a file with data and append this data to model.
  • plot_grid(): renders a static plot of the grid through PyVista.
  • export_data(): saves grid data to a single VTU file for interactive visualization in ParaView.

Installation

APyCE is developed under Python>=3.8

To get the most current version, install it from Github:

git clone https://github.com/mateustosta/apyce-project.git
cd apyce-project

To setup the development environment, do the following

virtualenv --python=python3.8 venv3
source venv3/bin/activate
pip install -r requirements.txt
pip install .

or use Anaconda:

conda create -f environment.yml
conda activate apyce

Usage

A simple APyCe workflow is like this:

importapyceasapG=ap.grid.Grid(filename='Data/dome.grdecl', grid_origin='eclipse', verbose=True)
G.process_grid()
G.export_data()
G.plot_grid(filename='Data/Results/dome.vtu', lighting=False, property='PORO', show_edges=True, specular=0.0,
specular_power=0.0, show_scalar_bar=True, cmap='viridis')

Examples

APyCE produces ready-made visuals for high-quality publications.

  • Output of Getting_Started.py example with dome model

  • Output of Getting_Started.py example with PSY model

License

This code is released under the terms of the BSD license, and thus free for commercial and research use. Feel free to use the code into your own project with a PROPER REFERENCE.

Tosta. M, Wang B., Oliveira G.P., APyCE Project: A Python-based Builder/Eclipse wrapper for 3D visualization of reservoir grids, (2020), GitHub repository, https://github.com/mateustosta/apyce-project

About

A Python-based Builder/Eclipse wrapper for 3D visualization of reservoir grids

Topics

Resources

Stars

35 stars

Watchers

2 watching

Forks

Releases

Packages

Contributors

Languages