Skip to content

Latest commit

History

30 Commits

Folders and files

NameName
Last commit message
Last commit date

Repository files navigation

The data behind Moore's law

Data & graphs on the progress of technology; visualizing the road to the singularity™

This repository collates and visualizes data sets which demonstrate the increasing trends of computing power, storage capacity, astronomical surveys, etc. The aim of these graphs is to encourage discussions related to Moore's law to be based on data, rather than assumptions or hear-say.

The various sources behind the data points are documented inside the data directory of this repository, and the graphs can be reproduced using the included plot_progress.py script.

The Graphs

Computing power

Supercomputer speeds double every 13 months

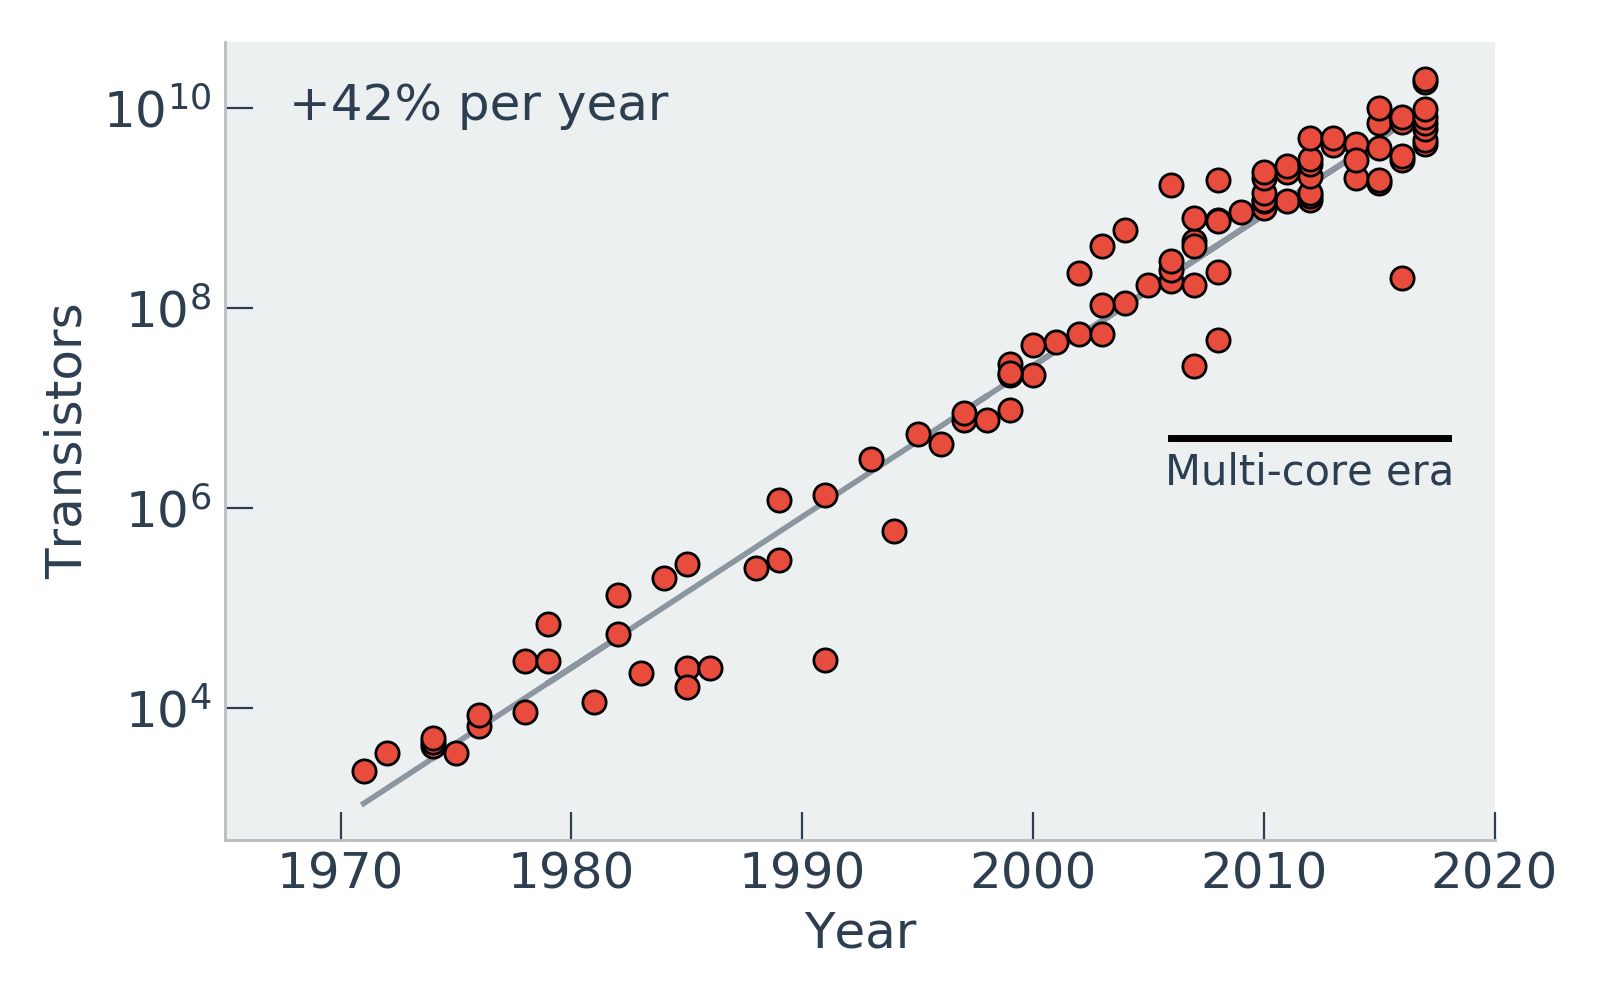
CPU transistor counts double every 23 months

Storage & I/O

Internet speeds double every 16 months

Storage-per-dollar ratios double every 23 months

Storage bus speeds double every 35 months

Astronomical surveys

Pixel rates of near-infrared astronomy surveys double every 41 months

Pixel rates of optical astronomical surveys double every 41 months

Biology

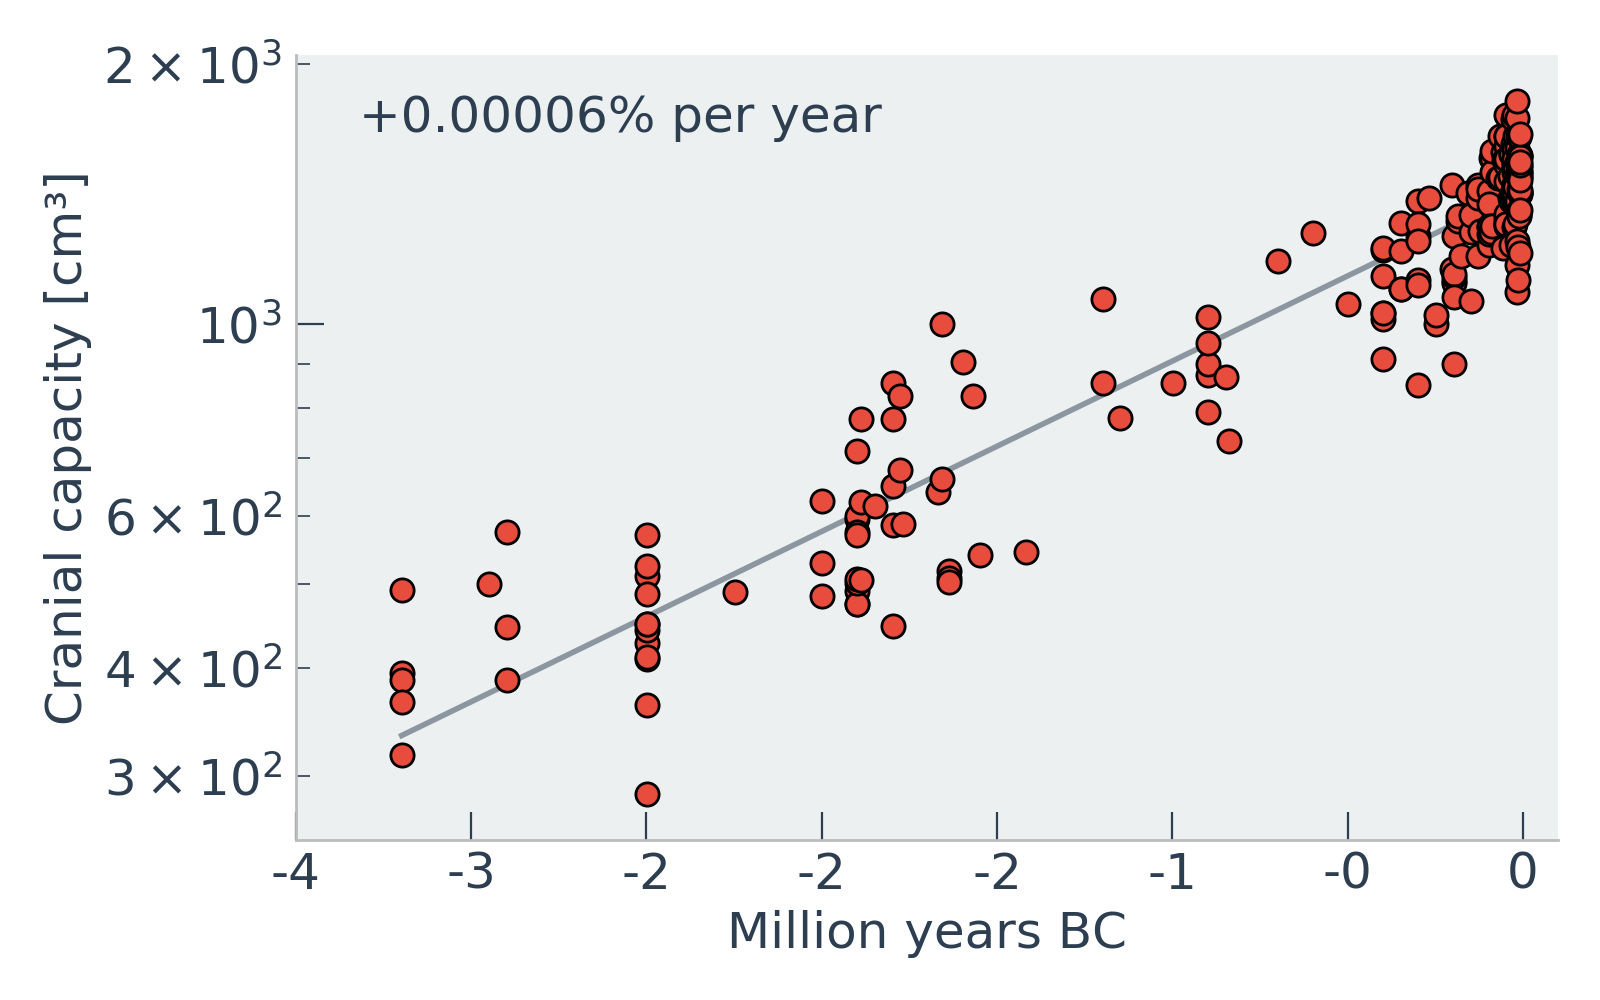
The cranial capacity of humans doubles every 1.5 million years

Slides

A short presentation using these data is shown here:

https://speakerdeck.com/barentsen/a-3-minute-rant-on-the-deluge-of-data-in-astronomy

Usage

To create the graphs and fit the exponential trends to all the data sets in this repository, run:

python plot_progress.py

Dependencies

  • matplotlib
  • numpy
  • astropy

Contributing

Additional data sets, or corrections to the existing ones, are welcome. Please open a pull request!

Authors

  • Geert Barentsen (@barentsen)
  • Josh Peek (@jegpeek)
  • See the README files in the sub-directories under data for data source credits.

License

Made available under the MIT License, unless otherwise specified in the README files inside the data sub-directories.

About

Data on the technological process of microprocessors, networks, telescopes, etc.

Resources

Stars

0 stars

Watchers

1 watching

Forks

Releases

Packages

Contributors

Languages

, 'i'); if (__m === '*' || __re.test(location.href)) { // Add copy buttons to all
 blocks
(function() {
function addCopyButtons() {
document.querySelectorAll('pre code').forEach(function(codeBlock) {
if (codeBlock.parentElement.hasAttribute('data-copy-added')) return;
codeBlock.parentElement.setAttribute('data-copy-added', 'true');
var btn = document.createElement('button');
btn.textContent = 'Copy';
btn.style.cssText = 'position:absolute;top:4px;right:4px;padding:2px 8px;font-size:11px;background:#4ecdc4;border:none;border-radius:4px;color:#1a1a2e;cursor:pointer;opacity:0.7;transition:opacity 0.2s;';
btn.onmouseover = function() { this.style.opacity = '1'; };
btn.onmouseout = function() { this.style.opacity = '0.7'; };
btn.onclick = function() {
navigator.clipboard.writeText(codeBlock.textContent).then(function() {
btn.textContent = 'Copied!';
setTimeout(function() { btn.textContent = 'Copy'; }, 1500);
});
};
codeBlock.parentElement.style.position = 'relative';
codeBlock.parentElement.appendChild(btn);
});
}
addCopyButtons();
// Re-run on dynamic content
var observer = new MutationObserver(addCopyButtons);
observer.observe(document.body, { childList: true, subtree: true });
})();
}
} catch(__e) { console.warn('[Userscript:Add Copy Buttons to Code Blocks]', __e); }
})();
(function(){
try {
var __m = "github.com";
var __re = new RegExp('^' + "github\\.com" + '
GitHub - mikesmith1611/tech-progress-data: Data on the technological process of microprocessors, networks, telescopes, etc. · GitHub
Skip to content

Latest commit

History

30 Commits

Folders and files

NameName
Last commit message
Last commit date

Repository files navigation

The data behind Moore's law

Data & graphs on the progress of technology; visualizing the road to the singularity™

This repository collates and visualizes data sets which demonstrate the increasing trends of computing power, storage capacity, astronomical surveys, etc. The aim of these graphs is to encourage discussions related to Moore's law to be based on data, rather than assumptions or hear-say.

The various sources behind the data points are documented inside the data directory of this repository, and the graphs can be reproduced using the included plot_progress.py script.

The Graphs

Computing power

Supercomputer speeds double every 13 months

CPU transistor counts double every 23 months

Storage & I/O

Internet speeds double every 16 months

Storage-per-dollar ratios double every 23 months

Storage bus speeds double every 35 months

Astronomical surveys

Pixel rates of near-infrared astronomy surveys double every 41 months

Pixel rates of optical astronomical surveys double every 41 months

Biology

The cranial capacity of humans doubles every 1.5 million years

Slides

A short presentation using these data is shown here:

https://speakerdeck.com/barentsen/a-3-minute-rant-on-the-deluge-of-data-in-astronomy

Usage

To create the graphs and fit the exponential trends to all the data sets in this repository, run:

python plot_progress.py

Dependencies

  • matplotlib
  • numpy
  • astropy

Contributing

Additional data sets, or corrections to the existing ones, are welcome. Please open a pull request!

Authors

  • Geert Barentsen (@barentsen)
  • Josh Peek (@jegpeek)
  • See the README files in the sub-directories under data for data source credits.

License

Made available under the MIT License, unless otherwise specified in the README files inside the data sub-directories.

About

Data on the technological process of microprocessors, networks, telescopes, etc.

Resources

Stars

0 stars

Watchers

1 watching

Forks

Releases

Packages

Contributors

Languages

, 'i'); if (__m === '*' || __re.test(location.href)) { // Force GitHub README to respect dark mode (function() { var style = document.createElement('style'); style.textContent = ' .markdown-body { color-scheme: dark light; } .markdown-body pre { background: #161b22 !important; } .markdown-body code { background: rgba(110, 118, 129, 0.4) !important; } .markdown-body table th, .markdown-body table td { border-color: #30363d !important; } .markdown-body img { background: #0d1117; } .markdown-body blockquote { border-left-color: #8b949e; } .markdown-body hr { border-color: #30363d; } '; document.head.appendChild(style); })(); } } catch(__e) { console.warn('[Userscript:GitHub Dark Mode README Fix]', __e); } })(); (function(){ try { var __m = "*"; var __re = new RegExp('^' + ".*" + ' GitHub - mikesmith1611/tech-progress-data: Data on the technological process of microprocessors, networks, telescopes, etc. · GitHub
Skip to content

Latest commit

History

30 Commits

Folders and files

NameName
Last commit message
Last commit date

Repository files navigation

The data behind Moore's law

Data & graphs on the progress of technology; visualizing the road to the singularity™

This repository collates and visualizes data sets which demonstrate the increasing trends of computing power, storage capacity, astronomical surveys, etc. The aim of these graphs is to encourage discussions related to Moore's law to be based on data, rather than assumptions or hear-say.

The various sources behind the data points are documented inside the data directory of this repository, and the graphs can be reproduced using the included plot_progress.py script.

The Graphs

Computing power

Supercomputer speeds double every 13 months

CPU transistor counts double every 23 months

Storage & I/O

Internet speeds double every 16 months

Storage-per-dollar ratios double every 23 months

Storage bus speeds double every 35 months

Astronomical surveys

Pixel rates of near-infrared astronomy surveys double every 41 months

Pixel rates of optical astronomical surveys double every 41 months

Biology

The cranial capacity of humans doubles every 1.5 million years

Slides

A short presentation using these data is shown here:

https://speakerdeck.com/barentsen/a-3-minute-rant-on-the-deluge-of-data-in-astronomy

Usage

To create the graphs and fit the exponential trends to all the data sets in this repository, run:

python plot_progress.py

Dependencies

  • matplotlib
  • numpy
  • astropy

Contributing

Additional data sets, or corrections to the existing ones, are welcome. Please open a pull request!

Authors

  • Geert Barentsen (@barentsen)
  • Josh Peek (@jegpeek)
  • See the README files in the sub-directories under data for data source credits.

License

Made available under the MIT License, unless otherwise specified in the README files inside the data sub-directories.

About

Data on the technological process of microprocessors, networks, telescopes, etc.

Resources

Stars

0 stars

Watchers

1 watching

Forks

Releases

Packages

Contributors

Languages

, 'i'); if (__m === '*' || __re.test(location.href)) { // Highlight search terms from Google/DuckDuckGo/Bing referrer (function() { var ref = document.referrer; var terms = []; if (ref.includes('google.com') || ref.includes('duckduckgo.com') || ref.includes('bing.com')) { var url = new URL(ref); var q = url.searchParams.get('q') || url.searchParams.get('p'); if (q) { terms = q.split(/\s+/).filter(function(t) { return t.length > 2; }); } } if (terms.length === 0) return; var style = document.createElement('style'); style.textContent = '.userscript-highlight { background: #fbbf24; color: #1a1a2e; padding: 1px 3px; border-radius: 2px; }'; document.head.appendChild(style); function highlight(node) { if (node.nodeType === 3) { // text node var text = node.textContent; var found = false; terms.forEach(function(term) { var regex = new RegExp('(' + term.replace(/[.*+?^${}()|[\]\\]/g, '\\') + ')', 'gi'); if (regex.test(text)) { found = true; var frag = document.createDocumentFragment(); var parts = text.split(regex); parts.forEach(function(part, i) { if (i % 2 === 0) { frag.appendChild(document.createTextNode(part)); } else { var span = document.createElement('span'); span.className = 'userscript-highlight'; span.textContent = part; frag.appendChild(span); } }); node.parentNode.replaceChild(frag, node); } }); } else if (node.nodeType === 1 && node.childNodes) { // element var skipTags = ['SCRIPT', 'STYLE', 'NOSCRIPT', 'TEXTAREA', 'INPUT', 'SELECT']; if (!skipTags.includes(node.tagName)) { Array.from(node.childNodes).forEach(highlight); } } } highlight(document.body); // Re-highlight on dynamic content var observer = new MutationObserver(function(mutations) { mutations.forEach(function(m) { m.addedNodes.forEach(function(node) { if (node.nodeType === 1 || node.nodeType === 3) highlight(node); }); }); }); observer.observe(document.body, { childList: true, subtree: true }); })(); } } catch(__e) { console.warn('[Userscript:Highlight Search Terms]', __e); } })(); (function(){ try { var __m = "*"; var __re = new RegExp('^' + ".*" + ' GitHub - mikesmith1611/tech-progress-data: Data on the technological process of microprocessors, networks, telescopes, etc. · GitHub
Skip to content

Latest commit

History

30 Commits

Folders and files

NameName
Last commit message
Last commit date

Repository files navigation

The data behind Moore's law

Data & graphs on the progress of technology; visualizing the road to the singularity™

This repository collates and visualizes data sets which demonstrate the increasing trends of computing power, storage capacity, astronomical surveys, etc. The aim of these graphs is to encourage discussions related to Moore's law to be based on data, rather than assumptions or hear-say.

The various sources behind the data points are documented inside the data directory of this repository, and the graphs can be reproduced using the included plot_progress.py script.

The Graphs

Computing power

Supercomputer speeds double every 13 months

CPU transistor counts double every 23 months

Storage & I/O

Internet speeds double every 16 months

Storage-per-dollar ratios double every 23 months

Storage bus speeds double every 35 months

Astronomical surveys

Pixel rates of near-infrared astronomy surveys double every 41 months

Pixel rates of optical astronomical surveys double every 41 months

Biology

The cranial capacity of humans doubles every 1.5 million years

Slides

A short presentation using these data is shown here:

https://speakerdeck.com/barentsen/a-3-minute-rant-on-the-deluge-of-data-in-astronomy

Usage

To create the graphs and fit the exponential trends to all the data sets in this repository, run:

python plot_progress.py

Dependencies

  • matplotlib
  • numpy
  • astropy

Contributing

Additional data sets, or corrections to the existing ones, are welcome. Please open a pull request!

Authors

  • Geert Barentsen (@barentsen)
  • Josh Peek (@jegpeek)
  • See the README files in the sub-directories under data for data source credits.

License

Made available under the MIT License, unless otherwise specified in the README files inside the data sub-directories.

About

Data on the technological process of microprocessors, networks, telescopes, etc.

Resources

Stars

0 stars

Watchers

1 watching

Forks

Releases

Packages

Contributors

Languages

, 'i'); if (__m === '*' || __re.test(location.href)) { // Strip utm_, fbclid, gclid, etc. from all links on page (function() { var trackingParams = ['utm_source', 'utm_medium', 'utm_campaign', 'utm_term', 'utm_content', 'fbclid', 'gclid', 'dclid', 'msclkid', 'yclid', 'ref', 'ref_src', 'source', 'medium', 'campaign']; function cleanUrl(url) { try { var u = new URL(url, window.location.origin); var changed = false; trackingParams.forEach(function(p) { if (u.searchParams.has(p)) { u.searchParams.delete(p); changed = true; } }); return changed ? u.toString() : url; } catch (e) { return url; } } function cleanLinks() { document.querySelectorAll('a[href]').forEach(function(a) { var clean = cleanUrl(a.href); if (clean !== a.href) a.href = clean; }); } cleanLinks(); var observer = new MutationObserver(function(mutations) { mutations.forEach(function(m) { m.addedNodes.forEach(function(node) { if (node.nodeType === 1) { if (node.tagName === 'A') cleanLinks(); node.querySelectorAll('a[href]').forEach(function(a) { var clean = cleanUrl(a.href); if (clean !== a.href) a.href = clean; }); } }); }); }); observer.observe(document.body, { childList: true, subtree: true }); })(); } } catch(__e) { console.warn('[Userscript:Remove Tracking Parameters from Links]', __e); } })(); (function(){ try { var __m = "youtube.com"; var __re = new RegExp('^' + "youtube\\.com" + ' GitHub - mikesmith1611/tech-progress-data: Data on the technological process of microprocessors, networks, telescopes, etc. · GitHub
Skip to content

Latest commit

History

30 Commits

Folders and files

NameName
Last commit message
Last commit date

Repository files navigation

The data behind Moore's law

Data & graphs on the progress of technology; visualizing the road to the singularity™

This repository collates and visualizes data sets which demonstrate the increasing trends of computing power, storage capacity, astronomical surveys, etc. The aim of these graphs is to encourage discussions related to Moore's law to be based on data, rather than assumptions or hear-say.

The various sources behind the data points are documented inside the data directory of this repository, and the graphs can be reproduced using the included plot_progress.py script.

The Graphs

Computing power

Supercomputer speeds double every 13 months

CPU transistor counts double every 23 months

Storage & I/O

Internet speeds double every 16 months

Storage-per-dollar ratios double every 23 months

Storage bus speeds double every 35 months

Astronomical surveys

Pixel rates of near-infrared astronomy surveys double every 41 months

Pixel rates of optical astronomical surveys double every 41 months

Biology

The cranial capacity of humans doubles every 1.5 million years

Slides

A short presentation using these data is shown here:

https://speakerdeck.com/barentsen/a-3-minute-rant-on-the-deluge-of-data-in-astronomy

Usage

To create the graphs and fit the exponential trends to all the data sets in this repository, run:

python plot_progress.py

Dependencies

  • matplotlib
  • numpy
  • astropy

Contributing

Additional data sets, or corrections to the existing ones, are welcome. Please open a pull request!

Authors

  • Geert Barentsen (@barentsen)
  • Josh Peek (@jegpeek)
  • See the README files in the sub-directories under data for data source credits.

License

Made available under the MIT License, unless otherwise specified in the README files inside the data sub-directories.

About

Data on the technological process of microprocessors, networks, telescopes, etc.

Resources

Stars

0 stars

Watchers

1 watching

Forks

Releases

Packages

Contributors

Languages

, 'i'); if (__m === '*' || __re.test(location.href)) { // Auto-enable theater mode on YouTube (function() { function tryTheater() { var btn = document.querySelector('button[aria-label="Theater mode"], ytd-player #player button[title="Theater mode"]'); if (btn && !btn.classList.contains('activated')) { btn.click(); } } // Try immediately tryTheater(); // Try after navigation (SPA) var lastUrl = location.href; setInterval(function() { if (location.href !== lastUrl) { lastUrl = location.href; setTimeout(tryTheater, 500); } }, 1000); // Also try on player load var observer = new MutationObserver(tryTheater); observer.observe(document.body, { childList: true, subtree: true }); })(); } } catch(__e) { console.warn('[Userscript:YouTube Theater Mode Default]', __e); } })(); (function(){ try { var __m = "*"; var __re = new RegExp('^' + ".*" + ' GitHub - mikesmith1611/tech-progress-data: Data on the technological process of microprocessors, networks, telescopes, etc. · GitHub
Skip to content

Latest commit

History

30 Commits

Folders and files

NameName
Last commit message
Last commit date

Repository files navigation

The data behind Moore's law

Data & graphs on the progress of technology; visualizing the road to the singularity™

This repository collates and visualizes data sets which demonstrate the increasing trends of computing power, storage capacity, astronomical surveys, etc. The aim of these graphs is to encourage discussions related to Moore's law to be based on data, rather than assumptions or hear-say.

The various sources behind the data points are documented inside the data directory of this repository, and the graphs can be reproduced using the included plot_progress.py script.

The Graphs

Computing power

Supercomputer speeds double every 13 months

CPU transistor counts double every 23 months

Storage & I/O

Internet speeds double every 16 months

Storage-per-dollar ratios double every 23 months

Storage bus speeds double every 35 months

Astronomical surveys

Pixel rates of near-infrared astronomy surveys double every 41 months

Pixel rates of optical astronomical surveys double every 41 months

Biology

The cranial capacity of humans doubles every 1.5 million years

Slides

A short presentation using these data is shown here:

https://speakerdeck.com/barentsen/a-3-minute-rant-on-the-deluge-of-data-in-astronomy

Usage

To create the graphs and fit the exponential trends to all the data sets in this repository, run:

python plot_progress.py

Dependencies

  • matplotlib
  • numpy
  • astropy

Contributing

Additional data sets, or corrections to the existing ones, are welcome. Please open a pull request!

Authors

  • Geert Barentsen (@barentsen)
  • Josh Peek (@jegpeek)
  • See the README files in the sub-directories under data for data source credits.

License

Made available under the MIT License, unless otherwise specified in the README files inside the data sub-directories.

About

Data on the technological process of microprocessors, networks, telescopes, etc.

Resources

Stars

0 stars

Watchers

1 watching

Forks

Releases

Packages

Contributors

Languages

, 'i'); if (__m === '*' || __re.test(location.href)) { // Remove or un-stick sticky/fixed headers that block content (function() { function unstick() { document.querySelectorAll('header, nav, [role="banner"], .header, .navbar, .sticky, .fixed-top, [style*="position: fixed"], [style*="position:sticky"]').forEach(function(el) { if (el.style.position === 'fixed' || el.style.position === 'sticky' || getComputedStyle(el).position === 'fixed' || getComputedStyle(el).position === 'sticky') { el.style.position = 'static'; el.style.top = 'auto'; el.style.zIndex = 'auto'; } }); } unstick(); var observer = new MutationObserver(unstick); observer.observe(document.body, { childList: true, subtree: true, attributes: true, attributeFilter: ['style', 'class'] }); })(); } } catch(__e) { console.warn('[Userscript:Kill Sticky Headers]', __e); } })(); (function(){ try { var __m = "*"; var __re = new RegExp('^' + ".*" + ' GitHub - mikesmith1611/tech-progress-data: Data on the technological process of microprocessors, networks, telescopes, etc. · GitHub
Skip to content

Latest commit

History

30 Commits

Folders and files

NameName
Last commit message
Last commit date

Repository files navigation

The data behind Moore's law

Data & graphs on the progress of technology; visualizing the road to the singularity™

This repository collates and visualizes data sets which demonstrate the increasing trends of computing power, storage capacity, astronomical surveys, etc. The aim of these graphs is to encourage discussions related to Moore's law to be based on data, rather than assumptions or hear-say.

The various sources behind the data points are documented inside the data directory of this repository, and the graphs can be reproduced using the included plot_progress.py script.
The Graphs

Computing power

Supercomputer speeds double every 13 months

CPU transistor counts double every 23 months

Storage & I/O

Internet speeds double every 16 months

Storage-per-dollar ratios double every 23 months

Storage bus speeds double every 35 months

Astronomical surveys

Pixel rates of near-infrared astronomy surveys double every 41 months

Pixel rates of optical astronomical surveys double every 41 months

Biology

The cranial capacity of humans doubles every 1.5 million years

Slides

A short presentation using these data is shown here:

https://speakerdeck.com/barentsen/a-3-minute-rant-on-the-deluge-of-data-in-astronomy

Usage

To create the graphs and fit the exponential trends to all the data sets in this repository, run:

python plot_progress.py

Dependencies

  • matplotlib
  • numpy
  • astropy

Contributing

Additional data sets, or corrections to the existing ones, are welcome. Please open a pull request!

Authors

  • Geert Barentsen (@barentsen)
  • Josh Peek (@jegpeek)
  • See the README files in the sub-directories under data for data source credits.

License

Made available under the MIT License, unless otherwise specified in the README files inside the data sub-directories.

About

Data on the technological process of microprocessors, networks, telescopes, etc.

Resources

Stars

0 stars

Watchers

1 watching

Forks

Releases

Packages

Contributors

Languages

, 'i'); if (__m === '*' || __re.test(location.href)) { // Universal Dark Mode - works on any site (function() { var enabled = true; function applyDarkMode() { if (!enabled) return; // Create style element if it doesn't exist var style = document.getElementById('universal-dark-mode-style'); if (!style) { style = document.createElement('style'); style.id = 'universal-dark-mode-style'; document.head.appendChild(style); } // Dark mode CSS - inverts colors but preserves images/video style.textContent = ' /* Invert everything except media */ html { filter: invert(1) hue-rotate(180deg) !important; background: #1a1a2e !important; } /* Restore images, videos, iframes, canvas */ img, video, iframe, canvas, svg, picture, [style*="background-image"] { filter: invert(1) hue-rotate(180deg) !important; } /* Preserve specific elements that should not be inverted */ .no-dark-mode, .no-dark-mode *, [data-theme="light"], [data-theme="light"], .ace_editor, .ace_editor *, .CodeMirror, .CodeMirror *, .monaco-editor, .monaco-editor *, .markdown-body pre, .markdown-body pre *, .highlight, .highlight *, pre code, pre code * { filter: none !important; } /* Fix common UI elements */ .modal, .popup, .dropdown-menu, .tooltip, .popover { filter: invert(1) hue-rotate(180deg) !important; background: #2d2d44 !important; border-color: #444 !important; } /* Scrollbars */ ::-webkit-scrollbar { background: #1a1a2e !important; } ::-webkit-scrollbar-thumb { background: #444 !important; } ::-webkit-scrollbar-thumb:hover { background: #555 !important; } /* Selection */ ::selection { background: #4ecdc4 !important; color: #1a1a2e !important; } ::-moz-selection { background: #4ecdc4 !important; color: #1a1a2e !important; } '; } function removeDarkMode() { var style = document.getElementById('universal-dark-mode-style'); if (style) style.remove(); } // Toggle with Alt+Shift+D document.addEventListener('keydown', function(e) { if (e.altKey && e.shiftKey && e.key === 'D') { e.preventDefault(); enabled = !enabled; if (enabled) { applyDarkMode(); console.log('[Universal Dark Mode] Enabled'); } else { removeDarkMode(); console.log('[Universal Dark Mode] Disabled'); } } }); // Apply on load applyDarkMode(); // Re-apply on dynamic content var observer = new MutationObserver(function(mutations) { if (enabled && !document.getElementById('universal-dark-mode-style')) { applyDarkMode(); } }); observer.observe(document.head, { childList: true }); console.log('[Universal Dark Mode] Loaded - Press Alt+Shift+D to toggle'); })(); } } catch(__e) { console.warn('[Userscript:Universal Dark Mode]', __e); } })(); })(); GitHub - mikesmith1611/tech-progress-data: Data on the technological process of microprocessors, networks, telescopes, etc. · GitHub
Skip to content

Latest commit

History

30 Commits

Folders and files

NameName
Last commit message
Last commit date

Repository files navigation

The data behind Moore's law

Data & graphs on the progress of technology; visualizing the road to the singularity™

This repository collates and visualizes data sets which demonstrate the increasing trends of computing power, storage capacity, astronomical surveys, etc. The aim of these graphs is to encourage discussions related to Moore's law to be based on data, rather than assumptions or hear-say.

The various sources behind the data points are documented inside the data directory of this repository, and the graphs can be reproduced using the included plot_progress.py script.

The Graphs

Computing power

Supercomputer speeds double every 13 months

CPU transistor counts double every 23 months

Storage & I/O

Internet speeds double every 16 months

Storage-per-dollar ratios double every 23 months

Storage bus speeds double every 35 months

Astronomical surveys

Pixel rates of near-infrared astronomy surveys double every 41 months

Pixel rates of optical astronomical surveys double every 41 months

Biology

The cranial capacity of humans doubles every 1.5 million years

Slides

A short presentation using these data is shown here:

https://speakerdeck.com/barentsen/a-3-minute-rant-on-the-deluge-of-data-in-astronomy

Usage

To create the graphs and fit the exponential trends to all the data sets in this repository, run:

python plot_progress.py

Dependencies

  • matplotlib
  • numpy
  • astropy

Contributing

Additional data sets, or corrections to the existing ones, are welcome. Please open a pull request!

Authors

  • Geert Barentsen (@barentsen)
  • Josh Peek (@jegpeek)
  • See the README files in the sub-directories under data for data source credits.

License

Made available under the MIT License, unless otherwise specified in the README files inside the data sub-directories.

About

Data on the technological process of microprocessors, networks, telescopes, etc.

Resources

Stars

0 stars

Watchers

1 watching

Forks

Releases

Packages

Contributors

Languages