




Community-maintained fork: This is a community-maintained fork of Facebook Research's HiPlot, which has been archived. We aim to keep the project alive with bug fixes, security updates, and new features.
HiPlot is a lightweight interactive visualization tool to help AI researchers discover correlations and patterns in high-dimensional data using parallel plots and other graphical ways to represent information.
There are several modes to HiPlot:
- As a web-server (if your data is a CSV for instance)
- In a jupyter notebook (to visualize python data), or in Streamlit apps
- In CLI to render standalone HTML
# Render a CSV to interactive HTML (no install needed)
uvx hiplot-mm data.csv > output.html
# Or start an interactive server
uvx --from 'hiplot-mm[server]' hiplot --port 8765# Core package (HTML export, CLI rendering)
pip install hiplot-mm
# With Jupyter notebook support
pip install hiplot-mm[notebook]
# With web server support (hiplot command)
pip install hiplot-mm[server]
# With Streamlit support
pip install hiplot-mm[streamlit]
# Everything
pip install hiplot-mm[all]If you have a Jupyter notebook, you can get started with something as simple as:
importhiplotashipdata= [{'dropout':0.1, 'lr': 0.001, 'loss': 10.0, 'optimizer': 'SGD'},
{'dropout':0.15, 'lr': 0.01, 'loss': 3.5, 'optimizer': 'Adam'},
{'dropout':0.3, 'lr': 0.1, 'loss': 4.5, 'optimizer': 'Adam'}]
hip.Experiment.from_iterable(data).display()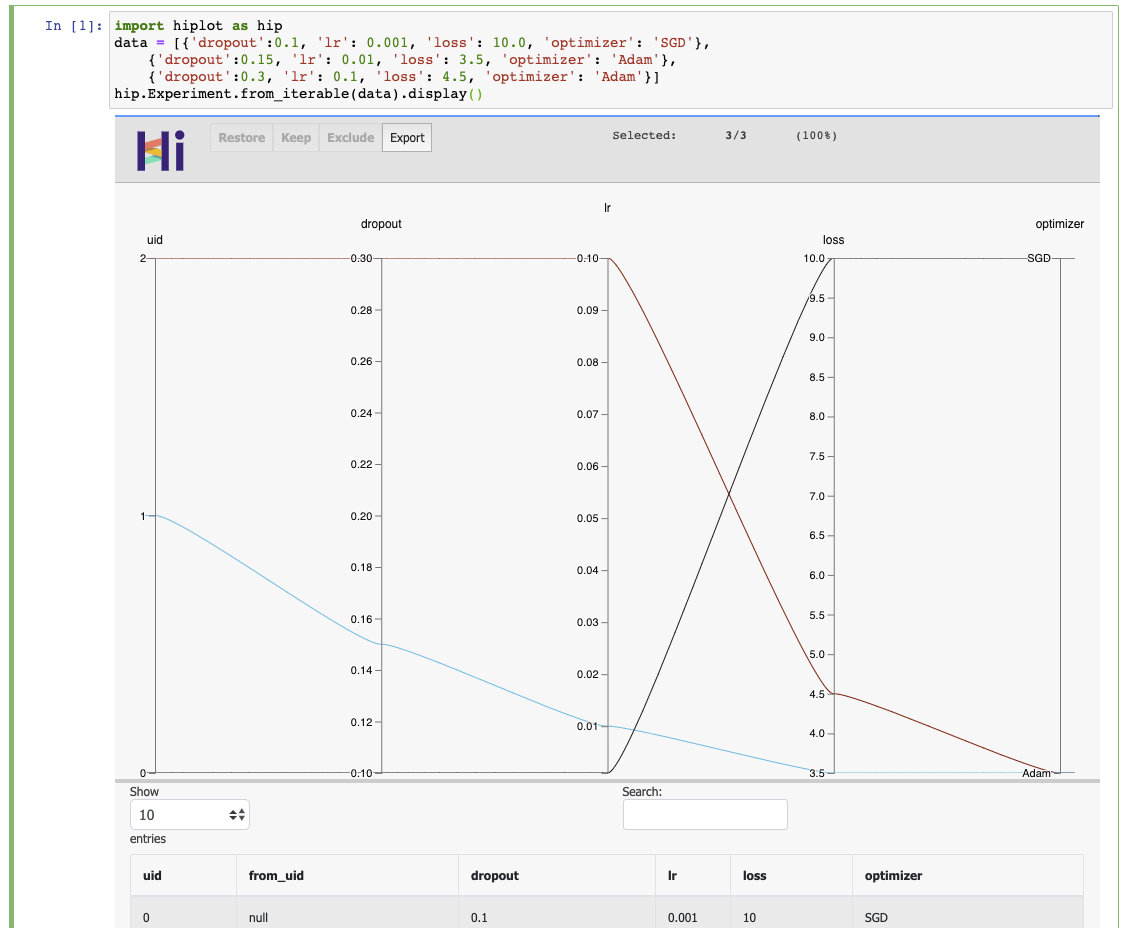
- Repository: https://github.com/mindthemath/hiplot
- Documentation: https://mindthemath.github.io/hiplot/
- PyPI package: https://pypi.org/project/hiplot-mm/
- Examples: https://github.com/mindthemath/hiplot/tree/main/examples
- Original blog post: https://ai.facebook.com/blog/hiplot-high-dimensional-interactive-plots-made-easy/
To build from source:
# Install frontend dependencies
bun install
# Install default contributor dependencies (dev/test)
uv sync
# Build JavaScript bundles
bun run build
# Build Python package
uv build
# Or use the all-in-one build script
./build.sh
Common contributor tasks:
# Run Python tests
uv run pytest
# Build docs (docs deps resolved on-demand)
uv run --no-default-groups --group docs sphinx-build -b html docs docs/_build/html
Output directories:
npm-dist/- NPM package artifactsdist/- Python wheel and sdisthiplot/static/built/- JS bundle included in Python package
Run the dev server:
uv run --extra server hiplot --port 8765@misc{hiplot,
author = {Haziza, D. and Rapin, J. and Synnaeve, G.},
title = {{Hiplot, interactive high-dimensionality plots}},
year = {2020},
publisher = {GitHub},
journal = {GitHub repository},
howpublished = {\url{https://github.com/facebookresearch/hiplot}},
}Inspired by and based on code from Kai Chang, Mike Bostock and Jason Davies.
External contributors (please add your name when you submit your first pull request):