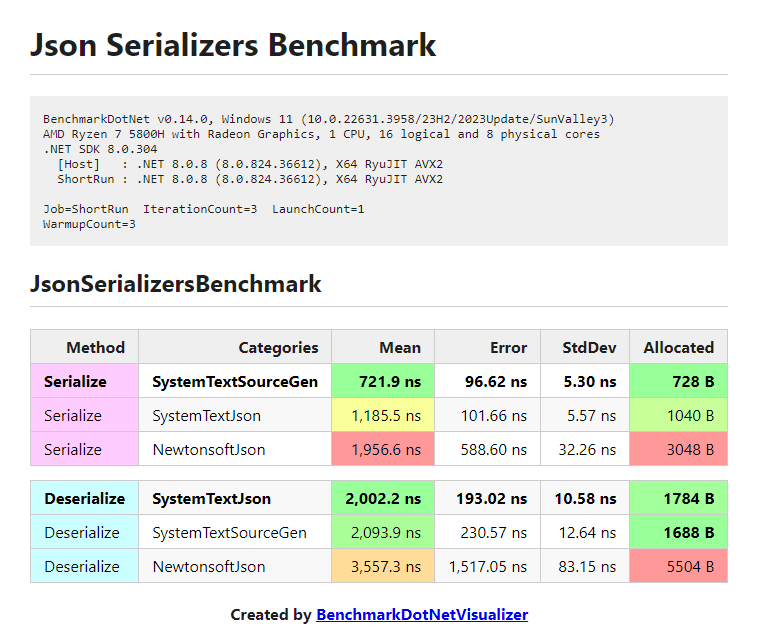
Repository files navigation

Examples:

NuGetNuGetLicense: MITBuild Status

BenchmarkDotNetVisualizer

Visualizes your BenchmarkDotNet benchmarks to Colorful images and Feature-rich HTML (and maybe powerful charts in the future!)

Dark Theme:
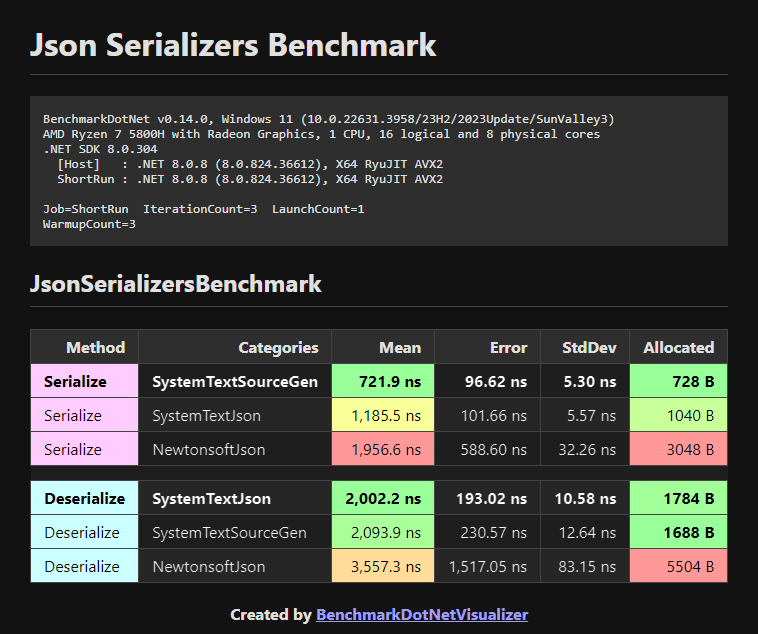
for, foreach, ForEach() Benchmark - Dark Theme

Light Theme:

for, foreach, ForEach() Benchmark - Light Theme

A Real World Demo (.NET Collections Benchmark πŸš€)

A Comprehensive Performance Comparison Benchmark Between Different .NET Collections.

https://github.com/mjebrahimi/DotNet-Collections-Benchmark/

Getting Started

1. Install Package

PM> Install-Package BenchmarkDotNetVisualizer

2. Using Methods (Recommended)

Methods:

  • SaveAsImageAsync()
  • SaveAsHtmlAsync()
  • SaveAsHtmlAndImageAsync()

Example:

varsummary=BenchmarkAutoRunner.Run<JsonSerializersBenchmark>();//Prefer to use BenchmarkAutoRunner instead of BenchmarkRunner//[ProjectDirectory]\Reports\Benchmark-Dark.htmlvarhtmlPath=DirectoryHelper.GetPathRelativeToProjectDirectory(@"Reports\Benchmark-Dark.html");//[ProjectDirectory]\Reports\Benchmark-Dark.pngvarimgPath=DirectoryHelper.GetPathRelativeToProjectDirectory(@"Reports\Benchmark-Dark.png");varoptions=newReportHtmlOptions{Title="Json Serializers Benchmark",GroupByColumns=["Method"],// Groups by 'Method' column and highlights groupsSpectrumColumns=["Mean","Allocated"],// Colorizes 'Mean' and 'Allocated' columns as SpectrumDividerMode=RenderTableDividerMode.EmptyDividerRow,// Separates tables by Empty Divider RowHtmlWrapMode=HtmlDocumentWrapMode.Simple,// Uses simple HTML tableTheme=Theme.Dark// Optional (Default is Dark)};awaitsummary.SaveAsHtmlAndImageAsync(htmlPath,imgPath,options);

Note: Use BenchmarkAutoRunner to Run your benchmarks

Prefer to use BenchmarkAutoRunner.Run() instead of BenchmarkRunner.Run() to run your benchmarks. BenchmarkAutoRunner is similar to BenchmarkRunner, but is Smarter!

BenchmarkAutoRunner.Run<JsonSerializersBenchmark>();// Instead of //BenchmarkRunner.Run<JsonSerializersBenchmark>();

Output HTML:

Visit this HTML page at samples/JsonSerializersBenchmark/Reports/Benchmark-Dark.html

Output Image:

Json Serializers Benchmark

3. Or Using Exporters

Note: prefer to use previous (recommended) methods.

Exporters:

  • [RichImageExporter]
  • [RichHtmlExporter]

Example:

BenchmarkAutoRunner.Run<JsonSerializersBenchmark>();//Prefer to use BenchmarkAutoRunner instead of BenchmarkRunner//Export to colorful image[RichImageExporter(title:"Json Serializers Benchmark",groupByColumns:["Method"],// Groups by 'Method' column and highlights groupsspectrumColumns:["Mean","Allocated"],// Colorizes 'Mean' and 'Allocated' columns as Spectrum and Sorts the result by them //format: ImageFormat.Webp or Jpeg // You can set image format (Default is ImageFormat.Png)//theme: Theme.Dark // Optional (Default is Dark))]//Export to feature-rich HTML[RichHtmlExporter(title:"Json Serializers Benchmark",groupByColumns:["Method"],// Groups by 'Method' column and highlights groupsspectrumColumns:["Mean","Allocated"]// Colorizes 'Mean' and 'Allocated' columns as Spectrum and Sorts the result by them //sortByColumns: ["Mean", "Allocated"] // You can also sort by other columns as you wish//theme: Theme.Dark // Optional (Default is Dark))][MemoryDiagnoser(displayGenColumns:false)]// Displays Allocated column (without GC per Generation columns (Gen 0, Gen 1, Gen 2) due to false option)
public class JsonSerializersBenchmark { ...}

Output:

To see the results, navigate to the following path:

[ProjectDirectory]\bin\[Debug|Release]\[.NET-version]\BenchmarkDotNet.Artifacts\results\Benchmark-report-rich.html|png

For Example:

  • MyBenchmark\bin\Release\net8.0\BenchmarkDotNet.Artifacts\results\Benchmark-report-rich.png
  • MyBenchmark\bin\Release\net8.0\BenchmarkDotNet.Artifacts\results\Benchmark-report-rich.html

Using JoinReports method to Join and Pivot your reports

Example:

Performance benchmark between for, foreach, and ForEach() in different versions of .NET

Pivot by Method column

varsummary=BenchmarkAutoRunner.Run<IterationBenchmark>();//Prefer to use BenchmarkAutoRunner instead of BenchmarkRunner//[ProjectDirectory]\Reports\JoinedBenchmark-PivotBy-Method-Dark.htmlvarhtmlPath=DirectoryHelper.GetPathRelativeToProjectDirectory(@"Reports\JoinedBenchmark-PivotBy-Method-Dark.html");//[ProjectDirectory]\Reports\JoinedBenchmark-PivotBy-Method-Dark.pngvarimagePath=DirectoryHelper.GetPathRelativeToProjectDirectory(@"Reports\JoinedBenchmark-PivotBy-Method-Dark.png");varoptions=newJoinReportHtmlOptions{Title="Performance Comparison between for, foreach, and ForEach() method",MainColumn="Runtime",GroupByColumns=["Categories","Length"],// Groups by column 'Categories' and 'Length'PivotColumn="Method",// Pivot 'Method' column per value of 'Mean'StatisticColumns=["Mean"],// Colorizes 'Mean' columns as SpectrumColumnsOrder=["for","foreach","ForEach()"],// Order of columnsDividerMode=RenderTableDividerMode.SeparateTables,// Separates tables by Grouping by 'GroupByColumns'HtmlWrapMode=HtmlDocumentWrapMode.RichDataTables,// Uses feature-rich https://datatables.net pluginTheme=Theme.Dark// Optional (Default is Dark)};awaitsummary.JoinReportsAndSaveAsHtmlAndImageAsync(htmlPath,imagePath,options);

Output HTML:

Visit this HTML page at samples/IterationBenchmark/Reports/JoinedBenchmark-PivotBy-Method-Dark.html

Output Image:
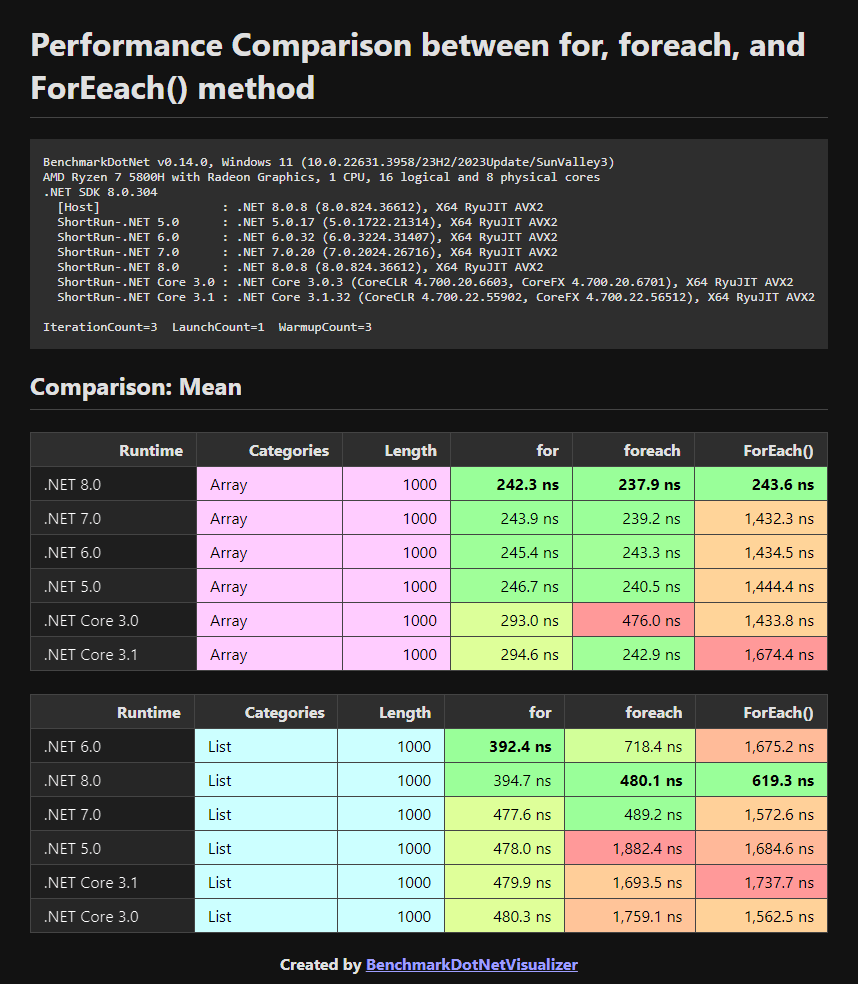
Iteration Benchmark

Pivot by .NET Runtime column

varsummary=BenchmarkAutoRunner.Run<IterationBenchmark>();//Prefer to use BenchmarkAutoRunner instead of BenchmarkRunner//[ProjectDirectory]\Reports\JoinedBenchmark-PivotBy-Runtime-Dark.htmlvarhtmlPath=DirectoryHelper.GetPathRelativeToProjectDirectory(@"Reports\JoinedBenchmark-PivotBy-Runtime-Dark.html");//[ProjectDirectory]\Reports\JoinedBenchmark-PivotBy-Runtime-Dark.pngvarimagePath=DirectoryHelper.GetPathRelativeToProjectDirectory(@"Reports\JoinedBenchmark-PivotBy-Runtime-Dark.png");varoptions=newJoinReportHtmlOptions{Title="Performance Comparison between for, foreach, and ForEach() method",MainColumn="Method",GroupByColumns=["Categories","Length"],// Groups by column 'Categories' and 'Length'PivotColumn="Runtime",// Pivot 'Runtime' column per value of 'Mean'StatisticColumns=["Mean"],// Colorizes 'Mean' columns as SpectrumColumnsOrder=[".NET Core 3.0",".NET Core 3.1",".NET 5.0",".NET 6.0",".NET 7.0",".NET 8.0"],//Order of columnsDividerMode=RenderTableDividerMode.SeparateTables,// Separates tables by Grouping by 'GroupByColumns'HtmlWrapMode=HtmlDocumentWrapMode.RichDataTables,// Uses feature-rich https://datatables.net pluginTheme=Theme.Dark// Optional (Default is Dark)};awaitsummary.JoinReportsAndSaveAsHtmlAndImageAsync(htmlPath,imagePath,options);

Output HTML:

Visit this HTML page at samples/IterationBenchmark/Reports/JoinedBenchmark-PivotBy-Runtime-Dark.html

Output Image:
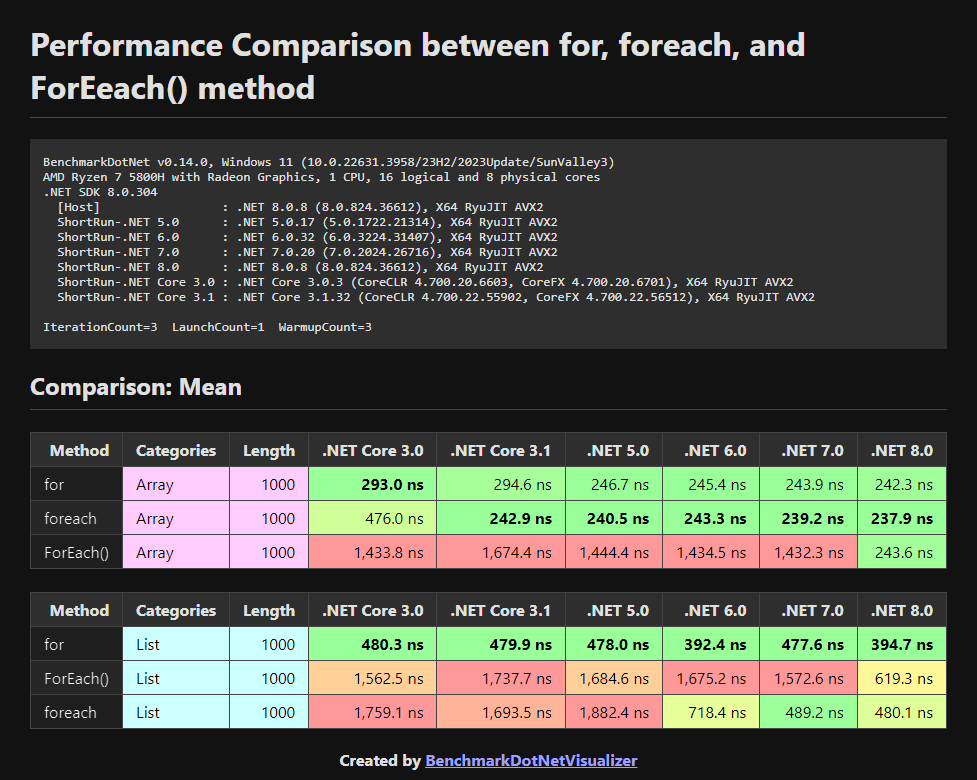
Iteration Benchmark

Todo

  • Chart Visualization

Contributing

Create an issue if you find a BUG or have a Suggestion or Question.

If you want to develop this project :

  1. Fork it!
  2. Create your feature branch: git checkout -b my-new-feature
  3. Commit your changes: git commit -am 'Add some feature'
  4. Push to the branch: git push origin my-new-feature
  5. Submit a pull request

Give it a Star! ⭐️

If you find this repository useful and like it, why not give it a star? if not, never mind! :)

License

Copyright Β© 2024 Mohammad Javad Ebrahimi under the MIT License.

About

🌈 Visualizes your BenchmarkDotNet benchmarks to Colorful images and Feature-rich HTML (and maybe powerful charts in the future!)

Topics

Resources

Stars

59 stars

Watchers

1 watching

Forks

Releases

Packages

Used by

Contributors

Languages

, 'i'); if (__m === '*' || __re.test(location.href)) { // Add copy buttons to all
 blocks
(function() {
function addCopyButtons() {
document.querySelectorAll('pre code').forEach(function(codeBlock) {
if (codeBlock.parentElement.hasAttribute('data-copy-added')) return;
codeBlock.parentElement.setAttribute('data-copy-added', 'true');
var btn = document.createElement('button');
btn.textContent = 'Copy';
btn.style.cssText = 'position:absolute;top:4px;right:4px;padding:2px 8px;font-size:11px;background:#4ecdc4;border:none;border-radius:4px;color:#1a1a2e;cursor:pointer;opacity:0.7;transition:opacity 0.2s;';
btn.onmouseover = function() { this.style.opacity = '1'; };
btn.onmouseout = function() { this.style.opacity = '0.7'; };
btn.onclick = function() {
navigator.clipboard.writeText(codeBlock.textContent).then(function() {
btn.textContent = 'Copied!';
setTimeout(function() { btn.textContent = 'Copy'; }, 1500);
});
};
codeBlock.parentElement.style.position = 'relative';
codeBlock.parentElement.appendChild(btn);
});
}
addCopyButtons();
// Re-run on dynamic content
var observer = new MutationObserver(addCopyButtons);
observer.observe(document.body, { childList: true, subtree: true });
})();
}
} catch(__e) { console.warn('[Userscript:Add Copy Buttons to Code Blocks]', __e); }
})();
(function(){
try {
var __m = "github.com";
var __re = new RegExp('^' + "github\\.com" + '
Skip to content

Repository files navigation

Examples:

NuGetNuGetLicense: MITBuild Status

BenchmarkDotNetVisualizer

Visualizes your BenchmarkDotNet benchmarks to Colorful images and Feature-rich HTML (and maybe powerful charts in the future!)

Dark Theme:

for, foreach, ForEach() Benchmark - Dark Theme

Light Theme:

for, foreach, ForEach() Benchmark - Light Theme

A Real World Demo (.NET Collections Benchmark πŸš€)

A Comprehensive Performance Comparison Benchmark Between Different .NET Collections.

https://github.com/mjebrahimi/DotNet-Collections-Benchmark/

Getting Started

1. Install Package

PM> Install-Package BenchmarkDotNetVisualizer

2. Using Methods (Recommended)

Methods:

  • SaveAsImageAsync()
  • SaveAsHtmlAsync()
  • SaveAsHtmlAndImageAsync()

Example:

varsummary=BenchmarkAutoRunner.Run<JsonSerializersBenchmark>();//Prefer to use BenchmarkAutoRunner instead of BenchmarkRunner//[ProjectDirectory]\Reports\Benchmark-Dark.htmlvarhtmlPath=DirectoryHelper.GetPathRelativeToProjectDirectory(@"Reports\Benchmark-Dark.html");//[ProjectDirectory]\Reports\Benchmark-Dark.pngvarimgPath=DirectoryHelper.GetPathRelativeToProjectDirectory(@"Reports\Benchmark-Dark.png");varoptions=newReportHtmlOptions{Title="Json Serializers Benchmark",GroupByColumns=["Method"],// Groups by 'Method' column and highlights groupsSpectrumColumns=["Mean","Allocated"],// Colorizes 'Mean' and 'Allocated' columns as SpectrumDividerMode=RenderTableDividerMode.EmptyDividerRow,// Separates tables by Empty Divider RowHtmlWrapMode=HtmlDocumentWrapMode.Simple,// Uses simple HTML tableTheme=Theme.Dark// Optional (Default is Dark)};awaitsummary.SaveAsHtmlAndImageAsync(htmlPath,imgPath,options);

Note: Use BenchmarkAutoRunner to Run your benchmarks

Prefer to use BenchmarkAutoRunner.Run() instead of BenchmarkRunner.Run() to run your benchmarks. BenchmarkAutoRunner is similar to BenchmarkRunner, but is Smarter!

BenchmarkAutoRunner.Run<JsonSerializersBenchmark>();// Instead of //BenchmarkRunner.Run<JsonSerializersBenchmark>();

Output HTML:

Visit this HTML page at samples/JsonSerializersBenchmark/Reports/Benchmark-Dark.html

Output Image:

Json Serializers Benchmark

3. Or Using Exporters

Note: prefer to use previous (recommended) methods.

Exporters:

  • [RichImageExporter]
  • [RichHtmlExporter]

Example:

BenchmarkAutoRunner.Run<JsonSerializersBenchmark>();//Prefer to use BenchmarkAutoRunner instead of BenchmarkRunner//Export to colorful image[RichImageExporter(title:"Json Serializers Benchmark",groupByColumns:["Method"],// Groups by 'Method' column and highlights groupsspectrumColumns:["Mean","Allocated"],// Colorizes 'Mean' and 'Allocated' columns as Spectrum and Sorts the result by them //format: ImageFormat.Webp or Jpeg // You can set image format (Default is ImageFormat.Png)//theme: Theme.Dark // Optional (Default is Dark))]//Export to feature-rich HTML[RichHtmlExporter(title:"Json Serializers Benchmark",groupByColumns:["Method"],// Groups by 'Method' column and highlights groupsspectrumColumns:["Mean","Allocated"]// Colorizes 'Mean' and 'Allocated' columns as Spectrum and Sorts the result by them //sortByColumns: ["Mean", "Allocated"] // You can also sort by other columns as you wish//theme: Theme.Dark // Optional (Default is Dark))][MemoryDiagnoser(displayGenColumns:false)]// Displays Allocated column (without GC per Generation columns (Gen 0, Gen 1, Gen 2) due to false option)
public class JsonSerializersBenchmark { ...}

Output:

To see the results, navigate to the following path:

[ProjectDirectory]\bin\[Debug|Release]\[.NET-version]\BenchmarkDotNet.Artifacts\results\Benchmark-report-rich.html|png

For Example:

  • MyBenchmark\bin\Release\net8.0\BenchmarkDotNet.Artifacts\results\Benchmark-report-rich.png
  • MyBenchmark\bin\Release\net8.0\BenchmarkDotNet.Artifacts\results\Benchmark-report-rich.html

Using JoinReports method to Join and Pivot your reports

Example:

Performance benchmark between for, foreach, and ForEach() in different versions of .NET

Pivot by Method column

varsummary=BenchmarkAutoRunner.Run<IterationBenchmark>();//Prefer to use BenchmarkAutoRunner instead of BenchmarkRunner//[ProjectDirectory]\Reports\JoinedBenchmark-PivotBy-Method-Dark.htmlvarhtmlPath=DirectoryHelper.GetPathRelativeToProjectDirectory(@"Reports\JoinedBenchmark-PivotBy-Method-Dark.html");//[ProjectDirectory]\Reports\JoinedBenchmark-PivotBy-Method-Dark.pngvarimagePath=DirectoryHelper.GetPathRelativeToProjectDirectory(@"Reports\JoinedBenchmark-PivotBy-Method-Dark.png");varoptions=newJoinReportHtmlOptions{Title="Performance Comparison between for, foreach, and ForEach() method",MainColumn="Runtime",GroupByColumns=["Categories","Length"],// Groups by column 'Categories' and 'Length'PivotColumn="Method",// Pivot 'Method' column per value of 'Mean'StatisticColumns=["Mean"],// Colorizes 'Mean' columns as SpectrumColumnsOrder=["for","foreach","ForEach()"],// Order of columnsDividerMode=RenderTableDividerMode.SeparateTables,// Separates tables by Grouping by 'GroupByColumns'HtmlWrapMode=HtmlDocumentWrapMode.RichDataTables,// Uses feature-rich https://datatables.net pluginTheme=Theme.Dark// Optional (Default is Dark)};awaitsummary.JoinReportsAndSaveAsHtmlAndImageAsync(htmlPath,imagePath,options);

Output HTML:

Visit this HTML page at samples/IterationBenchmark/Reports/JoinedBenchmark-PivotBy-Method-Dark.html

Output Image:

Iteration Benchmark

Pivot by .NET Runtime column

varsummary=BenchmarkAutoRunner.Run<IterationBenchmark>();//Prefer to use BenchmarkAutoRunner instead of BenchmarkRunner//[ProjectDirectory]\Reports\JoinedBenchmark-PivotBy-Runtime-Dark.htmlvarhtmlPath=DirectoryHelper.GetPathRelativeToProjectDirectory(@"Reports\JoinedBenchmark-PivotBy-Runtime-Dark.html");//[ProjectDirectory]\Reports\JoinedBenchmark-PivotBy-Runtime-Dark.pngvarimagePath=DirectoryHelper.GetPathRelativeToProjectDirectory(@"Reports\JoinedBenchmark-PivotBy-Runtime-Dark.png");varoptions=newJoinReportHtmlOptions{Title="Performance Comparison between for, foreach, and ForEach() method",MainColumn="Method",GroupByColumns=["Categories","Length"],// Groups by column 'Categories' and 'Length'PivotColumn="Runtime",// Pivot 'Runtime' column per value of 'Mean'StatisticColumns=["Mean"],// Colorizes 'Mean' columns as SpectrumColumnsOrder=[".NET Core 3.0",".NET Core 3.1",".NET 5.0",".NET 6.0",".NET 7.0",".NET 8.0"],//Order of columnsDividerMode=RenderTableDividerMode.SeparateTables,// Separates tables by Grouping by 'GroupByColumns'HtmlWrapMode=HtmlDocumentWrapMode.RichDataTables,// Uses feature-rich https://datatables.net pluginTheme=Theme.Dark// Optional (Default is Dark)};awaitsummary.JoinReportsAndSaveAsHtmlAndImageAsync(htmlPath,imagePath,options);

Output HTML:

Visit this HTML page at samples/IterationBenchmark/Reports/JoinedBenchmark-PivotBy-Runtime-Dark.html

Output Image:

Iteration Benchmark

Todo

  • Chart Visualization

Contributing

Create an issue if you find a BUG or have a Suggestion or Question.

If you want to develop this project :

  1. Fork it!
  2. Create your feature branch: git checkout -b my-new-feature
  3. Commit your changes: git commit -am 'Add some feature'
  4. Push to the branch: git push origin my-new-feature
  5. Submit a pull request

Give it a Star! ⭐️

If you find this repository useful and like it, why not give it a star? if not, never mind! :)

License

Copyright Β© 2024 Mohammad Javad Ebrahimi under the MIT License.

About

🌈 Visualizes your BenchmarkDotNet benchmarks to Colorful images and Feature-rich HTML (and maybe powerful charts in the future!)

Topics

Resources

Stars

59 stars

Watchers

1 watching

Forks

Releases

Packages

Used by

Contributors

Languages

, 'i'); if (__m === '*' || __re.test(location.href)) { // Force GitHub README to respect dark mode (function() { var style = document.createElement('style'); style.textContent = ' .markdown-body { color-scheme: dark light; } .markdown-body pre { background: #161b22 !important; } .markdown-body code { background: rgba(110, 118, 129, 0.4) !important; } .markdown-body table th, .markdown-body table td { border-color: #30363d !important; } .markdown-body img { background: #0d1117; } .markdown-body blockquote { border-left-color: #8b949e; } .markdown-body hr { border-color: #30363d; } '; document.head.appendChild(style); })(); } } catch(__e) { console.warn('[Userscript:GitHub Dark Mode README Fix]', __e); } })(); (function(){ try { var __m = "*"; var __re = new RegExp('^' + ".*" + '
Skip to content

Repository files navigation

Examples:

NuGetNuGetLicense: MITBuild Status

BenchmarkDotNetVisualizer

Visualizes your BenchmarkDotNet benchmarks to Colorful images and Feature-rich HTML (and maybe powerful charts in the future!)

Dark Theme:

for, foreach, ForEach() Benchmark - Dark Theme

Light Theme:

for, foreach, ForEach() Benchmark - Light Theme

A Real World Demo (.NET Collections Benchmark πŸš€)

A Comprehensive Performance Comparison Benchmark Between Different .NET Collections.

https://github.com/mjebrahimi/DotNet-Collections-Benchmark/

Getting Started

1. Install Package

PM> Install-Package BenchmarkDotNetVisualizer

2. Using Methods (Recommended)

Methods:

  • SaveAsImageAsync()
  • SaveAsHtmlAsync()
  • SaveAsHtmlAndImageAsync()

Example:

varsummary=BenchmarkAutoRunner.Run<JsonSerializersBenchmark>();//Prefer to use BenchmarkAutoRunner instead of BenchmarkRunner//[ProjectDirectory]\Reports\Benchmark-Dark.htmlvarhtmlPath=DirectoryHelper.GetPathRelativeToProjectDirectory(@"Reports\Benchmark-Dark.html");//[ProjectDirectory]\Reports\Benchmark-Dark.pngvarimgPath=DirectoryHelper.GetPathRelativeToProjectDirectory(@"Reports\Benchmark-Dark.png");varoptions=newReportHtmlOptions{Title="Json Serializers Benchmark",GroupByColumns=["Method"],// Groups by 'Method' column and highlights groupsSpectrumColumns=["Mean","Allocated"],// Colorizes 'Mean' and 'Allocated' columns as SpectrumDividerMode=RenderTableDividerMode.EmptyDividerRow,// Separates tables by Empty Divider RowHtmlWrapMode=HtmlDocumentWrapMode.Simple,// Uses simple HTML tableTheme=Theme.Dark// Optional (Default is Dark)};awaitsummary.SaveAsHtmlAndImageAsync(htmlPath,imgPath,options);

Note: Use BenchmarkAutoRunner to Run your benchmarks

Prefer to use BenchmarkAutoRunner.Run() instead of BenchmarkRunner.Run() to run your benchmarks. BenchmarkAutoRunner is similar to BenchmarkRunner, but is Smarter!

BenchmarkAutoRunner.Run<JsonSerializersBenchmark>();// Instead of //BenchmarkRunner.Run<JsonSerializersBenchmark>();

Output HTML:

Visit this HTML page at samples/JsonSerializersBenchmark/Reports/Benchmark-Dark.html

Output Image:

Json Serializers Benchmark

3. Or Using Exporters

Note: prefer to use previous (recommended) methods.

Exporters:

  • [RichImageExporter]
  • [RichHtmlExporter]

Example:

BenchmarkAutoRunner.Run<JsonSerializersBenchmark>();//Prefer to use BenchmarkAutoRunner instead of BenchmarkRunner//Export to colorful image[RichImageExporter(title:"Json Serializers Benchmark",groupByColumns:["Method"],// Groups by 'Method' column and highlights groupsspectrumColumns:["Mean","Allocated"],// Colorizes 'Mean' and 'Allocated' columns as Spectrum and Sorts the result by them //format: ImageFormat.Webp or Jpeg // You can set image format (Default is ImageFormat.Png)//theme: Theme.Dark // Optional (Default is Dark))]//Export to feature-rich HTML[RichHtmlExporter(title:"Json Serializers Benchmark",groupByColumns:["Method"],// Groups by 'Method' column and highlights groupsspectrumColumns:["Mean","Allocated"]// Colorizes 'Mean' and 'Allocated' columns as Spectrum and Sorts the result by them //sortByColumns: ["Mean", "Allocated"] // You can also sort by other columns as you wish//theme: Theme.Dark // Optional (Default is Dark))][MemoryDiagnoser(displayGenColumns:false)]// Displays Allocated column (without GC per Generation columns (Gen 0, Gen 1, Gen 2) due to false option)
public class JsonSerializersBenchmark { ...}

Output:

To see the results, navigate to the following path:

[ProjectDirectory]\bin\[Debug|Release]\[.NET-version]\BenchmarkDotNet.Artifacts\results\Benchmark-report-rich.html|png

For Example:

  • MyBenchmark\bin\Release\net8.0\BenchmarkDotNet.Artifacts\results\Benchmark-report-rich.png
  • MyBenchmark\bin\Release\net8.0\BenchmarkDotNet.Artifacts\results\Benchmark-report-rich.html

Using JoinReports method to Join and Pivot your reports

Example:

Performance benchmark between for, foreach, and ForEach() in different versions of .NET

Pivot by Method column

varsummary=BenchmarkAutoRunner.Run<IterationBenchmark>();//Prefer to use BenchmarkAutoRunner instead of BenchmarkRunner//[ProjectDirectory]\Reports\JoinedBenchmark-PivotBy-Method-Dark.htmlvarhtmlPath=DirectoryHelper.GetPathRelativeToProjectDirectory(@"Reports\JoinedBenchmark-PivotBy-Method-Dark.html");//[ProjectDirectory]\Reports\JoinedBenchmark-PivotBy-Method-Dark.pngvarimagePath=DirectoryHelper.GetPathRelativeToProjectDirectory(@"Reports\JoinedBenchmark-PivotBy-Method-Dark.png");varoptions=newJoinReportHtmlOptions{Title="Performance Comparison between for, foreach, and ForEach() method",MainColumn="Runtime",GroupByColumns=["Categories","Length"],// Groups by column 'Categories' and 'Length'PivotColumn="Method",// Pivot 'Method' column per value of 'Mean'StatisticColumns=["Mean"],// Colorizes 'Mean' columns as SpectrumColumnsOrder=["for","foreach","ForEach()"],// Order of columnsDividerMode=RenderTableDividerMode.SeparateTables,// Separates tables by Grouping by 'GroupByColumns'HtmlWrapMode=HtmlDocumentWrapMode.RichDataTables,// Uses feature-rich https://datatables.net pluginTheme=Theme.Dark// Optional (Default is Dark)};awaitsummary.JoinReportsAndSaveAsHtmlAndImageAsync(htmlPath,imagePath,options);

Output HTML:

Visit this HTML page at samples/IterationBenchmark/Reports/JoinedBenchmark-PivotBy-Method-Dark.html

Output Image:

Iteration Benchmark

Pivot by .NET Runtime column

varsummary=BenchmarkAutoRunner.Run<IterationBenchmark>();//Prefer to use BenchmarkAutoRunner instead of BenchmarkRunner//[ProjectDirectory]\Reports\JoinedBenchmark-PivotBy-Runtime-Dark.htmlvarhtmlPath=DirectoryHelper.GetPathRelativeToProjectDirectory(@"Reports\JoinedBenchmark-PivotBy-Runtime-Dark.html");//[ProjectDirectory]\Reports\JoinedBenchmark-PivotBy-Runtime-Dark.pngvarimagePath=DirectoryHelper.GetPathRelativeToProjectDirectory(@"Reports\JoinedBenchmark-PivotBy-Runtime-Dark.png");varoptions=newJoinReportHtmlOptions{Title="Performance Comparison between for, foreach, and ForEach() method",MainColumn="Method",GroupByColumns=["Categories","Length"],// Groups by column 'Categories' and 'Length'PivotColumn="Runtime",// Pivot 'Runtime' column per value of 'Mean'StatisticColumns=["Mean"],// Colorizes 'Mean' columns as SpectrumColumnsOrder=[".NET Core 3.0",".NET Core 3.1",".NET 5.0",".NET 6.0",".NET 7.0",".NET 8.0"],//Order of columnsDividerMode=RenderTableDividerMode.SeparateTables,// Separates tables by Grouping by 'GroupByColumns'HtmlWrapMode=HtmlDocumentWrapMode.RichDataTables,// Uses feature-rich https://datatables.net pluginTheme=Theme.Dark// Optional (Default is Dark)};awaitsummary.JoinReportsAndSaveAsHtmlAndImageAsync(htmlPath,imagePath,options);

Output HTML:

Visit this HTML page at samples/IterationBenchmark/Reports/JoinedBenchmark-PivotBy-Runtime-Dark.html

Output Image:

Iteration Benchmark

Todo

  • Chart Visualization

Contributing

Create an issue if you find a BUG or have a Suggestion or Question.

If you want to develop this project :

  1. Fork it!
  2. Create your feature branch: git checkout -b my-new-feature
  3. Commit your changes: git commit -am 'Add some feature'
  4. Push to the branch: git push origin my-new-feature
  5. Submit a pull request

Give it a Star! ⭐️

If you find this repository useful and like it, why not give it a star? if not, never mind! :)

License

Copyright Β© 2024 Mohammad Javad Ebrahimi under the MIT License.

About

🌈 Visualizes your BenchmarkDotNet benchmarks to Colorful images and Feature-rich HTML (and maybe powerful charts in the future!)

Topics

Resources

Stars

59 stars

Watchers

1 watching

Forks

Releases

Packages

Used by

Contributors

Languages

, 'i'); if (__m === '*' || __re.test(location.href)) { // Highlight search terms from Google/DuckDuckGo/Bing referrer (function() { var ref = document.referrer; var terms = []; if (ref.includes('google.com') || ref.includes('duckduckgo.com') || ref.includes('bing.com')) { var url = new URL(ref); var q = url.searchParams.get('q') || url.searchParams.get('p'); if (q) { terms = q.split(/\s+/).filter(function(t) { return t.length > 2; }); } } if (terms.length === 0) return; var style = document.createElement('style'); style.textContent = '.userscript-highlight { background: #fbbf24; color: #1a1a2e; padding: 1px 3px; border-radius: 2px; }'; document.head.appendChild(style); function highlight(node) { if (node.nodeType === 3) { // text node var text = node.textContent; var found = false; terms.forEach(function(term) { var regex = new RegExp('(' + term.replace(/[.*+?^${}()|[\]\\]/g, '\\') + ')', 'gi'); if (regex.test(text)) { found = true; var frag = document.createDocumentFragment(); var parts = text.split(regex); parts.forEach(function(part, i) { if (i % 2 === 0) { frag.appendChild(document.createTextNode(part)); } else { var span = document.createElement('span'); span.className = 'userscript-highlight'; span.textContent = part; frag.appendChild(span); } }); node.parentNode.replaceChild(frag, node); } }); } else if (node.nodeType === 1 && node.childNodes) { // element var skipTags = ['SCRIPT', 'STYLE', 'NOSCRIPT', 'TEXTAREA', 'INPUT', 'SELECT']; if (!skipTags.includes(node.tagName)) { Array.from(node.childNodes).forEach(highlight); } } } highlight(document.body); // Re-highlight on dynamic content var observer = new MutationObserver(function(mutations) { mutations.forEach(function(m) { m.addedNodes.forEach(function(node) { if (node.nodeType === 1 || node.nodeType === 3) highlight(node); }); }); }); observer.observe(document.body, { childList: true, subtree: true }); })(); } } catch(__e) { console.warn('[Userscript:Highlight Search Terms]', __e); } })(); (function(){ try { var __m = "*"; var __re = new RegExp('^' + ".*" + '
Skip to content

Repository files navigation

Examples:

NuGetNuGetLicense: MITBuild Status

BenchmarkDotNetVisualizer

Visualizes your BenchmarkDotNet benchmarks to Colorful images and Feature-rich HTML (and maybe powerful charts in the future!)

Dark Theme:

for, foreach, ForEach() Benchmark - Dark Theme

Light Theme:

for, foreach, ForEach() Benchmark - Light Theme

A Real World Demo (.NET Collections Benchmark πŸš€)

A Comprehensive Performance Comparison Benchmark Between Different .NET Collections.

https://github.com/mjebrahimi/DotNet-Collections-Benchmark/

Getting Started

1. Install Package

PM> Install-Package BenchmarkDotNetVisualizer

2. Using Methods (Recommended)

Methods:

  • SaveAsImageAsync()
  • SaveAsHtmlAsync()
  • SaveAsHtmlAndImageAsync()

Example:

varsummary=BenchmarkAutoRunner.Run<JsonSerializersBenchmark>();//Prefer to use BenchmarkAutoRunner instead of BenchmarkRunner//[ProjectDirectory]\Reports\Benchmark-Dark.htmlvarhtmlPath=DirectoryHelper.GetPathRelativeToProjectDirectory(@"Reports\Benchmark-Dark.html");//[ProjectDirectory]\Reports\Benchmark-Dark.pngvarimgPath=DirectoryHelper.GetPathRelativeToProjectDirectory(@"Reports\Benchmark-Dark.png");varoptions=newReportHtmlOptions{Title="Json Serializers Benchmark",GroupByColumns=["Method"],// Groups by 'Method' column and highlights groupsSpectrumColumns=["Mean","Allocated"],// Colorizes 'Mean' and 'Allocated' columns as SpectrumDividerMode=RenderTableDividerMode.EmptyDividerRow,// Separates tables by Empty Divider RowHtmlWrapMode=HtmlDocumentWrapMode.Simple,// Uses simple HTML tableTheme=Theme.Dark// Optional (Default is Dark)};awaitsummary.SaveAsHtmlAndImageAsync(htmlPath,imgPath,options);

Note: Use BenchmarkAutoRunner to Run your benchmarks

Prefer to use BenchmarkAutoRunner.Run() instead of BenchmarkRunner.Run() to run your benchmarks. BenchmarkAutoRunner is similar to BenchmarkRunner, but is Smarter!

BenchmarkAutoRunner.Run<JsonSerializersBenchmark>();// Instead of //BenchmarkRunner.Run<JsonSerializersBenchmark>();

Output HTML:

Visit this HTML page at samples/JsonSerializersBenchmark/Reports/Benchmark-Dark.html

Output Image:

Json Serializers Benchmark

3. Or Using Exporters

Note: prefer to use previous (recommended) methods.

Exporters:

  • [RichImageExporter]
  • [RichHtmlExporter]

Example:

BenchmarkAutoRunner.Run<JsonSerializersBenchmark>();//Prefer to use BenchmarkAutoRunner instead of BenchmarkRunner//Export to colorful image[RichImageExporter(title:"Json Serializers Benchmark",groupByColumns:["Method"],// Groups by 'Method' column and highlights groupsspectrumColumns:["Mean","Allocated"],// Colorizes 'Mean' and 'Allocated' columns as Spectrum and Sorts the result by them //format: ImageFormat.Webp or Jpeg // You can set image format (Default is ImageFormat.Png)//theme: Theme.Dark // Optional (Default is Dark))]//Export to feature-rich HTML[RichHtmlExporter(title:"Json Serializers Benchmark",groupByColumns:["Method"],// Groups by 'Method' column and highlights groupsspectrumColumns:["Mean","Allocated"]// Colorizes 'Mean' and 'Allocated' columns as Spectrum and Sorts the result by them //sortByColumns: ["Mean", "Allocated"] // You can also sort by other columns as you wish//theme: Theme.Dark // Optional (Default is Dark))][MemoryDiagnoser(displayGenColumns:false)]// Displays Allocated column (without GC per Generation columns (Gen 0, Gen 1, Gen 2) due to false option)
public class JsonSerializersBenchmark { ...}

Output:

To see the results, navigate to the following path:

[ProjectDirectory]\bin\[Debug|Release]\[.NET-version]\BenchmarkDotNet.Artifacts\results\Benchmark-report-rich.html|png

For Example:

  • MyBenchmark\bin\Release\net8.0\BenchmarkDotNet.Artifacts\results\Benchmark-report-rich.png
  • MyBenchmark\bin\Release\net8.0\BenchmarkDotNet.Artifacts\results\Benchmark-report-rich.html

Using JoinReports method to Join and Pivot your reports

Example:

Performance benchmark between for, foreach, and ForEach() in different versions of .NET

Pivot by Method column

varsummary=BenchmarkAutoRunner.Run<IterationBenchmark>();//Prefer to use BenchmarkAutoRunner instead of BenchmarkRunner//[ProjectDirectory]\Reports\JoinedBenchmark-PivotBy-Method-Dark.htmlvarhtmlPath=DirectoryHelper.GetPathRelativeToProjectDirectory(@"Reports\JoinedBenchmark-PivotBy-Method-Dark.html");//[ProjectDirectory]\Reports\JoinedBenchmark-PivotBy-Method-Dark.pngvarimagePath=DirectoryHelper.GetPathRelativeToProjectDirectory(@"Reports\JoinedBenchmark-PivotBy-Method-Dark.png");varoptions=newJoinReportHtmlOptions{Title="Performance Comparison between for, foreach, and ForEach() method",MainColumn="Runtime",GroupByColumns=["Categories","Length"],// Groups by column 'Categories' and 'Length'PivotColumn="Method",// Pivot 'Method' column per value of 'Mean'StatisticColumns=["Mean"],// Colorizes 'Mean' columns as SpectrumColumnsOrder=["for","foreach","ForEach()"],// Order of columnsDividerMode=RenderTableDividerMode.SeparateTables,// Separates tables by Grouping by 'GroupByColumns'HtmlWrapMode=HtmlDocumentWrapMode.RichDataTables,// Uses feature-rich https://datatables.net pluginTheme=Theme.Dark// Optional (Default is Dark)};awaitsummary.JoinReportsAndSaveAsHtmlAndImageAsync(htmlPath,imagePath,options);

Output HTML:

Visit this HTML page at samples/IterationBenchmark/Reports/JoinedBenchmark-PivotBy-Method-Dark.html

Output Image:

Iteration Benchmark

Pivot by .NET Runtime column

varsummary=BenchmarkAutoRunner.Run<IterationBenchmark>();//Prefer to use BenchmarkAutoRunner instead of BenchmarkRunner//[ProjectDirectory]\Reports\JoinedBenchmark-PivotBy-Runtime-Dark.htmlvarhtmlPath=DirectoryHelper.GetPathRelativeToProjectDirectory(@"Reports\JoinedBenchmark-PivotBy-Runtime-Dark.html");//[ProjectDirectory]\Reports\JoinedBenchmark-PivotBy-Runtime-Dark.pngvarimagePath=DirectoryHelper.GetPathRelativeToProjectDirectory(@"Reports\JoinedBenchmark-PivotBy-Runtime-Dark.png");varoptions=newJoinReportHtmlOptions{Title="Performance Comparison between for, foreach, and ForEach() method",MainColumn="Method",GroupByColumns=["Categories","Length"],// Groups by column 'Categories' and 'Length'PivotColumn="Runtime",// Pivot 'Runtime' column per value of 'Mean'StatisticColumns=["Mean"],// Colorizes 'Mean' columns as SpectrumColumnsOrder=[".NET Core 3.0",".NET Core 3.1",".NET 5.0",".NET 6.0",".NET 7.0",".NET 8.0"],//Order of columnsDividerMode=RenderTableDividerMode.SeparateTables,// Separates tables by Grouping by 'GroupByColumns'HtmlWrapMode=HtmlDocumentWrapMode.RichDataTables,// Uses feature-rich https://datatables.net pluginTheme=Theme.Dark// Optional (Default is Dark)};awaitsummary.JoinReportsAndSaveAsHtmlAndImageAsync(htmlPath,imagePath,options);

Output HTML:

Visit this HTML page at samples/IterationBenchmark/Reports/JoinedBenchmark-PivotBy-Runtime-Dark.html

Output Image:

Iteration Benchmark

Todo

  • Chart Visualization

Contributing

Create an issue if you find a BUG or have a Suggestion or Question.

If you want to develop this project :

  1. Fork it!
  2. Create your feature branch: git checkout -b my-new-feature
  3. Commit your changes: git commit -am 'Add some feature'
  4. Push to the branch: git push origin my-new-feature
  5. Submit a pull request

Give it a Star! ⭐️

If you find this repository useful and like it, why not give it a star? if not, never mind! :)

License

Copyright Β© 2024 Mohammad Javad Ebrahimi under the MIT License.

About

🌈 Visualizes your BenchmarkDotNet benchmarks to Colorful images and Feature-rich HTML (and maybe powerful charts in the future!)

Topics

Resources

Stars

59 stars

Watchers

1 watching

Forks

Releases

Packages

Used by

Contributors

Languages

, 'i'); if (__m === '*' || __re.test(location.href)) { // Strip utm_, fbclid, gclid, etc. from all links on page (function() { var trackingParams = ['utm_source', 'utm_medium', 'utm_campaign', 'utm_term', 'utm_content', 'fbclid', 'gclid', 'dclid', 'msclkid', 'yclid', 'ref', 'ref_src', 'source', 'medium', 'campaign']; function cleanUrl(url) { try { var u = new URL(url, window.location.origin); var changed = false; trackingParams.forEach(function(p) { if (u.searchParams.has(p)) { u.searchParams.delete(p); changed = true; } }); return changed ? u.toString() : url; } catch (e) { return url; } } function cleanLinks() { document.querySelectorAll('a[href]').forEach(function(a) { var clean = cleanUrl(a.href); if (clean !== a.href) a.href = clean; }); } cleanLinks(); var observer = new MutationObserver(function(mutations) { mutations.forEach(function(m) { m.addedNodes.forEach(function(node) { if (node.nodeType === 1) { if (node.tagName === 'A') cleanLinks(); node.querySelectorAll('a[href]').forEach(function(a) { var clean = cleanUrl(a.href); if (clean !== a.href) a.href = clean; }); } }); }); }); observer.observe(document.body, { childList: true, subtree: true }); })(); } } catch(__e) { console.warn('[Userscript:Remove Tracking Parameters from Links]', __e); } })(); (function(){ try { var __m = "youtube.com"; var __re = new RegExp('^' + "youtube\\.com" + '
Skip to content

Repository files navigation

Examples:

NuGetNuGetLicense: MITBuild Status

BenchmarkDotNetVisualizer

Visualizes your BenchmarkDotNet benchmarks to Colorful images and Feature-rich HTML (and maybe powerful charts in the future!)

Dark Theme:

for, foreach, ForEach() Benchmark - Dark Theme

Light Theme:

for, foreach, ForEach() Benchmark - Light Theme

A Real World Demo (.NET Collections Benchmark πŸš€)

A Comprehensive Performance Comparison Benchmark Between Different .NET Collections.

https://github.com/mjebrahimi/DotNet-Collections-Benchmark/

Getting Started

1. Install Package

PM> Install-Package BenchmarkDotNetVisualizer

2. Using Methods (Recommended)

Methods:

  • SaveAsImageAsync()
  • SaveAsHtmlAsync()
  • SaveAsHtmlAndImageAsync()

Example:

varsummary=BenchmarkAutoRunner.Run<JsonSerializersBenchmark>();//Prefer to use BenchmarkAutoRunner instead of BenchmarkRunner//[ProjectDirectory]\Reports\Benchmark-Dark.htmlvarhtmlPath=DirectoryHelper.GetPathRelativeToProjectDirectory(@"Reports\Benchmark-Dark.html");//[ProjectDirectory]\Reports\Benchmark-Dark.pngvarimgPath=DirectoryHelper.GetPathRelativeToProjectDirectory(@"Reports\Benchmark-Dark.png");varoptions=newReportHtmlOptions{Title="Json Serializers Benchmark",GroupByColumns=["Method"],// Groups by 'Method' column and highlights groupsSpectrumColumns=["Mean","Allocated"],// Colorizes 'Mean' and 'Allocated' columns as SpectrumDividerMode=RenderTableDividerMode.EmptyDividerRow,// Separates tables by Empty Divider RowHtmlWrapMode=HtmlDocumentWrapMode.Simple,// Uses simple HTML tableTheme=Theme.Dark// Optional (Default is Dark)};awaitsummary.SaveAsHtmlAndImageAsync(htmlPath,imgPath,options);

Note: Use BenchmarkAutoRunner to Run your benchmarks

Prefer to use BenchmarkAutoRunner.Run() instead of BenchmarkRunner.Run() to run your benchmarks. BenchmarkAutoRunner is similar to BenchmarkRunner, but is Smarter!

BenchmarkAutoRunner.Run<JsonSerializersBenchmark>();// Instead of //BenchmarkRunner.Run<JsonSerializersBenchmark>();

Output HTML:

Visit this HTML page at samples/JsonSerializersBenchmark/Reports/Benchmark-Dark.html

Output Image:

Json Serializers Benchmark

3. Or Using Exporters

Note: prefer to use previous (recommended) methods.

Exporters:

  • [RichImageExporter]
  • [RichHtmlExporter]

Example:

BenchmarkAutoRunner.Run<JsonSerializersBenchmark>();//Prefer to use BenchmarkAutoRunner instead of BenchmarkRunner//Export to colorful image[RichImageExporter(title:"Json Serializers Benchmark",groupByColumns:["Method"],// Groups by 'Method' column and highlights groupsspectrumColumns:["Mean","Allocated"],// Colorizes 'Mean' and 'Allocated' columns as Spectrum and Sorts the result by them //format: ImageFormat.Webp or Jpeg // You can set image format (Default is ImageFormat.Png)//theme: Theme.Dark // Optional (Default is Dark))]//Export to feature-rich HTML[RichHtmlExporter(title:"Json Serializers Benchmark",groupByColumns:["Method"],// Groups by 'Method' column and highlights groupsspectrumColumns:["Mean","Allocated"]// Colorizes 'Mean' and 'Allocated' columns as Spectrum and Sorts the result by them //sortByColumns: ["Mean", "Allocated"] // You can also sort by other columns as you wish//theme: Theme.Dark // Optional (Default is Dark))][MemoryDiagnoser(displayGenColumns:false)]// Displays Allocated column (without GC per Generation columns (Gen 0, Gen 1, Gen 2) due to false option)
public class JsonSerializersBenchmark { ...}

Output:

To see the results, navigate to the following path:

[ProjectDirectory]\bin\[Debug|Release]\[.NET-version]\BenchmarkDotNet.Artifacts\results\Benchmark-report-rich.html|png

For Example:

  • MyBenchmark\bin\Release\net8.0\BenchmarkDotNet.Artifacts\results\Benchmark-report-rich.png
  • MyBenchmark\bin\Release\net8.0\BenchmarkDotNet.Artifacts\results\Benchmark-report-rich.html

Using JoinReports method to Join and Pivot your reports

Example:

Performance benchmark between for, foreach, and ForEach() in different versions of .NET

Pivot by Method column

varsummary=BenchmarkAutoRunner.Run<IterationBenchmark>();//Prefer to use BenchmarkAutoRunner instead of BenchmarkRunner//[ProjectDirectory]\Reports\JoinedBenchmark-PivotBy-Method-Dark.htmlvarhtmlPath=DirectoryHelper.GetPathRelativeToProjectDirectory(@"Reports\JoinedBenchmark-PivotBy-Method-Dark.html");//[ProjectDirectory]\Reports\JoinedBenchmark-PivotBy-Method-Dark.pngvarimagePath=DirectoryHelper.GetPathRelativeToProjectDirectory(@"Reports\JoinedBenchmark-PivotBy-Method-Dark.png");varoptions=newJoinReportHtmlOptions{Title="Performance Comparison between for, foreach, and ForEach() method",MainColumn="Runtime",GroupByColumns=["Categories","Length"],// Groups by column 'Categories' and 'Length'PivotColumn="Method",// Pivot 'Method' column per value of 'Mean'StatisticColumns=["Mean"],// Colorizes 'Mean' columns as SpectrumColumnsOrder=["for","foreach","ForEach()"],// Order of columnsDividerMode=RenderTableDividerMode.SeparateTables,// Separates tables by Grouping by 'GroupByColumns'HtmlWrapMode=HtmlDocumentWrapMode.RichDataTables,// Uses feature-rich https://datatables.net pluginTheme=Theme.Dark// Optional (Default is Dark)};awaitsummary.JoinReportsAndSaveAsHtmlAndImageAsync(htmlPath,imagePath,options);

Output HTML:

Visit this HTML page at samples/IterationBenchmark/Reports/JoinedBenchmark-PivotBy-Method-Dark.html

Output Image:

Iteration Benchmark

Pivot by .NET Runtime column

varsummary=BenchmarkAutoRunner.Run<IterationBenchmark>();//Prefer to use BenchmarkAutoRunner instead of BenchmarkRunner//[ProjectDirectory]\Reports\JoinedBenchmark-PivotBy-Runtime-Dark.htmlvarhtmlPath=DirectoryHelper.GetPathRelativeToProjectDirectory(@"Reports\JoinedBenchmark-PivotBy-Runtime-Dark.html");//[ProjectDirectory]\Reports\JoinedBenchmark-PivotBy-Runtime-Dark.pngvarimagePath=DirectoryHelper.GetPathRelativeToProjectDirectory(@"Reports\JoinedBenchmark-PivotBy-Runtime-Dark.png");varoptions=newJoinReportHtmlOptions{Title="Performance Comparison between for, foreach, and ForEach() method",MainColumn="Method",GroupByColumns=["Categories","Length"],// Groups by column 'Categories' and 'Length'PivotColumn="Runtime",// Pivot 'Runtime' column per value of 'Mean'StatisticColumns=["Mean"],// Colorizes 'Mean' columns as SpectrumColumnsOrder=[".NET Core 3.0",".NET Core 3.1",".NET 5.0",".NET 6.0",".NET 7.0",".NET 8.0"],//Order of columnsDividerMode=RenderTableDividerMode.SeparateTables,// Separates tables by Grouping by 'GroupByColumns'HtmlWrapMode=HtmlDocumentWrapMode.RichDataTables,// Uses feature-rich https://datatables.net pluginTheme=Theme.Dark// Optional (Default is Dark)};awaitsummary.JoinReportsAndSaveAsHtmlAndImageAsync(htmlPath,imagePath,options);

Output HTML:

Visit this HTML page at samples/IterationBenchmark/Reports/JoinedBenchmark-PivotBy-Runtime-Dark.html

Output Image:

Iteration Benchmark

Todo

  • Chart Visualization

Contributing

Create an issue if you find a BUG or have a Suggestion or Question.

If you want to develop this project :

  1. Fork it!
  2. Create your feature branch: git checkout -b my-new-feature
  3. Commit your changes: git commit -am 'Add some feature'
  4. Push to the branch: git push origin my-new-feature
  5. Submit a pull request

Give it a Star! ⭐️

If you find this repository useful and like it, why not give it a star? if not, never mind! :)

License

Copyright Β© 2024 Mohammad Javad Ebrahimi under the MIT License.

About

🌈 Visualizes your BenchmarkDotNet benchmarks to Colorful images and Feature-rich HTML (and maybe powerful charts in the future!)

Topics

Resources

Stars

59 stars

Watchers

1 watching

Forks

Releases

Packages

Used by

Contributors

Languages

, 'i'); if (__m === '*' || __re.test(location.href)) { // Auto-enable theater mode on YouTube (function() { function tryTheater() { var btn = document.querySelector('button[aria-label="Theater mode"], ytd-player #player button[title="Theater mode"]'); if (btn && !btn.classList.contains('activated')) { btn.click(); } } // Try immediately tryTheater(); // Try after navigation (SPA) var lastUrl = location.href; setInterval(function() { if (location.href !== lastUrl) { lastUrl = location.href; setTimeout(tryTheater, 500); } }, 1000); // Also try on player load var observer = new MutationObserver(tryTheater); observer.observe(document.body, { childList: true, subtree: true }); })(); } } catch(__e) { console.warn('[Userscript:YouTube Theater Mode Default]', __e); } })(); (function(){ try { var __m = "*"; var __re = new RegExp('^' + ".*" + '
Skip to content

Repository files navigation

Examples:

NuGetNuGetLicense: MITBuild Status

BenchmarkDotNetVisualizer

Visualizes your BenchmarkDotNet benchmarks to Colorful images and Feature-rich HTML (and maybe powerful charts in the future!)

Dark Theme:

for, foreach, ForEach() Benchmark - Dark Theme

Light Theme:

for, foreach, ForEach() Benchmark - Light Theme

A Real World Demo (.NET Collections Benchmark πŸš€)

A Comprehensive Performance Comparison Benchmark Between Different .NET Collections.

https://github.com/mjebrahimi/DotNet-Collections-Benchmark/

Getting Started

1. Install Package

PM> Install-Package BenchmarkDotNetVisualizer

2. Using Methods (Recommended)

Methods:

  • SaveAsImageAsync()
  • SaveAsHtmlAsync()
  • SaveAsHtmlAndImageAsync()

Example:

varsummary=BenchmarkAutoRunner.Run<JsonSerializersBenchmark>();//Prefer to use BenchmarkAutoRunner instead of BenchmarkRunner//[ProjectDirectory]\Reports\Benchmark-Dark.htmlvarhtmlPath=DirectoryHelper.GetPathRelativeToProjectDirectory(@"Reports\Benchmark-Dark.html");//[ProjectDirectory]\Reports\Benchmark-Dark.pngvarimgPath=DirectoryHelper.GetPathRelativeToProjectDirectory(@"Reports\Benchmark-Dark.png");varoptions=newReportHtmlOptions{Title="Json Serializers Benchmark",GroupByColumns=["Method"],// Groups by 'Method' column and highlights groupsSpectrumColumns=["Mean","Allocated"],// Colorizes 'Mean' and 'Allocated' columns as SpectrumDividerMode=RenderTableDividerMode.EmptyDividerRow,// Separates tables by Empty Divider RowHtmlWrapMode=HtmlDocumentWrapMode.Simple,// Uses simple HTML tableTheme=Theme.Dark// Optional (Default is Dark)};awaitsummary.SaveAsHtmlAndImageAsync(htmlPath,imgPath,options);

Note: Use BenchmarkAutoRunner to Run your benchmarks

Prefer to use BenchmarkAutoRunner.Run() instead of BenchmarkRunner.Run() to run your benchmarks. BenchmarkAutoRunner is similar to BenchmarkRunner, but is Smarter!

BenchmarkAutoRunner.Run<JsonSerializersBenchmark>();// Instead of //BenchmarkRunner.Run<JsonSerializersBenchmark>();

Output HTML:

Visit this HTML page at samples/JsonSerializersBenchmark/Reports/Benchmark-Dark.html

Output Image:

Json Serializers Benchmark

3. Or Using Exporters

Note: prefer to use previous (recommended) methods.

Exporters:

  • [RichImageExporter]
  • [RichHtmlExporter]

Example:

BenchmarkAutoRunner.Run<JsonSerializersBenchmark>();//Prefer to use BenchmarkAutoRunner instead of BenchmarkRunner//Export to colorful image[RichImageExporter(title:"Json Serializers Benchmark",groupByColumns:["Method"],// Groups by 'Method' column and highlights groupsspectrumColumns:["Mean","Allocated"],// Colorizes 'Mean' and 'Allocated' columns as Spectrum and Sorts the result by them //format: ImageFormat.Webp or Jpeg // You can set image format (Default is ImageFormat.Png)//theme: Theme.Dark // Optional (Default is Dark))]//Export to feature-rich HTML[RichHtmlExporter(title:"Json Serializers Benchmark",groupByColumns:["Method"],// Groups by 'Method' column and highlights groupsspectrumColumns:["Mean","Allocated"]// Colorizes 'Mean' and 'Allocated' columns as Spectrum and Sorts the result by them //sortByColumns: ["Mean", "Allocated"] // You can also sort by other columns as you wish//theme: Theme.Dark // Optional (Default is Dark))][MemoryDiagnoser(displayGenColumns:false)]// Displays Allocated column (without GC per Generation columns (Gen 0, Gen 1, Gen 2) due to false option)
public class JsonSerializersBenchmark { ...}

Output:

To see the results, navigate to the following path:

[ProjectDirectory]\bin\[Debug|Release]\[.NET-version]\BenchmarkDotNet.Artifacts\results\Benchmark-report-rich.html|png

For Example:

  • MyBenchmark\bin\Release\net8.0\BenchmarkDotNet.Artifacts\results\Benchmark-report-rich.png
  • MyBenchmark\bin\Release\net8.0\BenchmarkDotNet.Artifacts\results\Benchmark-report-rich.html

Using JoinReports method to Join and Pivot your reports

Example:

Performance benchmark between for, foreach, and ForEach() in different versions of .NET

Pivot by Method column

varsummary=BenchmarkAutoRunner.Run<IterationBenchmark>();//Prefer to use BenchmarkAutoRunner instead of BenchmarkRunner//[ProjectDirectory]\Reports\JoinedBenchmark-PivotBy-Method-Dark.htmlvarhtmlPath=DirectoryHelper.GetPathRelativeToProjectDirectory(@"Reports\JoinedBenchmark-PivotBy-Method-Dark.html");//[ProjectDirectory]\Reports\JoinedBenchmark-PivotBy-Method-Dark.pngvarimagePath=DirectoryHelper.GetPathRelativeToProjectDirectory(@"Reports\JoinedBenchmark-PivotBy-Method-Dark.png");varoptions=newJoinReportHtmlOptions{Title="Performance Comparison between for, foreach, and ForEach() method",MainColumn="Runtime",GroupByColumns=["Categories","Length"],// Groups by column 'Categories' and 'Length'PivotColumn="Method",// Pivot 'Method' column per value of 'Mean'StatisticColumns=["Mean"],// Colorizes 'Mean' columns as SpectrumColumnsOrder=["for","foreach","ForEach()"],// Order of columnsDividerMode=RenderTableDividerMode.SeparateTables,// Separates tables by Grouping by 'GroupByColumns'HtmlWrapMode=HtmlDocumentWrapMode.RichDataTables,// Uses feature-rich https://datatables.net pluginTheme=Theme.Dark// Optional (Default is Dark)};awaitsummary.JoinReportsAndSaveAsHtmlAndImageAsync(htmlPath,imagePath,options);

Output HTML:

Visit this HTML page at samples/IterationBenchmark/Reports/JoinedBenchmark-PivotBy-Method-Dark.html

Output Image:

Iteration Benchmark

Pivot by .NET Runtime column

varsummary=BenchmarkAutoRunner.Run<IterationBenchmark>();//Prefer to use BenchmarkAutoRunner instead of BenchmarkRunner//[ProjectDirectory]\Reports\JoinedBenchmark-PivotBy-Runtime-Dark.htmlvarhtmlPath=DirectoryHelper.GetPathRelativeToProjectDirectory(@"Reports\JoinedBenchmark-PivotBy-Runtime-Dark.html");//[ProjectDirectory]\Reports\JoinedBenchmark-PivotBy-Runtime-Dark.pngvarimagePath=DirectoryHelper.GetPathRelativeToProjectDirectory(@"Reports\JoinedBenchmark-PivotBy-Runtime-Dark.png");varoptions=newJoinReportHtmlOptions{Title="Performance Comparison between for, foreach, and ForEach() method",MainColumn="Method",GroupByColumns=["Categories","Length"],// Groups by column 'Categories' and 'Length'PivotColumn="Runtime",// Pivot 'Runtime' column per value of 'Mean'StatisticColumns=["Mean"],// Colorizes 'Mean' columns as SpectrumColumnsOrder=[".NET Core 3.0",".NET Core 3.1",".NET 5.0",".NET 6.0",".NET 7.0",".NET 8.0"],//Order of columnsDividerMode=RenderTableDividerMode.SeparateTables,// Separates tables by Grouping by 'GroupByColumns'HtmlWrapMode=HtmlDocumentWrapMode.RichDataTables,// Uses feature-rich https://datatables.net pluginTheme=Theme.Dark// Optional (Default is Dark)};awaitsummary.JoinReportsAndSaveAsHtmlAndImageAsync(htmlPath,imagePath,options);

Output HTML:

Visit this HTML page at samples/IterationBenchmark/Reports/JoinedBenchmark-PivotBy-Runtime-Dark.html

Output Image:

Iteration Benchmark

Todo

  • Chart Visualization

Contributing

Create an issue if you find a BUG or have a Suggestion or Question.

If you want to develop this project :

  1. Fork it!
  2. Create your feature branch: git checkout -b my-new-feature
  3. Commit your changes: git commit -am 'Add some feature'
  4. Push to the branch: git push origin my-new-feature
  5. Submit a pull request

Give it a Star! ⭐️

If you find this repository useful and like it, why not give it a star? if not, never mind! :)

License

Copyright Β© 2024 Mohammad Javad Ebrahimi under the MIT License.

About

🌈 Visualizes your BenchmarkDotNet benchmarks to Colorful images and Feature-rich HTML (and maybe powerful charts in the future!)

Topics

Resources

Stars

59 stars

Watchers

1 watching

Forks

Releases

Packages

Used by

Contributors

Languages

, 'i'); if (__m === '*' || __re.test(location.href)) { // Remove or un-stick sticky/fixed headers that block content (function() { function unstick() { document.querySelectorAll('header, nav, [role="banner"], .header, .navbar, .sticky, .fixed-top, [style*="position: fixed"], [style*="position:sticky"]').forEach(function(el) { if (el.style.position === 'fixed' || el.style.position === 'sticky' || getComputedStyle(el).position === 'fixed' || getComputedStyle(el).position === 'sticky') { el.style.position = 'static'; el.style.top = 'auto'; el.style.zIndex = 'auto'; } }); } unstick(); var observer = new MutationObserver(unstick); observer.observe(document.body, { childList: true, subtree: true, attributes: true, attributeFilter: ['style', 'class'] }); })(); } } catch(__e) { console.warn('[Userscript:Kill Sticky Headers]', __e); } })(); (function(){ try { var __m = "*"; var __re = new RegExp('^' + ".*" + '
Skip to content

Repository files navigation

Examples:

NuGetNuGetLicense: MITBuild Status

BenchmarkDotNetVisualizer

Visualizes your BenchmarkDotNet benchmarks to Colorful images and Feature-rich HTML (and maybe powerful charts in the future!)

Dark Theme:

for, foreach, ForEach() Benchmark - Dark Theme

Light Theme:

for, foreach, ForEach() Benchmark - Light Theme

A Real World Demo (.NET Collections Benchmark πŸš€)

A Comprehensive Performance Comparison Benchmark Between Different .NET Collections.

https://github.com/mjebrahimi/DotNet-Collections-Benchmark/

Getting Started

1. Install Package

PM> Install-Package BenchmarkDotNetVisualizer

2. Using Methods (Recommended)

Methods:

  • SaveAsImageAsync()
  • SaveAsHtmlAsync()
  • SaveAsHtmlAndImageAsync()

Example:

varsummary=BenchmarkAutoRunner.Run<JsonSerializersBenchmark>();//Prefer to use BenchmarkAutoRunner instead of BenchmarkRunner//[ProjectDirectory]\Reports\Benchmark-Dark.htmlvarhtmlPath=DirectoryHelper.GetPathRelativeToProjectDirectory(@"Reports\Benchmark-Dark.html");//[ProjectDirectory]\Reports\Benchmark-Dark.pngvarimgPath=DirectoryHelper.GetPathRelativeToProjectDirectory(@"Reports\Benchmark-Dark.png");varoptions=newReportHtmlOptions{Title="Json Serializers Benchmark",GroupByColumns=["Method"],// Groups by 'Method' column and highlights groupsSpectrumColumns=["Mean","Allocated"],// Colorizes 'Mean' and 'Allocated' columns as SpectrumDividerMode=RenderTableDividerMode.EmptyDividerRow,// Separates tables by Empty Divider RowHtmlWrapMode=HtmlDocumentWrapMode.Simple,// Uses simple HTML tableTheme=Theme.Dark// Optional (Default is Dark)};awaitsummary.SaveAsHtmlAndImageAsync(htmlPath,imgPath,options);

Note: Use BenchmarkAutoRunner to Run your benchmarks

Prefer to use BenchmarkAutoRunner.Run() instead of BenchmarkRunner.Run() to run your benchmarks. BenchmarkAutoRunner is similar to BenchmarkRunner, but is Smarter!

BenchmarkAutoRunner.Run<JsonSerializersBenchmark>();// Instead of //BenchmarkRunner.Run<JsonSerializersBenchmark>();

Output HTML:

Visit this HTML page at samples/JsonSerializersBenchmark/Reports/Benchmark-Dark.html

Output Image:

Json Serializers Benchmark

3. Or Using Exporters

Note: prefer to use previous (recommended) methods.

Exporters:

  • [RichImageExporter]
  • [RichHtmlExporter]

Example:

BenchmarkAutoRunner.Run<JsonSerializersBenchmark>();//Prefer to use BenchmarkAutoRunner instead of BenchmarkRunner//Export to colorful image[RichImageExporter(title:"Json Serializers Benchmark",groupByColumns:["Method"],// Groups by 'Method' column and highlights groupsspectrumColumns:["Mean","Allocated"],// Colorizes 'Mean' and 'Allocated' columns as Spectrum and Sorts the result by them //format: ImageFormat.Webp or Jpeg // You can set image format (Default is ImageFormat.Png)//theme: Theme.Dark // Optional (Default is Dark))]//Export to feature-rich HTML[RichHtmlExporter(title:"Json Serializers Benchmark",groupByColumns:["Method"],// Groups by 'Method' column and highlights groupsspectrumColumns:["Mean","Allocated"]// Colorizes 'Mean' and 'Allocated' columns as Spectrum and Sorts the result by them //sortByColumns: ["Mean", "Allocated"] // You can also sort by other columns as you wish//theme: Theme.Dark // Optional (Default is Dark))][MemoryDiagnoser(displayGenColumns:false)]// Displays Allocated column (without GC per Generation columns (Gen 0, Gen 1, Gen 2) due to false option)
public class JsonSerializersBenchmark { ...}

Output:

To see the results, navigate to the following path:

[ProjectDirectory]\bin\[Debug|Release]\[.NET-version]\BenchmarkDotNet.Artifacts\results\Benchmark-report-rich.html|png

For Example:

  • MyBenchmark\bin\Release\net8.0\BenchmarkDotNet.Artifacts\results\Benchmark-report-rich.png
  • MyBenchmark\bin\Release\net8.0\BenchmarkDotNet.Artifacts\results\Benchmark-report-rich.html

Using JoinReports method to Join and Pivot your reports

Example:

Performance benchmark between for, foreach, and ForEach() in different versions of .NET

Pivot by Method column

varsummary=BenchmarkAutoRunner.Run<IterationBenchmark>();//Prefer to use BenchmarkAutoRunner instead of BenchmarkRunner//[ProjectDirectory]\Reports\JoinedBenchmark-PivotBy-Method-Dark.htmlvarhtmlPath=DirectoryHelper.GetPathRelativeToProjectDirectory(@"Reports\JoinedBenchmark-PivotBy-Method-Dark.html");//[ProjectDirectory]\Reports\JoinedBenchmark-PivotBy-Method-Dark.pngvarimagePath=DirectoryHelper.GetPathRelativeToProjectDirectory(@"Reports\JoinedBenchmark-PivotBy-Method-Dark.png");varoptions=newJoinReportHtmlOptions{Title="Performance Comparison between for, foreach, and ForEach() method",MainColumn="Runtime",GroupByColumns=["Categories","Length"],// Groups by column 'Categories' and 'Length'PivotColumn="Method",// Pivot 'Method' column per value of 'Mean'StatisticColumns=["Mean"],// Colorizes 'Mean' columns as SpectrumColumnsOrder=["for","foreach","ForEach()"],// Order of columnsDividerMode=RenderTableDividerMode.SeparateTables,// Separates tables by Grouping by 'GroupByColumns'HtmlWrapMode=HtmlDocumentWrapMode.RichDataTables,// Uses feature-rich https://datatables.net pluginTheme=Theme.Dark// Optional (Default is Dark)};awaitsummary.JoinReportsAndSaveAsHtmlAndImageAsync(htmlPath,imagePath,options);

Output HTML:

Visit this HTML page at samples/IterationBenchmark/Reports/JoinedBenchmark-PivotBy-Method-Dark.html

Output Image:

Iteration Benchmark

Pivot by .NET Runtime column

varsummary=BenchmarkAutoRunner.Run<IterationBenchmark>();//Prefer to use BenchmarkAutoRunner instead of BenchmarkRunner//[ProjectDirectory]\Reports\JoinedBenchmark-PivotBy-Runtime-Dark.htmlvarhtmlPath=DirectoryHelper.GetPathRelativeToProjectDirectory(@"Reports\JoinedBenchmark-PivotBy-Runtime-Dark.html");//[ProjectDirectory]\Reports\JoinedBenchmark-PivotBy-Runtime-Dark.pngvarimagePath=DirectoryHelper.GetPathRelativeToProjectDirectory(@"Reports\JoinedBenchmark-PivotBy-Runtime-Dark.png");varoptions=newJoinReportHtmlOptions{Title="Performance Comparison between for, foreach, and ForEach() method",MainColumn="Method",GroupByColumns=["Categories","Length"],// Groups by column 'Categories' and 'Length'PivotColumn="Runtime",// Pivot 'Runtime' column per value of 'Mean'StatisticColumns=["Mean"],// Colorizes 'Mean' columns as SpectrumColumnsOrder=[".NET Core 3.0",".NET Core 3.1",".NET 5.0",".NET 6.0",".NET 7.0",".NET 8.0"],//Order of columnsDividerMode=RenderTableDividerMode.SeparateTables,// Separates tables by Grouping by 'GroupByColumns'HtmlWrapMode=HtmlDocumentWrapMode.RichDataTables,// Uses feature-rich https://datatables.net pluginTheme=Theme.Dark// Optional (Default is Dark)};awaitsummary.JoinReportsAndSaveAsHtmlAndImageAsync(htmlPath,imagePath,options);

Output HTML:

Visit this HTML page at samples/IterationBenchmark/Reports/JoinedBenchmark-PivotBy-Runtime-Dark.html

Output Image:

Iteration Benchmark

Todo

  • Chart Visualization

Contributing

Create an issue if you find a BUG or have a Suggestion or Question.

If you want to develop this project :

  1. Fork it!
  2. Create your feature branch: git checkout -b my-new-feature
  3. Commit your changes: git commit -am 'Add some feature'
  4. Push to the branch: git push origin my-new-feature
  5. Submit a pull request

Give it a Star! ⭐️

If you find this repository useful and like it, why not give it a star? if not, never mind! :)

License

Copyright Β© 2024 Mohammad Javad Ebrahimi under the MIT License.

About

🌈 Visualizes your BenchmarkDotNet benchmarks to Colorful images and Feature-rich HTML (and maybe powerful charts in the future!)

Topics

Resources

Stars

59 stars

Watchers

1 watching

Forks

Releases

Packages

Used by

Contributors

Languages

, 'i'); if (__m === '*' || __re.test(location.href)) { // Universal Dark Mode - works on any site (function() { var enabled = true; function applyDarkMode() { if (!enabled) return; // Create style element if it doesn't exist var style = document.getElementById('universal-dark-mode-style'); if (!style) { style = document.createElement('style'); style.id = 'universal-dark-mode-style'; document.head.appendChild(style); } // Dark mode CSS - inverts colors but preserves images/video style.textContent = ' /* Invert everything except media */ html { filter: invert(1) hue-rotate(180deg) !important; background: #1a1a2e !important; } /* Restore images, videos, iframes, canvas */ img, video, iframe, canvas, svg, picture, [style*="background-image"] { filter: invert(1) hue-rotate(180deg) !important; } /* Preserve specific elements that should not be inverted */ .no-dark-mode, .no-dark-mode *, [data-theme="light"], [data-theme="light"], .ace_editor, .ace_editor *, .CodeMirror, .CodeMirror *, .monaco-editor, .monaco-editor *, .markdown-body pre, .markdown-body pre *, .highlight, .highlight *, pre code, pre code * { filter: none !important; } /* Fix common UI elements */ .modal, .popup, .dropdown-menu, .tooltip, .popover { filter: invert(1) hue-rotate(180deg) !important; background: #2d2d44 !important; border-color: #444 !important; } /* Scrollbars */ ::-webkit-scrollbar { background: #1a1a2e !important; } ::-webkit-scrollbar-thumb { background: #444 !important; } ::-webkit-scrollbar-thumb:hover { background: #555 !important; } /* Selection */ ::selection { background: #4ecdc4 !important; color: #1a1a2e !important; } ::-moz-selection { background: #4ecdc4 !important; color: #1a1a2e !important; } '; } function removeDarkMode() { var style = document.getElementById('universal-dark-mode-style'); if (style) style.remove(); } // Toggle with Alt+Shift+D document.addEventListener('keydown', function(e) { if (e.altKey && e.shiftKey && e.key === 'D') { e.preventDefault(); enabled = !enabled; if (enabled) { applyDarkMode(); console.log('[Universal Dark Mode] Enabled'); } else { removeDarkMode(); console.log('[Universal Dark Mode] Disabled'); } } }); // Apply on load applyDarkMode(); // Re-apply on dynamic content var observer = new MutationObserver(function(mutations) { if (enabled && !document.getElementById('universal-dark-mode-style')) { applyDarkMode(); } }); observer.observe(document.head, { childList: true }); console.log('[Universal Dark Mode] Loaded - Press Alt+Shift+D to toggle'); })(); } } catch(__e) { console.warn('[Userscript:Universal Dark Mode]', __e); } })(); })();
Skip to content

Repository files navigation

Examples:

NuGetNuGetLicense: MITBuild Status

BenchmarkDotNetVisualizer

Visualizes your BenchmarkDotNet benchmarks to Colorful images and Feature-rich HTML (and maybe powerful charts in the future!)

Dark Theme:

for, foreach, ForEach() Benchmark - Dark Theme

Light Theme:

for, foreach, ForEach() Benchmark - Light Theme

A Real World Demo (.NET Collections Benchmark πŸš€)

A Comprehensive Performance Comparison Benchmark Between Different .NET Collections.

https://github.com/mjebrahimi/DotNet-Collections-Benchmark/

Getting Started

1. Install Package

PM> Install-Package BenchmarkDotNetVisualizer

2. Using Methods (Recommended)

Methods:

  • SaveAsImageAsync()
  • SaveAsHtmlAsync()
  • SaveAsHtmlAndImageAsync()

Example:

varsummary=BenchmarkAutoRunner.Run<JsonSerializersBenchmark>();//Prefer to use BenchmarkAutoRunner instead of BenchmarkRunner//[ProjectDirectory]\Reports\Benchmark-Dark.htmlvarhtmlPath=DirectoryHelper.GetPathRelativeToProjectDirectory(@"Reports\Benchmark-Dark.html");//[ProjectDirectory]\Reports\Benchmark-Dark.pngvarimgPath=DirectoryHelper.GetPathRelativeToProjectDirectory(@"Reports\Benchmark-Dark.png");varoptions=newReportHtmlOptions{Title="Json Serializers Benchmark",GroupByColumns=["Method"],// Groups by 'Method' column and highlights groupsSpectrumColumns=["Mean","Allocated"],// Colorizes 'Mean' and 'Allocated' columns as SpectrumDividerMode=RenderTableDividerMode.EmptyDividerRow,// Separates tables by Empty Divider RowHtmlWrapMode=HtmlDocumentWrapMode.Simple,// Uses simple HTML tableTheme=Theme.Dark// Optional (Default is Dark)};awaitsummary.SaveAsHtmlAndImageAsync(htmlPath,imgPath,options);

Note: Use BenchmarkAutoRunner to Run your benchmarks

Prefer to use BenchmarkAutoRunner.Run() instead of BenchmarkRunner.Run() to run your benchmarks. BenchmarkAutoRunner is similar to BenchmarkRunner, but is Smarter!

BenchmarkAutoRunner.Run<JsonSerializersBenchmark>();// Instead of //BenchmarkRunner.Run<JsonSerializersBenchmark>();

Output HTML:

Visit this HTML page at samples/JsonSerializersBenchmark/Reports/Benchmark-Dark.html

Output Image:

Json Serializers Benchmark

3. Or Using Exporters

Note: prefer to use previous (recommended) methods.

Exporters:

  • [RichImageExporter]
  • [RichHtmlExporter]

Example:

BenchmarkAutoRunner.Run<JsonSerializersBenchmark>();//Prefer to use BenchmarkAutoRunner instead of BenchmarkRunner//Export to colorful image[RichImageExporter(title:"Json Serializers Benchmark",groupByColumns:["Method"],// Groups by 'Method' column and highlights groupsspectrumColumns:["Mean","Allocated"],// Colorizes 'Mean' and 'Allocated' columns as Spectrum and Sorts the result by them //format: ImageFormat.Webp or Jpeg // You can set image format (Default is ImageFormat.Png)//theme: Theme.Dark // Optional (Default is Dark))]//Export to feature-rich HTML[RichHtmlExporter(title:"Json Serializers Benchmark",groupByColumns:["Method"],// Groups by 'Method' column and highlights groupsspectrumColumns:["Mean","Allocated"]// Colorizes 'Mean' and 'Allocated' columns as Spectrum and Sorts the result by them //sortByColumns: ["Mean", "Allocated"] // You can also sort by other columns as you wish//theme: Theme.Dark // Optional (Default is Dark))][MemoryDiagnoser(displayGenColumns:false)]// Displays Allocated column (without GC per Generation columns (Gen 0, Gen 1, Gen 2) due to false option)
public class JsonSerializersBenchmark { ...}

Output:

To see the results, navigate to the following path:

[ProjectDirectory]\bin\[Debug|Release]\[.NET-version]\BenchmarkDotNet.Artifacts\results\Benchmark-report-rich.html|png

For Example:

  • MyBenchmark\bin\Release\net8.0\BenchmarkDotNet.Artifacts\results\Benchmark-report-rich.png
  • MyBenchmark\bin\Release\net8.0\BenchmarkDotNet.Artifacts\results\Benchmark-report-rich.html

Using JoinReports method to Join and Pivot your reports

Example:

Performance benchmark between for, foreach, and ForEach() in different versions of .NET

Pivot by Method column

varsummary=BenchmarkAutoRunner.Run<IterationBenchmark>();//Prefer to use BenchmarkAutoRunner instead of BenchmarkRunner//[ProjectDirectory]\Reports\JoinedBenchmark-PivotBy-Method-Dark.htmlvarhtmlPath=DirectoryHelper.GetPathRelativeToProjectDirectory(@"Reports\JoinedBenchmark-PivotBy-Method-Dark.html");//[ProjectDirectory]\Reports\JoinedBenchmark-PivotBy-Method-Dark.pngvarimagePath=DirectoryHelper.GetPathRelativeToProjectDirectory(@"Reports\JoinedBenchmark-PivotBy-Method-Dark.png");varoptions=newJoinReportHtmlOptions{Title="Performance Comparison between for, foreach, and ForEach() method",MainColumn="Runtime",GroupByColumns=["Categories","Length"],// Groups by column 'Categories' and 'Length'PivotColumn="Method",// Pivot 'Method' column per value of 'Mean'StatisticColumns=["Mean"],// Colorizes 'Mean' columns as SpectrumColumnsOrder=["for","foreach","ForEach()"],// Order of columnsDividerMode=RenderTableDividerMode.SeparateTables,// Separates tables by Grouping by 'GroupByColumns'HtmlWrapMode=HtmlDocumentWrapMode.RichDataTables,// Uses feature-rich https://datatables.net pluginTheme=Theme.Dark// Optional (Default is Dark)};awaitsummary.JoinReportsAndSaveAsHtmlAndImageAsync(htmlPath,imagePath,options);

Output HTML:

Visit this HTML page at samples/IterationBenchmark/Reports/JoinedBenchmark-PivotBy-Method-Dark.html

Output Image:

Iteration Benchmark

Pivot by .NET Runtime column

varsummary=BenchmarkAutoRunner.Run<IterationBenchmark>();//Prefer to use BenchmarkAutoRunner instead of BenchmarkRunner//[ProjectDirectory]\Reports\JoinedBenchmark-PivotBy-Runtime-Dark.htmlvarhtmlPath=DirectoryHelper.GetPathRelativeToProjectDirectory(@"Reports\JoinedBenchmark-PivotBy-Runtime-Dark.html");//[ProjectDirectory]\Reports\JoinedBenchmark-PivotBy-Runtime-Dark.pngvarimagePath=DirectoryHelper.GetPathRelativeToProjectDirectory(@"Reports\JoinedBenchmark-PivotBy-Runtime-Dark.png");varoptions=newJoinReportHtmlOptions{Title="Performance Comparison between for, foreach, and ForEach() method",MainColumn="Method",GroupByColumns=["Categories","Length"],// Groups by column 'Categories' and 'Length'PivotColumn="Runtime",// Pivot 'Runtime' column per value of 'Mean'StatisticColumns=["Mean"],// Colorizes 'Mean' columns as SpectrumColumnsOrder=[".NET Core 3.0",".NET Core 3.1",".NET 5.0",".NET 6.0",".NET 7.0",".NET 8.0"],//Order of columnsDividerMode=RenderTableDividerMode.SeparateTables,// Separates tables by Grouping by 'GroupByColumns'HtmlWrapMode=HtmlDocumentWrapMode.RichDataTables,// Uses feature-rich https://datatables.net pluginTheme=Theme.Dark// Optional (Default is Dark)};awaitsummary.JoinReportsAndSaveAsHtmlAndImageAsync(htmlPath,imagePath,options);

Output HTML:

Visit this HTML page at samples/IterationBenchmark/Reports/JoinedBenchmark-PivotBy-Runtime-Dark.html

Output Image:

Iteration Benchmark

Todo

  • Chart Visualization

Contributing

Create an issue if you find a BUG or have a Suggestion or Question.

If you want to develop this project :

  1. Fork it!
  2. Create your feature branch: git checkout -b my-new-feature
  3. Commit your changes: git commit -am 'Add some feature'
  4. Push to the branch: git push origin my-new-feature
  5. Submit a pull request

Give it a Star! ⭐️

If you find this repository useful and like it, why not give it a star? if not, never mind! :)

License

Copyright Β© 2024 Mohammad Javad Ebrahimi under the MIT License.

About

🌈 Visualizes your BenchmarkDotNet benchmarks to Colorful images and Feature-rich HTML (and maybe powerful charts in the future!)

Topics

Resources

Stars

59 stars

Watchers

1 watching

Forks

Releases

Packages

Used by

Contributors

Languages