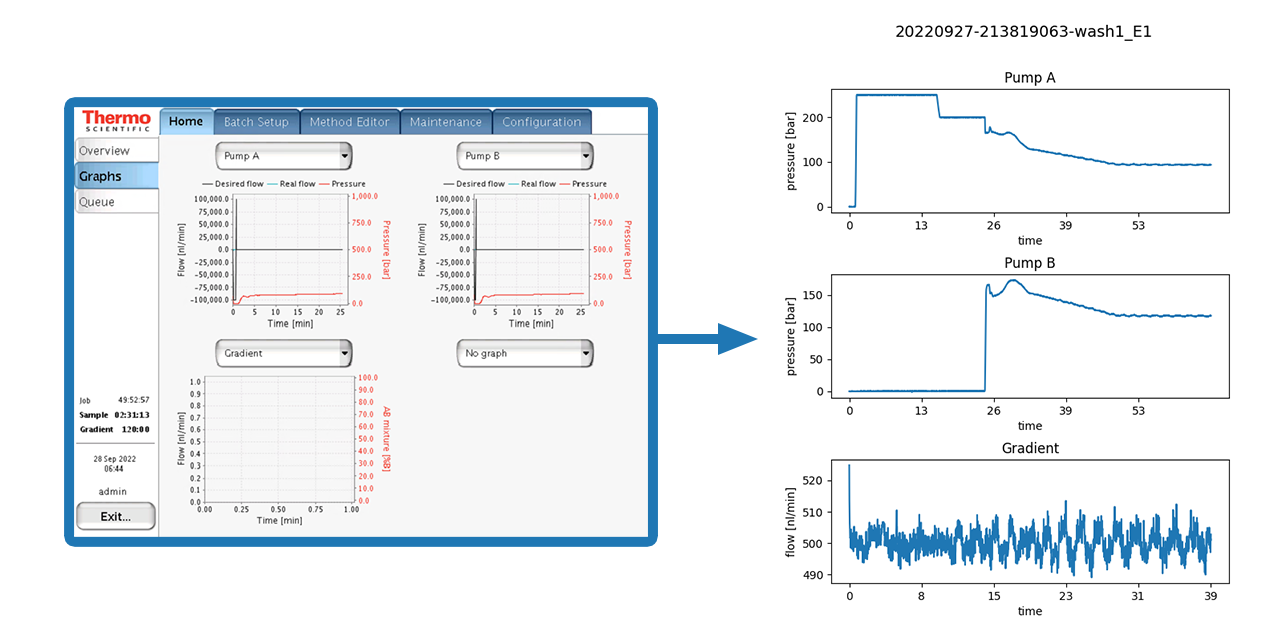
Automated generation of pump plots after each measurement for Thermo easy-nLCs (tested with easy-nLC 1000) via SSH connection.
- Install Python 3.8 depending on your Windows version (32/64bit). Note: Add Python to Windows PATH variable.
- Open command prompt (
cmd.exe) or Windows PowerShell and install the following Python packages via pip:
pip install paramiko seaborn matplotlib pandas numpy
Clone this repo or copy
nLCplotSSH.py(f.e. toC:\nLCplotSSH\)Create a dedicated output folder for the plots (f.e.
D:\nLC_plots\)Open Windows
Task Schedulerand click onCreate Basic Task...
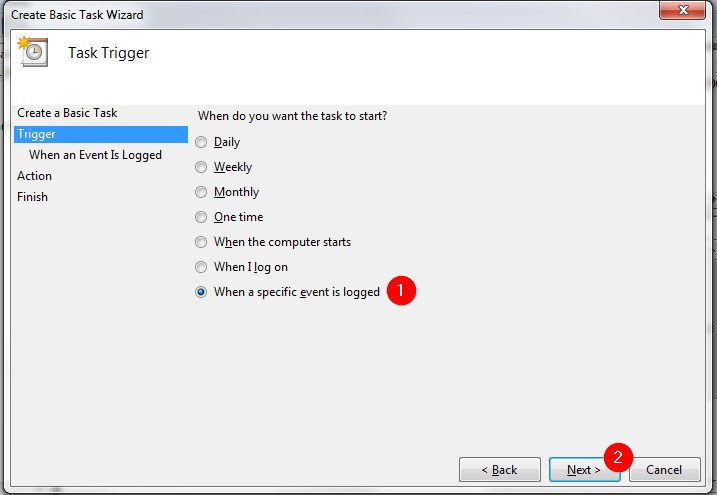
Select
When a specific event is logged
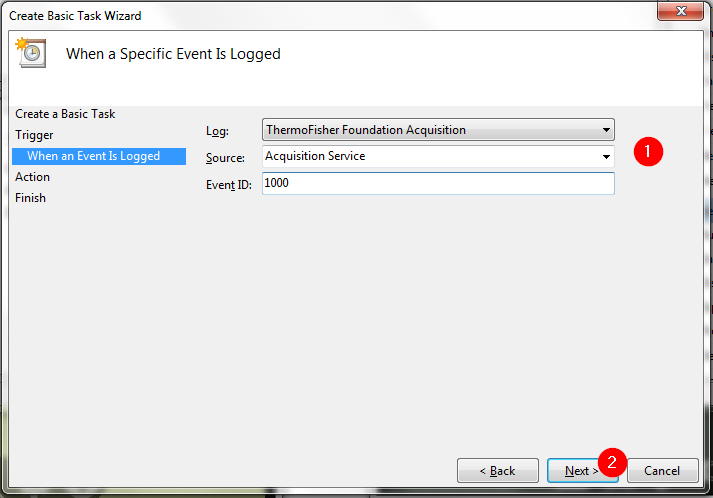
Setup the logging event

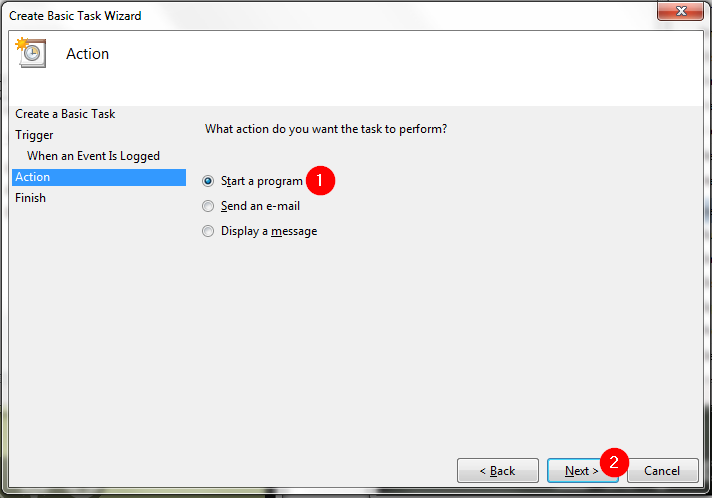
Select
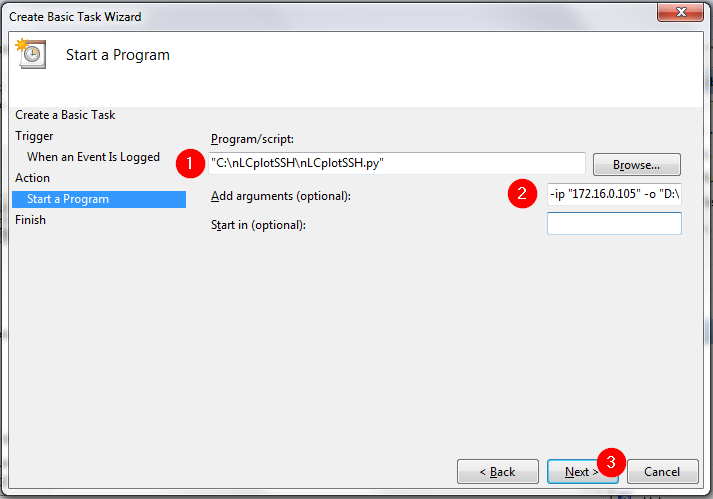
Start a program
Browse the path to nLCplotSSH.py`` and add the arguments
-ip "IP.ADRESS.OF.NLC" -o "D:\nLC_plots"
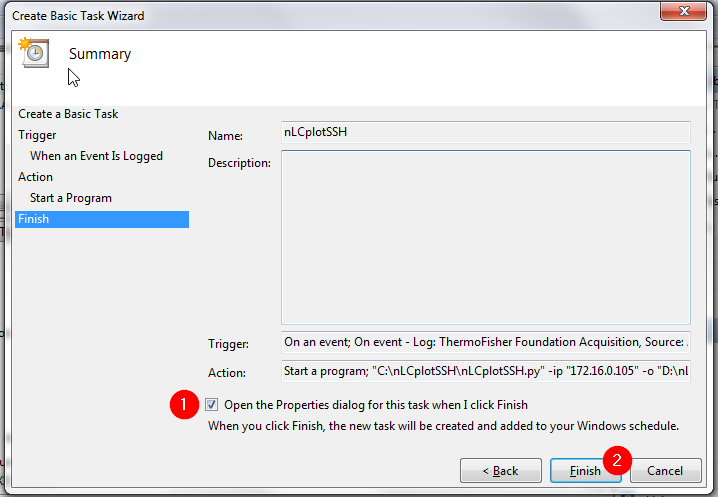
Check
Open the Properties dialog for this task when I click Finishand press Finish
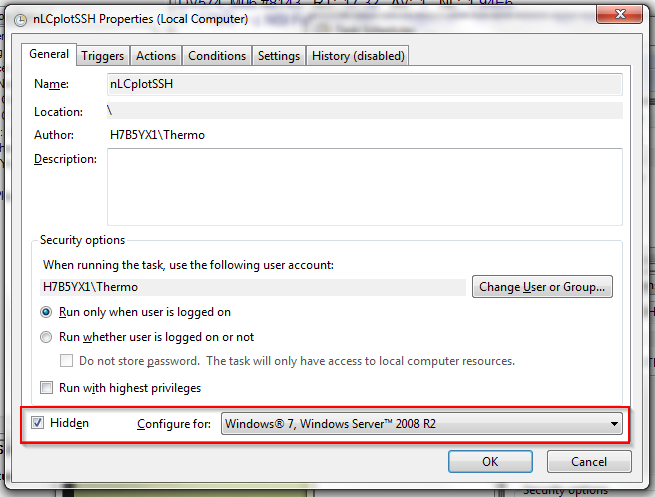
In the
Generaltab of the Properties dialog checkHiddenand Select Windows 7 inConfigure for:
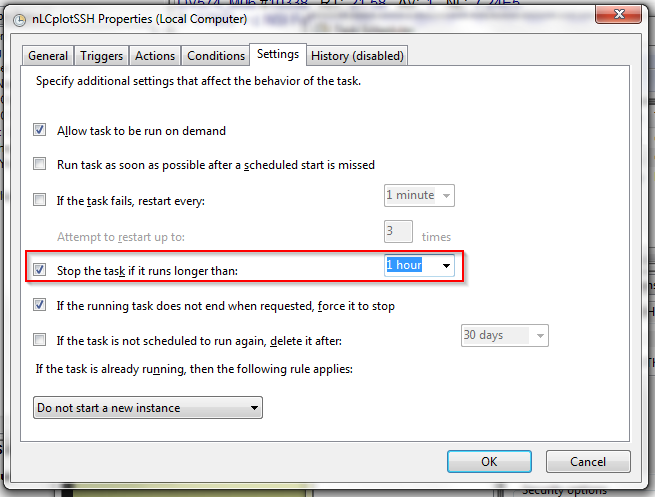
In the
Settingstab select1 houratStop the task if it runs longer than:
Press
Ok. Plots will be automatically generated after each measurement.

argument default value description
-ip / --ip "172.16.0.105" easy-nLC IP address
-u / --user "hplc" User name for SSH connection
-p / --password "hplc" Password for SSH connection
-lp / --log_path "/home/admin/batchLog" Log path in easy-nLC filesystem
-o / --out "E:\_nLCplotsSSH" Path for plot output