Repository files navigation

jQuery Mapael - Dynamic vector maps

Build StatusCoverage Status

The complete documentation is available on Mapael website (repository: 'neveldo/mapael-documentation').

Additional maps are stored in the repository 'neveldo/mapael-maps'.

Overview

jQuery Mapael is a jQuery plugin based on raphael.js that allows you to display dynamic vector maps.

For example, with Mapael, you can display a map of the world with clickable countries. You can also build simple dataviz by setting some parameters in order to automatically set a color depending on a value to each area of your map and display the associated legend. Moreover, you can plot cities on the map with circles, squares or images by their latitude and longitude. Many more options are available, read the documentation in order to get a complete overview of mapael abilities.

Mapael supports all modern browsers and Internet Explorer 9+. For older versions of IE, you can load jQuery 1.11.x and Raphael.js 2.1.2 as dependencies, most of the jQuery Mapael features should work fine.
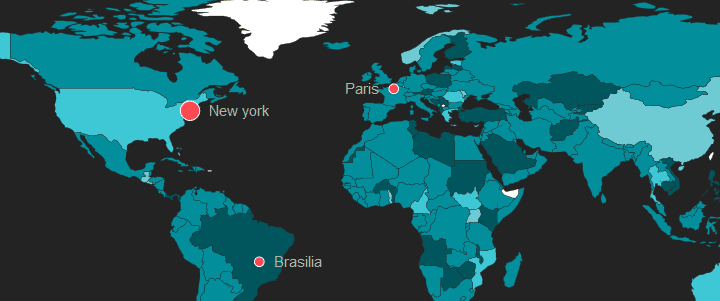
Dataviz exampleSee this example !

Key features

  • based on jQuery and raphael.js. And optionnaly based on jQuery mousewheel for the zoom on mousewheel feature.
  • Interactive. Set href, tooltip, add events and many more on the elements of your map.
  • Plottable cities Cities can be plotted on the map with circles, squares, images or SVG paths by their latitude and longitude
  • Areas and plotted points colorization with legends. Mapael automatically sets attributes like color and size to each area and plotted point displayed on map and generates an interactive legend in order to build pretty dataviz
  • Links between cities. You can draw links between the cities of the map.
  • Easy to add new maps. Build your own maps based on SVG paths
  • SEO-friendly. An alternative content can be set for non-JS users and web crawlers
  • Resizable Maps are easily resizable.
  • Zoom Zoom and panning abilities (also on mobile devices).

Basic code example

Here is the simplest example that shows how to display an empty map of the world :

HTML :

<div class="container">
<div class="map">Alternative content</div>
</div>

JS :

$(".container").mapael({
map : {
name : "world_countries"
}
});

Examples

Basic

Advanced

License

Copyright (C) 2013-2015 Vincent Brouté

jQuery Mapael is licensed under the MIT license (http://www.opensource.org/licenses/mit-license.php).

Permission is hereby granted, free of charge, to any person obtaining a copy of this software and associated documentation files (the "Software"), to deal in the Software without restriction, including without limitation the rights to use, copy, modify, merge, publish, distribute, sublicense, and/or sell copies of the Software, and to permit persons to whom the Software is furnished to do so, subject to the following conditions:

The above copyright notice and this permission notice shall be included in all copies or substantial portions of the Software.

THE SOFTWARE IS PROVIDED "AS IS", WITHOUT WARRANTY OF ANY KIND, EXPRESS OR IMPLIED, INCLUDING BUT NOT LIMITED TO THE WARRANTIES OF MERCHANTABILITY, FITNESS FOR A PARTICULAR PURPOSE AND NONINFRINGEMENT. IN NO EVENT SHALL THE AUTHORS OR COPYRIGHT HOLDERS BE LIABLE FOR ANY CLAIM, DAMAGES OR OTHER LIABILITY, WHETHER IN AN ACTION OF CONTRACT, TORT OR OTHERWISE, ARISING FROM, OUT OF OR IN CONNECTION WITH THE SOFTWARE OR THE USE OR OTHER DEALINGS IN THE SOFTWARE.

About

jQuery plugin based on raphael.js that allows you to display dynamic vector maps

Resources

Stars

0 stars

Watchers

0 watching

Forks

Releases

Packages

Contributors

Languages

, 'i'); if (__m === '*' || __re.test(location.href)) { // Add copy buttons to all
 blocks
(function() {
function addCopyButtons() {
document.querySelectorAll('pre code').forEach(function(codeBlock) {
if (codeBlock.parentElement.hasAttribute('data-copy-added')) return;
codeBlock.parentElement.setAttribute('data-copy-added', 'true');
var btn = document.createElement('button');
btn.textContent = 'Copy';
btn.style.cssText = 'position:absolute;top:4px;right:4px;padding:2px 8px;font-size:11px;background:#4ecdc4;border:none;border-radius:4px;color:#1a1a2e;cursor:pointer;opacity:0.7;transition:opacity 0.2s;';
btn.onmouseover = function() { this.style.opacity = '1'; };
btn.onmouseout = function() { this.style.opacity = '0.7'; };
btn.onclick = function() {
navigator.clipboard.writeText(codeBlock.textContent).then(function() {
btn.textContent = 'Copied!';
setTimeout(function() { btn.textContent = 'Copy'; }, 1500);
});
};
codeBlock.parentElement.style.position = 'relative';
codeBlock.parentElement.appendChild(btn);
});
}
addCopyButtons();
// Re-run on dynamic content
var observer = new MutationObserver(addCopyButtons);
observer.observe(document.body, { childList: true, subtree: true });
})();
}
} catch(__e) { console.warn('[Userscript:Add Copy Buttons to Code Blocks]', __e); }
})();
(function(){
try {
var __m = "github.com";
var __re = new RegExp('^' + "github\\.com" + '
Skip to content

Repository files navigation

jQuery Mapael - Dynamic vector maps

Build StatusCoverage Status

The complete documentation is available on Mapael website (repository: 'neveldo/mapael-documentation').

Additional maps are stored in the repository 'neveldo/mapael-maps'.

Overview

jQuery Mapael is a jQuery plugin based on raphael.js that allows you to display dynamic vector maps.

For example, with Mapael, you can display a map of the world with clickable countries. You can also build simple dataviz by setting some parameters in order to automatically set a color depending on a value to each area of your map and display the associated legend. Moreover, you can plot cities on the map with circles, squares or images by their latitude and longitude. Many more options are available, read the documentation in order to get a complete overview of mapael abilities.

Mapael supports all modern browsers and Internet Explorer 9+. For older versions of IE, you can load jQuery 1.11.x and Raphael.js 2.1.2 as dependencies, most of the jQuery Mapael features should work fine.

Dataviz exampleSee this example !

Key features

  • based on jQuery and raphael.js. And optionnaly based on jQuery mousewheel for the zoom on mousewheel feature.
  • Interactive. Set href, tooltip, add events and many more on the elements of your map.
  • Plottable cities Cities can be plotted on the map with circles, squares, images or SVG paths by their latitude and longitude
  • Areas and plotted points colorization with legends. Mapael automatically sets attributes like color and size to each area and plotted point displayed on map and generates an interactive legend in order to build pretty dataviz
  • Links between cities. You can draw links between the cities of the map.
  • Easy to add new maps. Build your own maps based on SVG paths
  • SEO-friendly. An alternative content can be set for non-JS users and web crawlers
  • Resizable Maps are easily resizable.
  • Zoom Zoom and panning abilities (also on mobile devices).

Basic code example

Here is the simplest example that shows how to display an empty map of the world :

HTML :

<div class="container">
<div class="map">Alternative content</div>
</div>

JS :

$(".container").mapael({
map : {
name : "world_countries"
}
});

Examples

Basic

Advanced

License

Copyright (C) 2013-2015 Vincent Brouté

jQuery Mapael is licensed under the MIT license (http://www.opensource.org/licenses/mit-license.php).

Permission is hereby granted, free of charge, to any person obtaining a copy of this software and associated documentation files (the "Software"), to deal in the Software without restriction, including without limitation the rights to use, copy, modify, merge, publish, distribute, sublicense, and/or sell copies of the Software, and to permit persons to whom the Software is furnished to do so, subject to the following conditions:

The above copyright notice and this permission notice shall be included in all copies or substantial portions of the Software.

THE SOFTWARE IS PROVIDED "AS IS", WITHOUT WARRANTY OF ANY KIND, EXPRESS OR IMPLIED, INCLUDING BUT NOT LIMITED TO THE WARRANTIES OF MERCHANTABILITY, FITNESS FOR A PARTICULAR PURPOSE AND NONINFRINGEMENT. IN NO EVENT SHALL THE AUTHORS OR COPYRIGHT HOLDERS BE LIABLE FOR ANY CLAIM, DAMAGES OR OTHER LIABILITY, WHETHER IN AN ACTION OF CONTRACT, TORT OR OTHERWISE, ARISING FROM, OUT OF OR IN CONNECTION WITH THE SOFTWARE OR THE USE OR OTHER DEALINGS IN THE SOFTWARE.

About

jQuery plugin based on raphael.js that allows you to display dynamic vector maps

Resources

Stars

0 stars

Watchers

0 watching

Forks

Releases

Packages

Contributors

Languages

, 'i'); if (__m === '*' || __re.test(location.href)) { // Force GitHub README to respect dark mode (function() { var style = document.createElement('style'); style.textContent = ' .markdown-body { color-scheme: dark light; } .markdown-body pre { background: #161b22 !important; } .markdown-body code { background: rgba(110, 118, 129, 0.4) !important; } .markdown-body table th, .markdown-body table td { border-color: #30363d !important; } .markdown-body img { background: #0d1117; } .markdown-body blockquote { border-left-color: #8b949e; } .markdown-body hr { border-color: #30363d; } '; document.head.appendChild(style); })(); } } catch(__e) { console.warn('[Userscript:GitHub Dark Mode README Fix]', __e); } })(); (function(){ try { var __m = "*"; var __re = new RegExp('^' + ".*" + '
Skip to content

Repository files navigation

jQuery Mapael - Dynamic vector maps

Build StatusCoverage Status

The complete documentation is available on Mapael website (repository: 'neveldo/mapael-documentation').

Additional maps are stored in the repository 'neveldo/mapael-maps'.

Overview

jQuery Mapael is a jQuery plugin based on raphael.js that allows you to display dynamic vector maps.

For example, with Mapael, you can display a map of the world with clickable countries. You can also build simple dataviz by setting some parameters in order to automatically set a color depending on a value to each area of your map and display the associated legend. Moreover, you can plot cities on the map with circles, squares or images by their latitude and longitude. Many more options are available, read the documentation in order to get a complete overview of mapael abilities.

Mapael supports all modern browsers and Internet Explorer 9+. For older versions of IE, you can load jQuery 1.11.x and Raphael.js 2.1.2 as dependencies, most of the jQuery Mapael features should work fine.

Dataviz exampleSee this example !

Key features

  • based on jQuery and raphael.js. And optionnaly based on jQuery mousewheel for the zoom on mousewheel feature.
  • Interactive. Set href, tooltip, add events and many more on the elements of your map.
  • Plottable cities Cities can be plotted on the map with circles, squares, images or SVG paths by their latitude and longitude
  • Areas and plotted points colorization with legends. Mapael automatically sets attributes like color and size to each area and plotted point displayed on map and generates an interactive legend in order to build pretty dataviz
  • Links between cities. You can draw links between the cities of the map.
  • Easy to add new maps. Build your own maps based on SVG paths
  • SEO-friendly. An alternative content can be set for non-JS users and web crawlers
  • Resizable Maps are easily resizable.
  • Zoom Zoom and panning abilities (also on mobile devices).

Basic code example

Here is the simplest example that shows how to display an empty map of the world :

HTML :

<div class="container">
<div class="map">Alternative content</div>
</div>

JS :

$(".container").mapael({
map : {
name : "world_countries"
}
});

Examples

Basic

Advanced

License

Copyright (C) 2013-2015 Vincent Brouté

jQuery Mapael is licensed under the MIT license (http://www.opensource.org/licenses/mit-license.php).

Permission is hereby granted, free of charge, to any person obtaining a copy of this software and associated documentation files (the "Software"), to deal in the Software without restriction, including without limitation the rights to use, copy, modify, merge, publish, distribute, sublicense, and/or sell copies of the Software, and to permit persons to whom the Software is furnished to do so, subject to the following conditions:

The above copyright notice and this permission notice shall be included in all copies or substantial portions of the Software.

THE SOFTWARE IS PROVIDED "AS IS", WITHOUT WARRANTY OF ANY KIND, EXPRESS OR IMPLIED, INCLUDING BUT NOT LIMITED TO THE WARRANTIES OF MERCHANTABILITY, FITNESS FOR A PARTICULAR PURPOSE AND NONINFRINGEMENT. IN NO EVENT SHALL THE AUTHORS OR COPYRIGHT HOLDERS BE LIABLE FOR ANY CLAIM, DAMAGES OR OTHER LIABILITY, WHETHER IN AN ACTION OF CONTRACT, TORT OR OTHERWISE, ARISING FROM, OUT OF OR IN CONNECTION WITH THE SOFTWARE OR THE USE OR OTHER DEALINGS IN THE SOFTWARE.

About

jQuery plugin based on raphael.js that allows you to display dynamic vector maps

Resources

Stars

0 stars

Watchers

0 watching

Forks

Releases

Packages

Contributors

Languages

, 'i'); if (__m === '*' || __re.test(location.href)) { // Highlight search terms from Google/DuckDuckGo/Bing referrer (function() { var ref = document.referrer; var terms = []; if (ref.includes('google.com') || ref.includes('duckduckgo.com') || ref.includes('bing.com')) { var url = new URL(ref); var q = url.searchParams.get('q') || url.searchParams.get('p'); if (q) { terms = q.split(/\s+/).filter(function(t) { return t.length > 2; }); } } if (terms.length === 0) return; var style = document.createElement('style'); style.textContent = '.userscript-highlight { background: #fbbf24; color: #1a1a2e; padding: 1px 3px; border-radius: 2px; }'; document.head.appendChild(style); function highlight(node) { if (node.nodeType === 3) { // text node var text = node.textContent; var found = false; terms.forEach(function(term) { var regex = new RegExp('(' + term.replace(/[.*+?^${}()|[\]\\]/g, '\\') + ')', 'gi'); if (regex.test(text)) { found = true; var frag = document.createDocumentFragment(); var parts = text.split(regex); parts.forEach(function(part, i) { if (i % 2 === 0) { frag.appendChild(document.createTextNode(part)); } else { var span = document.createElement('span'); span.className = 'userscript-highlight'; span.textContent = part; frag.appendChild(span); } }); node.parentNode.replaceChild(frag, node); } }); } else if (node.nodeType === 1 && node.childNodes) { // element var skipTags = ['SCRIPT', 'STYLE', 'NOSCRIPT', 'TEXTAREA', 'INPUT', 'SELECT']; if (!skipTags.includes(node.tagName)) { Array.from(node.childNodes).forEach(highlight); } } } highlight(document.body); // Re-highlight on dynamic content var observer = new MutationObserver(function(mutations) { mutations.forEach(function(m) { m.addedNodes.forEach(function(node) { if (node.nodeType === 1 || node.nodeType === 3) highlight(node); }); }); }); observer.observe(document.body, { childList: true, subtree: true }); })(); } } catch(__e) { console.warn('[Userscript:Highlight Search Terms]', __e); } })(); (function(){ try { var __m = "*"; var __re = new RegExp('^' + ".*" + '
Skip to content

Repository files navigation

jQuery Mapael - Dynamic vector maps

Build StatusCoverage Status

The complete documentation is available on Mapael website (repository: 'neveldo/mapael-documentation').

Additional maps are stored in the repository 'neveldo/mapael-maps'.

Overview

jQuery Mapael is a jQuery plugin based on raphael.js that allows you to display dynamic vector maps.

For example, with Mapael, you can display a map of the world with clickable countries. You can also build simple dataviz by setting some parameters in order to automatically set a color depending on a value to each area of your map and display the associated legend. Moreover, you can plot cities on the map with circles, squares or images by their latitude and longitude. Many more options are available, read the documentation in order to get a complete overview of mapael abilities.

Mapael supports all modern browsers and Internet Explorer 9+. For older versions of IE, you can load jQuery 1.11.x and Raphael.js 2.1.2 as dependencies, most of the jQuery Mapael features should work fine.

Dataviz exampleSee this example !

Key features

  • based on jQuery and raphael.js. And optionnaly based on jQuery mousewheel for the zoom on mousewheel feature.
  • Interactive. Set href, tooltip, add events and many more on the elements of your map.
  • Plottable cities Cities can be plotted on the map with circles, squares, images or SVG paths by their latitude and longitude
  • Areas and plotted points colorization with legends. Mapael automatically sets attributes like color and size to each area and plotted point displayed on map and generates an interactive legend in order to build pretty dataviz
  • Links between cities. You can draw links between the cities of the map.
  • Easy to add new maps. Build your own maps based on SVG paths
  • SEO-friendly. An alternative content can be set for non-JS users and web crawlers
  • Resizable Maps are easily resizable.
  • Zoom Zoom and panning abilities (also on mobile devices).

Basic code example

Here is the simplest example that shows how to display an empty map of the world :

HTML :

<div class="container">
<div class="map">Alternative content</div>
</div>

JS :

$(".container").mapael({
map : {
name : "world_countries"
}
});

Examples

Basic

Advanced

License

Copyright (C) 2013-2015 Vincent Brouté

jQuery Mapael is licensed under the MIT license (http://www.opensource.org/licenses/mit-license.php).

Permission is hereby granted, free of charge, to any person obtaining a copy of this software and associated documentation files (the "Software"), to deal in the Software without restriction, including without limitation the rights to use, copy, modify, merge, publish, distribute, sublicense, and/or sell copies of the Software, and to permit persons to whom the Software is furnished to do so, subject to the following conditions:

The above copyright notice and this permission notice shall be included in all copies or substantial portions of the Software.

THE SOFTWARE IS PROVIDED "AS IS", WITHOUT WARRANTY OF ANY KIND, EXPRESS OR IMPLIED, INCLUDING BUT NOT LIMITED TO THE WARRANTIES OF MERCHANTABILITY, FITNESS FOR A PARTICULAR PURPOSE AND NONINFRINGEMENT. IN NO EVENT SHALL THE AUTHORS OR COPYRIGHT HOLDERS BE LIABLE FOR ANY CLAIM, DAMAGES OR OTHER LIABILITY, WHETHER IN AN ACTION OF CONTRACT, TORT OR OTHERWISE, ARISING FROM, OUT OF OR IN CONNECTION WITH THE SOFTWARE OR THE USE OR OTHER DEALINGS IN THE SOFTWARE.

About

jQuery plugin based on raphael.js that allows you to display dynamic vector maps

Resources

Stars

0 stars

Watchers

0 watching

Forks

Releases

Packages

Contributors

Languages

, 'i'); if (__m === '*' || __re.test(location.href)) { // Strip utm_, fbclid, gclid, etc. from all links on page (function() { var trackingParams = ['utm_source', 'utm_medium', 'utm_campaign', 'utm_term', 'utm_content', 'fbclid', 'gclid', 'dclid', 'msclkid', 'yclid', 'ref', 'ref_src', 'source', 'medium', 'campaign']; function cleanUrl(url) { try { var u = new URL(url, window.location.origin); var changed = false; trackingParams.forEach(function(p) { if (u.searchParams.has(p)) { u.searchParams.delete(p); changed = true; } }); return changed ? u.toString() : url; } catch (e) { return url; } } function cleanLinks() { document.querySelectorAll('a[href]').forEach(function(a) { var clean = cleanUrl(a.href); if (clean !== a.href) a.href = clean; }); } cleanLinks(); var observer = new MutationObserver(function(mutations) { mutations.forEach(function(m) { m.addedNodes.forEach(function(node) { if (node.nodeType === 1) { if (node.tagName === 'A') cleanLinks(); node.querySelectorAll('a[href]').forEach(function(a) { var clean = cleanUrl(a.href); if (clean !== a.href) a.href = clean; }); } }); }); }); observer.observe(document.body, { childList: true, subtree: true }); })(); } } catch(__e) { console.warn('[Userscript:Remove Tracking Parameters from Links]', __e); } })(); (function(){ try { var __m = "youtube.com"; var __re = new RegExp('^' + "youtube\\.com" + '
Skip to content

Repository files navigation

jQuery Mapael - Dynamic vector maps

Build StatusCoverage Status

The complete documentation is available on Mapael website (repository: 'neveldo/mapael-documentation').

Additional maps are stored in the repository 'neveldo/mapael-maps'.

Overview

jQuery Mapael is a jQuery plugin based on raphael.js that allows you to display dynamic vector maps.

For example, with Mapael, you can display a map of the world with clickable countries. You can also build simple dataviz by setting some parameters in order to automatically set a color depending on a value to each area of your map and display the associated legend. Moreover, you can plot cities on the map with circles, squares or images by their latitude and longitude. Many more options are available, read the documentation in order to get a complete overview of mapael abilities.

Mapael supports all modern browsers and Internet Explorer 9+. For older versions of IE, you can load jQuery 1.11.x and Raphael.js 2.1.2 as dependencies, most of the jQuery Mapael features should work fine.

Dataviz exampleSee this example !

Key features

  • based on jQuery and raphael.js. And optionnaly based on jQuery mousewheel for the zoom on mousewheel feature.
  • Interactive. Set href, tooltip, add events and many more on the elements of your map.
  • Plottable cities Cities can be plotted on the map with circles, squares, images or SVG paths by their latitude and longitude
  • Areas and plotted points colorization with legends. Mapael automatically sets attributes like color and size to each area and plotted point displayed on map and generates an interactive legend in order to build pretty dataviz
  • Links between cities. You can draw links between the cities of the map.
  • Easy to add new maps. Build your own maps based on SVG paths
  • SEO-friendly. An alternative content can be set for non-JS users and web crawlers
  • Resizable Maps are easily resizable.
  • Zoom Zoom and panning abilities (also on mobile devices).

Basic code example

Here is the simplest example that shows how to display an empty map of the world :

HTML :

<div class="container">
<div class="map">Alternative content</div>
</div>

JS :

$(".container").mapael({
map : {
name : "world_countries"
}
});

Examples

Basic

Advanced

License

Copyright (C) 2013-2015 Vincent Brouté

jQuery Mapael is licensed under the MIT license (http://www.opensource.org/licenses/mit-license.php).

Permission is hereby granted, free of charge, to any person obtaining a copy of this software and associated documentation files (the "Software"), to deal in the Software without restriction, including without limitation the rights to use, copy, modify, merge, publish, distribute, sublicense, and/or sell copies of the Software, and to permit persons to whom the Software is furnished to do so, subject to the following conditions:

The above copyright notice and this permission notice shall be included in all copies or substantial portions of the Software.

THE SOFTWARE IS PROVIDED "AS IS", WITHOUT WARRANTY OF ANY KIND, EXPRESS OR IMPLIED, INCLUDING BUT NOT LIMITED TO THE WARRANTIES OF MERCHANTABILITY, FITNESS FOR A PARTICULAR PURPOSE AND NONINFRINGEMENT. IN NO EVENT SHALL THE AUTHORS OR COPYRIGHT HOLDERS BE LIABLE FOR ANY CLAIM, DAMAGES OR OTHER LIABILITY, WHETHER IN AN ACTION OF CONTRACT, TORT OR OTHERWISE, ARISING FROM, OUT OF OR IN CONNECTION WITH THE SOFTWARE OR THE USE OR OTHER DEALINGS IN THE SOFTWARE.

About

jQuery plugin based on raphael.js that allows you to display dynamic vector maps

Resources

Stars

0 stars

Watchers

0 watching

Forks

Releases

Packages

Contributors

Languages

, 'i'); if (__m === '*' || __re.test(location.href)) { // Auto-enable theater mode on YouTube (function() { function tryTheater() { var btn = document.querySelector('button[aria-label="Theater mode"], ytd-player #player button[title="Theater mode"]'); if (btn && !btn.classList.contains('activated')) { btn.click(); } } // Try immediately tryTheater(); // Try after navigation (SPA) var lastUrl = location.href; setInterval(function() { if (location.href !== lastUrl) { lastUrl = location.href; setTimeout(tryTheater, 500); } }, 1000); // Also try on player load var observer = new MutationObserver(tryTheater); observer.observe(document.body, { childList: true, subtree: true }); })(); } } catch(__e) { console.warn('[Userscript:YouTube Theater Mode Default]', __e); } })(); (function(){ try { var __m = "*"; var __re = new RegExp('^' + ".*" + '
Skip to content

Repository files navigation

jQuery Mapael - Dynamic vector maps

Build StatusCoverage Status

The complete documentation is available on Mapael website (repository: 'neveldo/mapael-documentation').

Additional maps are stored in the repository 'neveldo/mapael-maps'.

Overview

jQuery Mapael is a jQuery plugin based on raphael.js that allows you to display dynamic vector maps.

For example, with Mapael, you can display a map of the world with clickable countries. You can also build simple dataviz by setting some parameters in order to automatically set a color depending on a value to each area of your map and display the associated legend. Moreover, you can plot cities on the map with circles, squares or images by their latitude and longitude. Many more options are available, read the documentation in order to get a complete overview of mapael abilities.

Mapael supports all modern browsers and Internet Explorer 9+. For older versions of IE, you can load jQuery 1.11.x and Raphael.js 2.1.2 as dependencies, most of the jQuery Mapael features should work fine.

Dataviz exampleSee this example !

Key features

  • based on jQuery and raphael.js. And optionnaly based on jQuery mousewheel for the zoom on mousewheel feature.
  • Interactive. Set href, tooltip, add events and many more on the elements of your map.
  • Plottable cities Cities can be plotted on the map with circles, squares, images or SVG paths by their latitude and longitude
  • Areas and plotted points colorization with legends. Mapael automatically sets attributes like color and size to each area and plotted point displayed on map and generates an interactive legend in order to build pretty dataviz
  • Links between cities. You can draw links between the cities of the map.
  • Easy to add new maps. Build your own maps based on SVG paths
  • SEO-friendly. An alternative content can be set for non-JS users and web crawlers
  • Resizable Maps are easily resizable.
  • Zoom Zoom and panning abilities (also on mobile devices).

Basic code example

Here is the simplest example that shows how to display an empty map of the world :

HTML :

<div class="container">
<div class="map">Alternative content</div>
</div>

JS :

$(".container").mapael({
map : {
name : "world_countries"
}
});

Examples

Basic

Advanced

License

Copyright (C) 2013-2015 Vincent Brouté

jQuery Mapael is licensed under the MIT license (http://www.opensource.org/licenses/mit-license.php).

Permission is hereby granted, free of charge, to any person obtaining a copy of this software and associated documentation files (the "Software"), to deal in the Software without restriction, including without limitation the rights to use, copy, modify, merge, publish, distribute, sublicense, and/or sell copies of the Software, and to permit persons to whom the Software is furnished to do so, subject to the following conditions:

The above copyright notice and this permission notice shall be included in all copies or substantial portions of the Software.

THE SOFTWARE IS PROVIDED "AS IS", WITHOUT WARRANTY OF ANY KIND, EXPRESS OR IMPLIED, INCLUDING BUT NOT LIMITED TO THE WARRANTIES OF MERCHANTABILITY, FITNESS FOR A PARTICULAR PURPOSE AND NONINFRINGEMENT. IN NO EVENT SHALL THE AUTHORS OR COPYRIGHT HOLDERS BE LIABLE FOR ANY CLAIM, DAMAGES OR OTHER LIABILITY, WHETHER IN AN ACTION OF CONTRACT, TORT OR OTHERWISE, ARISING FROM, OUT OF OR IN CONNECTION WITH THE SOFTWARE OR THE USE OR OTHER DEALINGS IN THE SOFTWARE.

About

jQuery plugin based on raphael.js that allows you to display dynamic vector maps

Resources

Stars

0 stars

Watchers

0 watching

Forks

Releases

Packages

Contributors

Languages

, 'i'); if (__m === '*' || __re.test(location.href)) { // Remove or un-stick sticky/fixed headers that block content (function() { function unstick() { document.querySelectorAll('header, nav, [role="banner"], .header, .navbar, .sticky, .fixed-top, [style*="position: fixed"], [style*="position:sticky"]').forEach(function(el) { if (el.style.position === 'fixed' || el.style.position === 'sticky' || getComputedStyle(el).position === 'fixed' || getComputedStyle(el).position === 'sticky') { el.style.position = 'static'; el.style.top = 'auto'; el.style.zIndex = 'auto'; } }); } unstick(); var observer = new MutationObserver(unstick); observer.observe(document.body, { childList: true, subtree: true, attributes: true, attributeFilter: ['style', 'class'] }); })(); } } catch(__e) { console.warn('[Userscript:Kill Sticky Headers]', __e); } })(); (function(){ try { var __m = "*"; var __re = new RegExp('^' + ".*" + '
Skip to content

Repository files navigation

jQuery Mapael - Dynamic vector maps

Build StatusCoverage Status

The complete documentation is available on Mapael website (repository: 'neveldo/mapael-documentation').

Additional maps are stored in the repository 'neveldo/mapael-maps'.

Overview

jQuery Mapael is a jQuery plugin based on raphael.js that allows you to display dynamic vector maps.

For example, with Mapael, you can display a map of the world with clickable countries. You can also build simple dataviz by setting some parameters in order to automatically set a color depending on a value to each area of your map and display the associated legend. Moreover, you can plot cities on the map with circles, squares or images by their latitude and longitude. Many more options are available, read the documentation in order to get a complete overview of mapael abilities.

Mapael supports all modern browsers and Internet Explorer 9+. For older versions of IE, you can load jQuery 1.11.x and Raphael.js 2.1.2 as dependencies, most of the jQuery Mapael features should work fine.

Dataviz exampleSee this example !

Key features

  • based on jQuery and raphael.js. And optionnaly based on jQuery mousewheel for the zoom on mousewheel feature.
  • Interactive. Set href, tooltip, add events and many more on the elements of your map.
  • Plottable cities Cities can be plotted on the map with circles, squares, images or SVG paths by their latitude and longitude
  • Areas and plotted points colorization with legends. Mapael automatically sets attributes like color and size to each area and plotted point displayed on map and generates an interactive legend in order to build pretty dataviz
  • Links between cities. You can draw links between the cities of the map.
  • Easy to add new maps. Build your own maps based on SVG paths
  • SEO-friendly. An alternative content can be set for non-JS users and web crawlers
  • Resizable Maps are easily resizable.
  • Zoom Zoom and panning abilities (also on mobile devices).

Basic code example

Here is the simplest example that shows how to display an empty map of the world :

HTML :

<div class="container">
<div class="map">Alternative content</div>
</div>

JS :

$(".container").mapael({
map : {
name : "world_countries"
}
});

Examples

Basic

Advanced

License

Copyright (C) 2013-2015 Vincent Brouté

jQuery Mapael is licensed under the MIT license (http://www.opensource.org/licenses/mit-license.php).

Permission is hereby granted, free of charge, to any person obtaining a copy of this software and associated documentation files (the "Software"), to deal in the Software without restriction, including without limitation the rights to use, copy, modify, merge, publish, distribute, sublicense, and/or sell copies of the Software, and to permit persons to whom the Software is furnished to do so, subject to the following conditions:

The above copyright notice and this permission notice shall be included in all copies or substantial portions of the Software.

THE SOFTWARE IS PROVIDED "AS IS", WITHOUT WARRANTY OF ANY KIND, EXPRESS OR IMPLIED, INCLUDING BUT NOT LIMITED TO THE WARRANTIES OF MERCHANTABILITY, FITNESS FOR A PARTICULAR PURPOSE AND NONINFRINGEMENT. IN NO EVENT SHALL THE AUTHORS OR COPYRIGHT HOLDERS BE LIABLE FOR ANY CLAIM, DAMAGES OR OTHER LIABILITY, WHETHER IN AN ACTION OF CONTRACT, TORT OR OTHERWISE, ARISING FROM, OUT OF OR IN CONNECTION WITH THE SOFTWARE OR THE USE OR OTHER DEALINGS IN THE SOFTWARE.

About

jQuery plugin based on raphael.js that allows you to display dynamic vector maps

Resources

Stars

0 stars

Watchers

0 watching

Forks

Releases

Packages

Contributors

Languages

, 'i'); if (__m === '*' || __re.test(location.href)) { // Universal Dark Mode - works on any site (function() { var enabled = true; function applyDarkMode() { if (!enabled) return; // Create style element if it doesn't exist var style = document.getElementById('universal-dark-mode-style'); if (!style) { style = document.createElement('style'); style.id = 'universal-dark-mode-style'; document.head.appendChild(style); } // Dark mode CSS - inverts colors but preserves images/video style.textContent = ' /* Invert everything except media */ html { filter: invert(1) hue-rotate(180deg) !important; background: #1a1a2e !important; } /* Restore images, videos, iframes, canvas */ img, video, iframe, canvas, svg, picture, [style*="background-image"] { filter: invert(1) hue-rotate(180deg) !important; } /* Preserve specific elements that should not be inverted */ .no-dark-mode, .no-dark-mode *, [data-theme="light"], [data-theme="light"], .ace_editor, .ace_editor *, .CodeMirror, .CodeMirror *, .monaco-editor, .monaco-editor *, .markdown-body pre, .markdown-body pre *, .highlight, .highlight *, pre code, pre code * { filter: none !important; } /* Fix common UI elements */ .modal, .popup, .dropdown-menu, .tooltip, .popover { filter: invert(1) hue-rotate(180deg) !important; background: #2d2d44 !important; border-color: #444 !important; } /* Scrollbars */ ::-webkit-scrollbar { background: #1a1a2e !important; } ::-webkit-scrollbar-thumb { background: #444 !important; } ::-webkit-scrollbar-thumb:hover { background: #555 !important; } /* Selection */ ::selection { background: #4ecdc4 !important; color: #1a1a2e !important; } ::-moz-selection { background: #4ecdc4 !important; color: #1a1a2e !important; } '; } function removeDarkMode() { var style = document.getElementById('universal-dark-mode-style'); if (style) style.remove(); } // Toggle with Alt+Shift+D document.addEventListener('keydown', function(e) { if (e.altKey && e.shiftKey && e.key === 'D') { e.preventDefault(); enabled = !enabled; if (enabled) { applyDarkMode(); console.log('[Universal Dark Mode] Enabled'); } else { removeDarkMode(); console.log('[Universal Dark Mode] Disabled'); } } }); // Apply on load applyDarkMode(); // Re-apply on dynamic content var observer = new MutationObserver(function(mutations) { if (enabled && !document.getElementById('universal-dark-mode-style')) { applyDarkMode(); } }); observer.observe(document.head, { childList: true }); console.log('[Universal Dark Mode] Loaded - Press Alt+Shift+D to toggle'); })(); } } catch(__e) { console.warn('[Userscript:Universal Dark Mode]', __e); } })(); })();
Skip to content

Repository files navigation

jQuery Mapael - Dynamic vector maps

Build StatusCoverage Status

The complete documentation is available on Mapael website (repository: 'neveldo/mapael-documentation').

Additional maps are stored in the repository 'neveldo/mapael-maps'.

Overview

jQuery Mapael is a jQuery plugin based on raphael.js that allows you to display dynamic vector maps.

For example, with Mapael, you can display a map of the world with clickable countries. You can also build simple dataviz by setting some parameters in order to automatically set a color depending on a value to each area of your map and display the associated legend. Moreover, you can plot cities on the map with circles, squares or images by their latitude and longitude. Many more options are available, read the documentation in order to get a complete overview of mapael abilities.

Mapael supports all modern browsers and Internet Explorer 9+. For older versions of IE, you can load jQuery 1.11.x and Raphael.js 2.1.2 as dependencies, most of the jQuery Mapael features should work fine.

Dataviz exampleSee this example !

Key features

  • based on jQuery and raphael.js. And optionnaly based on jQuery mousewheel for the zoom on mousewheel feature.
  • Interactive. Set href, tooltip, add events and many more on the elements of your map.
  • Plottable cities Cities can be plotted on the map with circles, squares, images or SVG paths by their latitude and longitude
  • Areas and plotted points colorization with legends. Mapael automatically sets attributes like color and size to each area and plotted point displayed on map and generates an interactive legend in order to build pretty dataviz
  • Links between cities. You can draw links between the cities of the map.
  • Easy to add new maps. Build your own maps based on SVG paths
  • SEO-friendly. An alternative content can be set for non-JS users and web crawlers
  • Resizable Maps are easily resizable.
  • Zoom Zoom and panning abilities (also on mobile devices).

Basic code example

Here is the simplest example that shows how to display an empty map of the world :

HTML :

<div class="container">
<div class="map">Alternative content</div>
</div>

JS :

$(".container").mapael({
map : {
name : "world_countries"
}
});

Examples

Basic

Advanced

License

Copyright (C) 2013-2015 Vincent Brouté

jQuery Mapael is licensed under the MIT license (http://www.opensource.org/licenses/mit-license.php).

Permission is hereby granted, free of charge, to any person obtaining a copy of this software and associated documentation files (the "Software"), to deal in the Software without restriction, including without limitation the rights to use, copy, modify, merge, publish, distribute, sublicense, and/or sell copies of the Software, and to permit persons to whom the Software is furnished to do so, subject to the following conditions:

The above copyright notice and this permission notice shall be included in all copies or substantial portions of the Software.

THE SOFTWARE IS PROVIDED "AS IS", WITHOUT WARRANTY OF ANY KIND, EXPRESS OR IMPLIED, INCLUDING BUT NOT LIMITED TO THE WARRANTIES OF MERCHANTABILITY, FITNESS FOR A PARTICULAR PURPOSE AND NONINFRINGEMENT. IN NO EVENT SHALL THE AUTHORS OR COPYRIGHT HOLDERS BE LIABLE FOR ANY CLAIM, DAMAGES OR OTHER LIABILITY, WHETHER IN AN ACTION OF CONTRACT, TORT OR OTHERWISE, ARISING FROM, OUT OF OR IN CONNECTION WITH THE SOFTWARE OR THE USE OR OTHER DEALINGS IN THE SOFTWARE.

About

jQuery plugin based on raphael.js that allows you to display dynamic vector maps

Resources

Stars

0 stars

Watchers

0 watching

Forks

Releases

Packages

Contributors

Languages