Datamaps is intended to provide some data visualizations based on geographical data. It's SVG-based, can scale to any screen size, and includes everything inside of 1 script file. It heavily relies on the amazing D3.js library.
Out of the box in includes support for choropleths and bubble maps (see demos), but it's not limited to just that. Its new plugin system allows for the addition of any type of visualization over the map.
Demos at http://datamaps.github.io
Downloads:
- World map (94kb, 36.7kb gzip'd)
- USA only (35kb, 13.9kb gzip'd)
- USA & World (131kb, 47.1kb gzip'd)
- No preset topojson (6.8kb, 2.3kb gzip'd)
###Documentation
- Include D3.js and Topojson on your page
- Include Datamaps.js on your page
- Add a container, set the height and width
- Create a
new Datamaps(options), passing in at least anelementoption
Example:
<scriptsrc="http://d3js.org/d3.v3.min.js"></script><scriptsrc="http://d3js.org/topojson.v1.min.js"></script><scriptsrc="/datamaps.world.min.js"></script><divid="container" style="position: relative; width: 500px; height: 300px;"></div><script>varmap=newDatamap({element: document.getElementById('container')});</script>This should render a new world map with a standard projection.
A map of the USA with an Albers based projection will be default if you only include datamaps.usa.min.js, but in case you include datamaps.all.min.js:
<script>varmap=newDatamap({element: document.getElementById('container'),scope: 'usa'});</script><script>varmap=newDatamap({element: document.getElementById('container'),fills: {defaultFill: 'rgba(23,48,210,0.9)'//any hex, color name or rgb/rgba value}});</script><script>varmap=newDatamap({element: document.getElementById('container'),geographyConfig: {highlightOnHover: false,popupOnHover: false}});</script><script>varmap=newDatamap({element: document.getElementById('container'),geographyConfig: {dataUrl: '/custom.json'},scope: 'custom',setProjection: function(element,options){varprojection,path;projection=d3.geo.albersUsa().scale(element.offsetWidth).translate([element.offsetWidth/2,element.offsetHeight/2]);}path=d3.geo.path().projection(projection);return{path: path,projection: projection};}});</script>By specifying a dataUrl, Datamaps will attempt to fetch that resource as TopoJSON.
If you are using a custom map, you'll probably want to specify your own setProjection method as well.
setProjection takes 2 arguments, element as a DOM element, options as the original options you passed in. It should return an object with two properties: path as a d3.geo.path, projection as a d3.geo.projection
The example above will result in albersUsa projection.
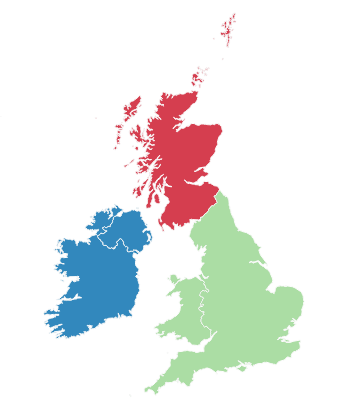
Read about other D3.js projections
Probably the most common type of map visualization, where different states or countries are color coded.
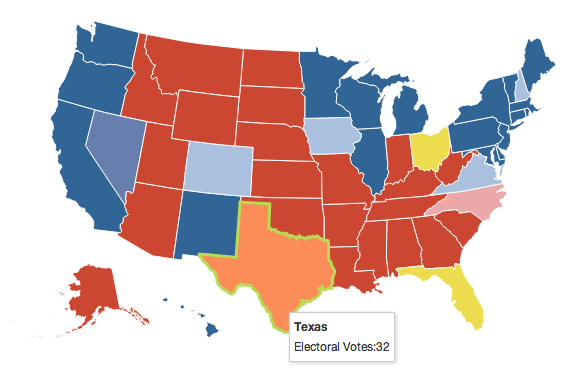
You'll need to know the 2 letter state code ('NY' for New York) or the 3 letter country code ('SCT' for Scotland) to fill in areas.
<script>varmap=newDatamap({element: document.getElementById('container'),fills: {HIGH: '#afafaf',LOW: '#123456',MEDIUM: 'blue',UNKNOWN: 'rgb(0,0,0)',defaultFill: 'green'},data: {IRL: {fillKey: 'LOW',numberOfThings: 2002},USA: {fillKey: 'MEDIUM',numberOfThings: 10381}}});//draw a legend for this mapmap.legend();</script>This will draw a world map and fill in IRL (Ireland) with the corresponding fills.LOW and USA with fills.MEDIUM.
map.updateChoropleth({USA: {fillKey: 'LOW'},CAN: '#0fa0fa'});You can specify either a literal color (as a string), or an object with a fillKey property.
You can also add a map legend with the legend plugin (used above)
Expanding on the previous example of using data, any property passed into data will be sent to the popupTemplate function, which can be overriden to display custom messages.
<script>varmap=newDatamap({element: document.getElementById('container'),fills: {HIGH: '#afafaf',LOW: '#123456',MEDIUM: 'blue',UNKNOWN: 'rgb(0,0,0)',defaultFill: 'green'},data: {IRL: {fillKey: 'LOW',numberOfThings: 2002},USA: {fillKey: 'MEDIUM',numberOfThings: 10381}},geographyConfig: {popupTemplate: function(geo,data){return['<div class="hoverinfo"><strong>','Number of things in '+geo.properties.name,': '+data.numberOfThings,'</strong></div>'].join('');}}});</script>geographyConfig.popupTemplate just needs to return an HTML string, so feel free to use Handlebars or Underscore templates (instead of the terrible Array.join method above).
Bubbles in a core plugin that will render circles('bubbles') on different parts of the map. Each of these bubbles can be color coded in the same way a choropleth is color coded (see above 'Choropleth' example).
varbombMap=newDatamap({element: document.getElementById('map_bombs'),scope: 'world',geographyConfig: {popupOnHover: false,highlightOnHover: false},fills: {'USA': '#1f77b4','RUS': '#9467bd','PRK': '#ff7f0e','PRC': '#2ca02c','IND': '#e377c2','GBR': '#8c564b','FRA': '#d62728','PAK': '#7f7f7f',defaultFill: '#EDDC4E'},data: {'RUS': {fillKey: 'RUS'},'PRK': {fillKey: 'PRK'},'PRC': {fillKey: 'PRC'},'IND': {fillKey: 'IND'},'GBR': {fillKey: 'GBR'},'FRA': {fillKey: 'FRA'},'PAK': {fillKey: 'PAK'},'USA': {fillKey: 'USA'}}});varbombs=[{name: 'Joe 4',radius: 25,yeild: 400,country: 'USSR',fillKey: 'RUS',significance: 'First fusion weapon test by the USSR (not "staged")',date: '1953-08-12',latitude: 50.07,longitude: 78.43},{name: 'RDS-37',radius: 40,yeild: 1600,country: 'USSR',fillKey: 'RUS',significance: 'First "staged" thermonuclear weapon test by the USSR (deployable)',date: '1955-11-22',latitude: 50.07,longitude: 78.43},{name: 'Tsar Bomba',radius: 75,yeild: 50000,country: 'USSR',fillKey: 'RUS',significance: 'Largest thermonuclear weapon ever tested—scaled down from its initial 100 Mt design by 50%',date: '1961-10-31',latitude: 73.482,longitude: 54.5854}];//draw bubbles for bombsbombMap.bubbles(bombs,{popupTemplate: function(geo,data){return['<div class="hoverinfo">'+data.name,'<br/>Payload: '+data.yeild+' kilotons','<br/>Country: '+data.country+'','<br/>Date: '+data.date+'','</div>'].join('');}});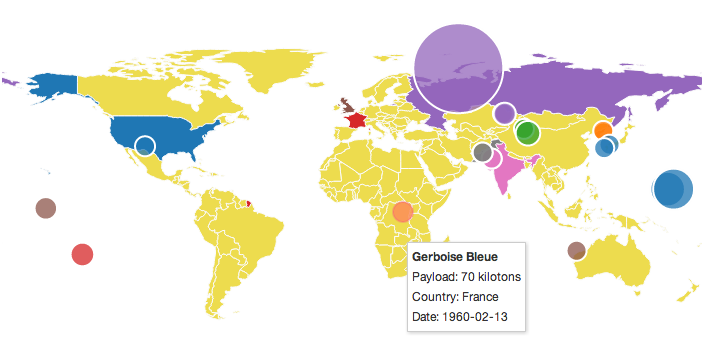
The first parameter to bubbles should be an array of objects, each with at least 3 properties:
latitudelongituderadius
Optionally, pass in fillKey to color code the bubble, and pass in any other data you want to render in a popup template which can be overridden in the options parameter.
For further customization, you can set these properties on each bubble to override the options parameter (or default options):
borderColorborderWidthfillOpacity
The second parameter is the options param, where you can overide any of the default options (documented below)
You can continue to call bubbles on the same map instance and the map will auto update itself. Any bubble previously drawn that's not included in subsequent calls will be removed from the UI.
map.bubbles([]) will erase all bubbles.
You can override the default projection by setting your own setProjection(element) function.
Example here
varmap=newDatamap({scope: 'world',element: document.getElementById('container1'),setProjection: function(element){varprojection=d3.geo.equirectangular().center([19,-3]).rotate([4.4,0]).scale(400).translate([element.offsetWidth/2,element.offsetHeight/2]);varpath=d3.geo.path().projection(projection);return{path: path,projection: projection};},If jQuery is present on the page when the Datamaps library loads, it'll automatically create a jQuery plugin called datamaps that can be used like:
<script>$("#container").datamaps(options);</script>All events are bubbled up to the root svg element and to listen to events, use the done callback.
<script>varmap=newDatamap({element: document.getElementById('container'),done: function(datamap){datamap.svg.selectAll('.datamaps-subunit').on('click',function(geography){alert(geography.properties.name);});}});</script>{scope: 'world',//currently supports 'usa' and 'world', however with custom map data you can specify your ownsetProjection: setProjection,//returns a d3 path and projection functionsprojection: 'equirectangular',//style of projection to be used. try "mercator"done: function(){},//callback when the map is done drawingfills: {defaultFill: '#ABDDA4'//the keys in this object map to the "fillKey" of [data] or [bubbles]},geographyConfig: {dataUrl: null,//if not null, datamaps will fetch the map JSON (currently only supports topojson)hideAntarctica: true,borderWidth: 1,borderColor: '#FDFDFD',popupTemplate: function(geography,data){//this function should just return a stringreturn'<div class="hoverinfo"><strong>'+geography.properties.name+'</strong></div>';},popupOnHover: true,//disable the popup while hoveringhighlightOnHover: true,highlightFillColor: '#FC8D59',highlightBorderColor: 'rgba(250, 15, 160, 0.2)',highlightBorderWidth: 2},bubbleConfig: {borderWidth: 2,borderColor: '#FFFFFF',popupOnHover: true,popupTemplate: function(geography,data){return'<div class="hoverinfo"><strong>'+data.name+'</strong></div>';},fillOpacity: 0.75,highlightOnHover: true,highlightFillColor: '#FC8D59',highlightBorderColor: 'rgba(250, 15, 160, 0.2)',highlightBorderWidth: 2,highlightFillOpacity: 0.85}}Examples: