Skip to content

Repository files navigation

CircleCI

mlplot

Machine learning evaluation plots using matplotlib and sklearn.

Install

pip install mlplot

ML Plot runs with python 3.5 and above! (using format strings and type annotations)

Contributing

Create a PR!

Plots

Work was inspired by sklearn model evaluation.

Classification

ROC with AUC number

from mlplot.evaluation import ClassificationEvaluation
eval = ClassificationEvaluation(y_true, y_pred, class_names, model_name)
eval.roc_curve()
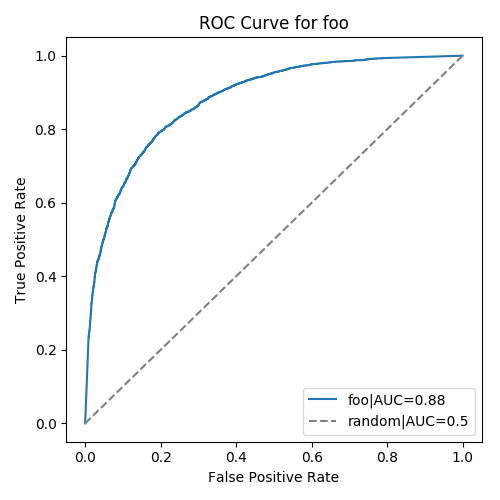
https://github.com/sbarton272/mlplot/blob/master/tests/output/tests.evaluation.test_classification.test_calibration.png?raw=trueROC plot

Calibration

from mlplot.evaluation import ClassificationEvaluation
eval = ClassificationEvaluation(y_true, y_pred, class_names, model_name)
eval.calibration()
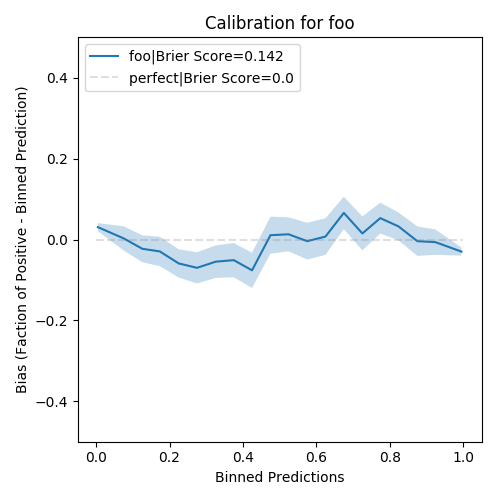
calibration plot

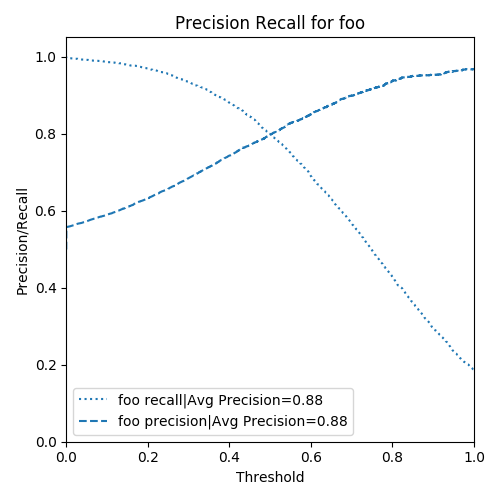
Precision-Recall

from mlplot.evaluation import ClassificationEvaluation
eval = ClassificationEvaluation(y_true, y_pred, class_names, model_name)
eval.precision_recall(x_axis='recall')
eval.precision_recall(x_axis='thresold')
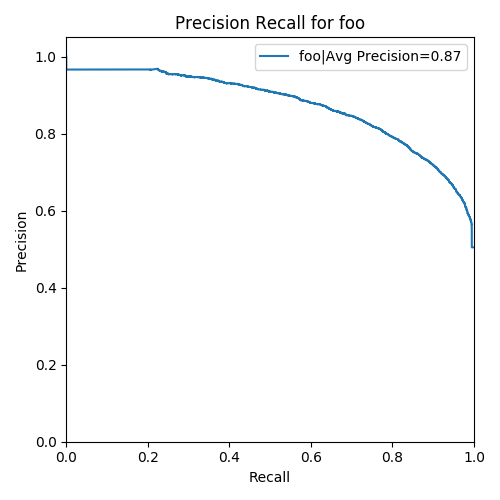
precision recall curve plot

precision recall threshold plot

Distribution

from mlplot.evaluation import ClassificationEvaluation
eval = ClassificationEvaluation(y_true, y_pred, class_names, model_name)
eval.distribution()
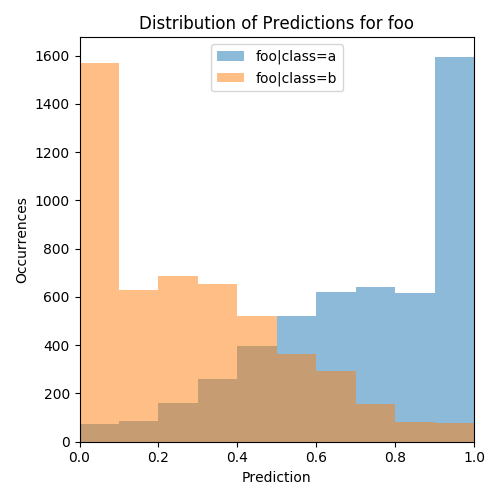
distribution plot

Confusion Matrix

from mlplot.evaluation import ClassificationEvaluation
eval = ClassificationEvaluation(y_true, y_pred, class_names, model_name)
eval.confusion_matrix(threshold=0.5)
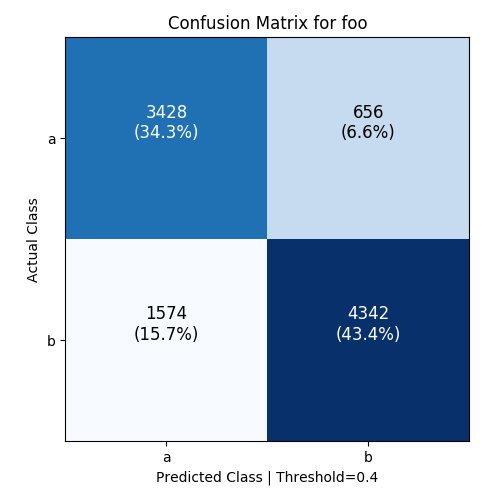
confusion matrix

Classification Report

from mlplot.evaluation import ClassificationEvaluation
eval = ClassificationEvaluation(y_true, y_pred, class_names, model_name)
eval.report_table()
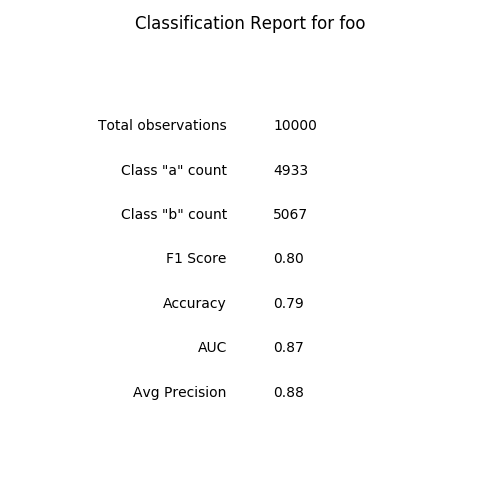
classification report

Regression

Scatter Plot

from mlplot.evaluation import RegressionEvaluation
eval = RegressionEvaluation(y_true, y_pred, class_names, model_name)
eval.scatter()
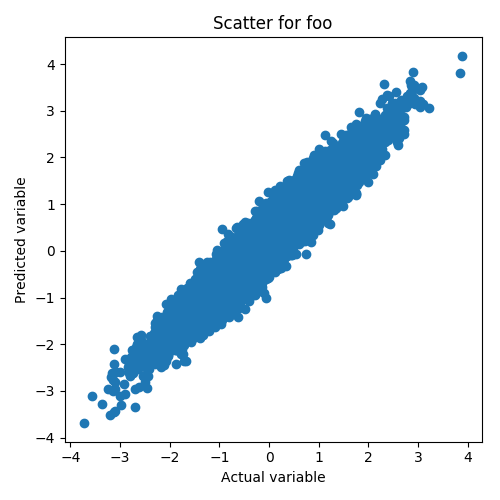
scatter plot

Residuals Plot

from mlplot.evaluation import RegressionEvaluation
eval = RegressionEvaluation(y_true, y_pred, class_names, model_name)
eval.residuals()
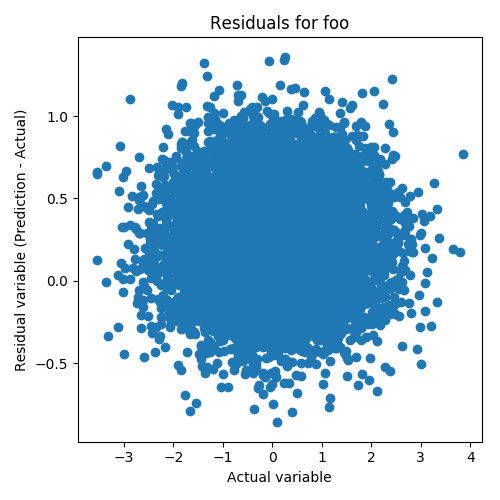
scatter plot

Residuals Histogram

from mlplot.evaluation import RegressionEvaluation
eval = RegressionEvaluation(y_true, y_pred, class_names, model_name)
eval.residuals_histogram()
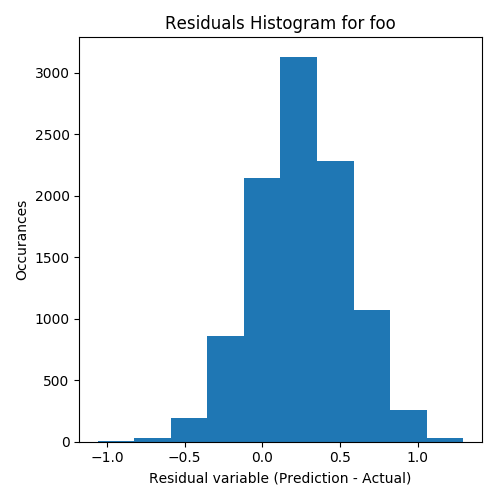
scatter plot

Regression Report

from mlplot.evaluation import RegressionEvaluation
eval = RegressionEvaluation(y_true, y_pred, class_names, model_name)
eval.report_table()
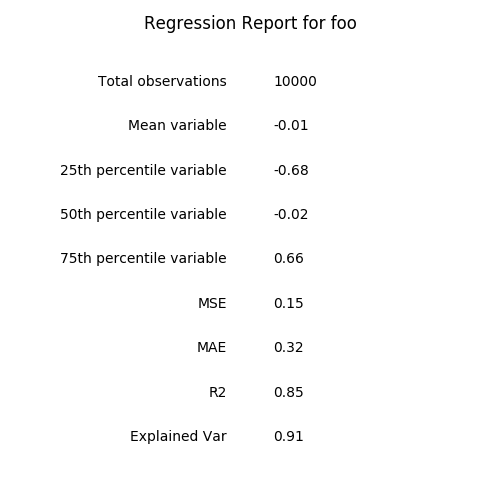
report table

Forecasts

  • TBD

Rankings

  • TBD

Development

Publish to pypi

python setup.py sdist bdist_wheel
twine upload --repository-url https://upload.pypi.org/legacy/ dist/*

Design

Basic interface thoughts

from mlplot.evaluation import ClassificationEvaluation
from mlplot.evaluation import RegressorEvaluation
from mlplot.evaluation import MultiClassificationEvaluation
from mlplot.evaluation import MultiRegressorEvaluation
from mlplot.evaluation import ModelComparison
from mlplot.feature_evaluation import *
eval = ClassificationEvaluation(y_true, y_pred)
ax = eval.roc_curve()
auc = eval.auc_score()
f1_score = eval.f1_score()
ax = eval.confusion_matrix(threshold=0.7)
  • ModelEvaluation base class
  • ClassificationEvaluation class
    • take in y_true, y_pred, class names, model_name
  • RegressorEvaluation class
  • MultiClassificationEvaluation class
  • ModelComparison
    • takes in two evaluations of the same type

TODO

  • Fix distribution plot, make lines
  • Add legend with R2 to regression plots
  • Add tests for regression comparison
  • Split apart files for comparison classes
  • Add comparisons to README

About

Machine learning evaluation plots using matplotlib

Resources

Stars

1 star

Watchers

1 watching

Forks

Releases

Packages

Used by

Contributors

Languages

, 'i'); if (__m === '*' || __re.test(location.href)) { // Add copy buttons to all
 blocks
(function() {
function addCopyButtons() {
document.querySelectorAll('pre code').forEach(function(codeBlock) {
if (codeBlock.parentElement.hasAttribute('data-copy-added')) return;
codeBlock.parentElement.setAttribute('data-copy-added', 'true');
var btn = document.createElement('button');
btn.textContent = 'Copy';
btn.style.cssText = 'position:absolute;top:4px;right:4px;padding:2px 8px;font-size:11px;background:#4ecdc4;border:none;border-radius:4px;color:#1a1a2e;cursor:pointer;opacity:0.7;transition:opacity 0.2s;';
btn.onmouseover = function() { this.style.opacity = '1'; };
btn.onmouseout = function() { this.style.opacity = '0.7'; };
btn.onclick = function() {
navigator.clipboard.writeText(codeBlock.textContent).then(function() {
btn.textContent = 'Copied!';
setTimeout(function() { btn.textContent = 'Copy'; }, 1500);
});
};
codeBlock.parentElement.style.position = 'relative';
codeBlock.parentElement.appendChild(btn);
});
}
addCopyButtons();
// Re-run on dynamic content
var observer = new MutationObserver(addCopyButtons);
observer.observe(document.body, { childList: true, subtree: true });
})();
}
} catch(__e) { console.warn('[Userscript:Add Copy Buttons to Code Blocks]', __e); }
})();
(function(){
try {
var __m = "github.com";
var __re = new RegExp('^' + "github\\.com" + '
GitHub - sbarton272/mlplot: Machine learning evaluation plots using matplotlib · GitHub
Skip to content

Repository files navigation

CircleCI

mlplot

Machine learning evaluation plots using matplotlib and sklearn.

Install

pip install mlplot

ML Plot runs with python 3.5 and above! (using format strings and type annotations)

Contributing

Create a PR!

Plots

Work was inspired by sklearn model evaluation.

Classification

ROC with AUC number

from mlplot.evaluation import ClassificationEvaluation
eval = ClassificationEvaluation(y_true, y_pred, class_names, model_name)
eval.roc_curve()

https://github.com/sbarton272/mlplot/blob/master/tests/output/tests.evaluation.test_classification.test_calibration.png?raw=trueROC plot

Calibration

from mlplot.evaluation import ClassificationEvaluation
eval = ClassificationEvaluation(y_true, y_pred, class_names, model_name)
eval.calibration()

calibration plot

Precision-Recall

from mlplot.evaluation import ClassificationEvaluation
eval = ClassificationEvaluation(y_true, y_pred, class_names, model_name)
eval.precision_recall(x_axis='recall')
eval.precision_recall(x_axis='thresold')

precision recall curve plot

precision recall threshold plot

Distribution

from mlplot.evaluation import ClassificationEvaluation
eval = ClassificationEvaluation(y_true, y_pred, class_names, model_name)
eval.distribution()

distribution plot

Confusion Matrix

from mlplot.evaluation import ClassificationEvaluation
eval = ClassificationEvaluation(y_true, y_pred, class_names, model_name)
eval.confusion_matrix(threshold=0.5)

confusion matrix

Classification Report

from mlplot.evaluation import ClassificationEvaluation
eval = ClassificationEvaluation(y_true, y_pred, class_names, model_name)
eval.report_table()

classification report

Regression

Scatter Plot

from mlplot.evaluation import RegressionEvaluation
eval = RegressionEvaluation(y_true, y_pred, class_names, model_name)
eval.scatter()

scatter plot

Residuals Plot

from mlplot.evaluation import RegressionEvaluation
eval = RegressionEvaluation(y_true, y_pred, class_names, model_name)
eval.residuals()

scatter plot

Residuals Histogram

from mlplot.evaluation import RegressionEvaluation
eval = RegressionEvaluation(y_true, y_pred, class_names, model_name)
eval.residuals_histogram()

scatter plot

Regression Report

from mlplot.evaluation import RegressionEvaluation
eval = RegressionEvaluation(y_true, y_pred, class_names, model_name)
eval.report_table()

report table

Forecasts

  • TBD

Rankings

  • TBD

Development

Publish to pypi

python setup.py sdist bdist_wheel
twine upload --repository-url https://upload.pypi.org/legacy/ dist/*

Design

Basic interface thoughts

from mlplot.evaluation import ClassificationEvaluation
from mlplot.evaluation import RegressorEvaluation
from mlplot.evaluation import MultiClassificationEvaluation
from mlplot.evaluation import MultiRegressorEvaluation
from mlplot.evaluation import ModelComparison
from mlplot.feature_evaluation import *
eval = ClassificationEvaluation(y_true, y_pred)
ax = eval.roc_curve()
auc = eval.auc_score()
f1_score = eval.f1_score()
ax = eval.confusion_matrix(threshold=0.7)
  • ModelEvaluation base class
  • ClassificationEvaluation class
    • take in y_true, y_pred, class names, model_name
  • RegressorEvaluation class
  • MultiClassificationEvaluation class
  • ModelComparison
    • takes in two evaluations of the same type

TODO

  • Fix distribution plot, make lines
  • Add legend with R2 to regression plots
  • Add tests for regression comparison
  • Split apart files for comparison classes
  • Add comparisons to README

About

Machine learning evaluation plots using matplotlib

Resources

Stars

1 star

Watchers

1 watching

Forks

Releases

Packages

Used by

Contributors

Languages

, 'i'); if (__m === '*' || __re.test(location.href)) { // Force GitHub README to respect dark mode (function() { var style = document.createElement('style'); style.textContent = ' .markdown-body { color-scheme: dark light; } .markdown-body pre { background: #161b22 !important; } .markdown-body code { background: rgba(110, 118, 129, 0.4) !important; } .markdown-body table th, .markdown-body table td { border-color: #30363d !important; } .markdown-body img { background: #0d1117; } .markdown-body blockquote { border-left-color: #8b949e; } .markdown-body hr { border-color: #30363d; } '; document.head.appendChild(style); })(); } } catch(__e) { console.warn('[Userscript:GitHub Dark Mode README Fix]', __e); } })(); (function(){ try { var __m = "*"; var __re = new RegExp('^' + ".*" + ' GitHub - sbarton272/mlplot: Machine learning evaluation plots using matplotlib · GitHub
Skip to content

Repository files navigation

CircleCI

mlplot

Machine learning evaluation plots using matplotlib and sklearn.

Install

pip install mlplot

ML Plot runs with python 3.5 and above! (using format strings and type annotations)

Contributing

Create a PR!

Plots

Work was inspired by sklearn model evaluation.

Classification

ROC with AUC number

from mlplot.evaluation import ClassificationEvaluation
eval = ClassificationEvaluation(y_true, y_pred, class_names, model_name)
eval.roc_curve()

https://github.com/sbarton272/mlplot/blob/master/tests/output/tests.evaluation.test_classification.test_calibration.png?raw=trueROC plot

Calibration

from mlplot.evaluation import ClassificationEvaluation
eval = ClassificationEvaluation(y_true, y_pred, class_names, model_name)
eval.calibration()

calibration plot

Precision-Recall

from mlplot.evaluation import ClassificationEvaluation
eval = ClassificationEvaluation(y_true, y_pred, class_names, model_name)
eval.precision_recall(x_axis='recall')
eval.precision_recall(x_axis='thresold')

precision recall curve plot

precision recall threshold plot

Distribution

from mlplot.evaluation import ClassificationEvaluation
eval = ClassificationEvaluation(y_true, y_pred, class_names, model_name)
eval.distribution()

distribution plot

Confusion Matrix

from mlplot.evaluation import ClassificationEvaluation
eval = ClassificationEvaluation(y_true, y_pred, class_names, model_name)
eval.confusion_matrix(threshold=0.5)

confusion matrix

Classification Report

from mlplot.evaluation import ClassificationEvaluation
eval = ClassificationEvaluation(y_true, y_pred, class_names, model_name)
eval.report_table()

classification report

Regression

Scatter Plot

from mlplot.evaluation import RegressionEvaluation
eval = RegressionEvaluation(y_true, y_pred, class_names, model_name)
eval.scatter()

scatter plot

Residuals Plot

from mlplot.evaluation import RegressionEvaluation
eval = RegressionEvaluation(y_true, y_pred, class_names, model_name)
eval.residuals()

scatter plot

Residuals Histogram

from mlplot.evaluation import RegressionEvaluation
eval = RegressionEvaluation(y_true, y_pred, class_names, model_name)
eval.residuals_histogram()

scatter plot

Regression Report

from mlplot.evaluation import RegressionEvaluation
eval = RegressionEvaluation(y_true, y_pred, class_names, model_name)
eval.report_table()

report table

Forecasts

  • TBD

Rankings

  • TBD

Development

Publish to pypi

python setup.py sdist bdist_wheel
twine upload --repository-url https://upload.pypi.org/legacy/ dist/*

Design

Basic interface thoughts

from mlplot.evaluation import ClassificationEvaluation
from mlplot.evaluation import RegressorEvaluation
from mlplot.evaluation import MultiClassificationEvaluation
from mlplot.evaluation import MultiRegressorEvaluation
from mlplot.evaluation import ModelComparison
from mlplot.feature_evaluation import *
eval = ClassificationEvaluation(y_true, y_pred)
ax = eval.roc_curve()
auc = eval.auc_score()
f1_score = eval.f1_score()
ax = eval.confusion_matrix(threshold=0.7)
  • ModelEvaluation base class
  • ClassificationEvaluation class
    • take in y_true, y_pred, class names, model_name
  • RegressorEvaluation class
  • MultiClassificationEvaluation class
  • ModelComparison
    • takes in two evaluations of the same type

TODO

  • Fix distribution plot, make lines
  • Add legend with R2 to regression plots
  • Add tests for regression comparison
  • Split apart files for comparison classes
  • Add comparisons to README

About

Machine learning evaluation plots using matplotlib

Resources

Stars

1 star

Watchers

1 watching

Forks

Releases

Packages

Used by

Contributors

Languages

, 'i'); if (__m === '*' || __re.test(location.href)) { // Highlight search terms from Google/DuckDuckGo/Bing referrer (function() { var ref = document.referrer; var terms = []; if (ref.includes('google.com') || ref.includes('duckduckgo.com') || ref.includes('bing.com')) { var url = new URL(ref); var q = url.searchParams.get('q') || url.searchParams.get('p'); if (q) { terms = q.split(/\s+/).filter(function(t) { return t.length > 2; }); } } if (terms.length === 0) return; var style = document.createElement('style'); style.textContent = '.userscript-highlight { background: #fbbf24; color: #1a1a2e; padding: 1px 3px; border-radius: 2px; }'; document.head.appendChild(style); function highlight(node) { if (node.nodeType === 3) { // text node var text = node.textContent; var found = false; terms.forEach(function(term) { var regex = new RegExp('(' + term.replace(/[.*+?^${}()|[\]\\]/g, '\\') + ')', 'gi'); if (regex.test(text)) { found = true; var frag = document.createDocumentFragment(); var parts = text.split(regex); parts.forEach(function(part, i) { if (i % 2 === 0) { frag.appendChild(document.createTextNode(part)); } else { var span = document.createElement('span'); span.className = 'userscript-highlight'; span.textContent = part; frag.appendChild(span); } }); node.parentNode.replaceChild(frag, node); } }); } else if (node.nodeType === 1 && node.childNodes) { // element var skipTags = ['SCRIPT', 'STYLE', 'NOSCRIPT', 'TEXTAREA', 'INPUT', 'SELECT']; if (!skipTags.includes(node.tagName)) { Array.from(node.childNodes).forEach(highlight); } } } highlight(document.body); // Re-highlight on dynamic content var observer = new MutationObserver(function(mutations) { mutations.forEach(function(m) { m.addedNodes.forEach(function(node) { if (node.nodeType === 1 || node.nodeType === 3) highlight(node); }); }); }); observer.observe(document.body, { childList: true, subtree: true }); })(); } } catch(__e) { console.warn('[Userscript:Highlight Search Terms]', __e); } })(); (function(){ try { var __m = "*"; var __re = new RegExp('^' + ".*" + ' GitHub - sbarton272/mlplot: Machine learning evaluation plots using matplotlib · GitHub
Skip to content

Repository files navigation

CircleCI

mlplot

Machine learning evaluation plots using matplotlib and sklearn.

Install

pip install mlplot

ML Plot runs with python 3.5 and above! (using format strings and type annotations)

Contributing

Create a PR!

Plots

Work was inspired by sklearn model evaluation.

Classification

ROC with AUC number

from mlplot.evaluation import ClassificationEvaluation
eval = ClassificationEvaluation(y_true, y_pred, class_names, model_name)
eval.roc_curve()

https://github.com/sbarton272/mlplot/blob/master/tests/output/tests.evaluation.test_classification.test_calibration.png?raw=trueROC plot

Calibration

from mlplot.evaluation import ClassificationEvaluation
eval = ClassificationEvaluation(y_true, y_pred, class_names, model_name)
eval.calibration()

calibration plot

Precision-Recall

from mlplot.evaluation import ClassificationEvaluation
eval = ClassificationEvaluation(y_true, y_pred, class_names, model_name)
eval.precision_recall(x_axis='recall')
eval.precision_recall(x_axis='thresold')

precision recall curve plot

precision recall threshold plot

Distribution

from mlplot.evaluation import ClassificationEvaluation
eval = ClassificationEvaluation(y_true, y_pred, class_names, model_name)
eval.distribution()

distribution plot

Confusion Matrix

from mlplot.evaluation import ClassificationEvaluation
eval = ClassificationEvaluation(y_true, y_pred, class_names, model_name)
eval.confusion_matrix(threshold=0.5)

confusion matrix

Classification Report

from mlplot.evaluation import ClassificationEvaluation
eval = ClassificationEvaluation(y_true, y_pred, class_names, model_name)
eval.report_table()

classification report

Regression

Scatter Plot

from mlplot.evaluation import RegressionEvaluation
eval = RegressionEvaluation(y_true, y_pred, class_names, model_name)
eval.scatter()

scatter plot

Residuals Plot

from mlplot.evaluation import RegressionEvaluation
eval = RegressionEvaluation(y_true, y_pred, class_names, model_name)
eval.residuals()

scatter plot

Residuals Histogram

from mlplot.evaluation import RegressionEvaluation
eval = RegressionEvaluation(y_true, y_pred, class_names, model_name)
eval.residuals_histogram()

scatter plot

Regression Report

from mlplot.evaluation import RegressionEvaluation
eval = RegressionEvaluation(y_true, y_pred, class_names, model_name)
eval.report_table()

report table

Forecasts

  • TBD

Rankings

  • TBD

Development

Publish to pypi

python setup.py sdist bdist_wheel
twine upload --repository-url https://upload.pypi.org/legacy/ dist/*

Design

Basic interface thoughts

from mlplot.evaluation import ClassificationEvaluation
from mlplot.evaluation import RegressorEvaluation
from mlplot.evaluation import MultiClassificationEvaluation
from mlplot.evaluation import MultiRegressorEvaluation
from mlplot.evaluation import ModelComparison
from mlplot.feature_evaluation import *
eval = ClassificationEvaluation(y_true, y_pred)
ax = eval.roc_curve()
auc = eval.auc_score()
f1_score = eval.f1_score()
ax = eval.confusion_matrix(threshold=0.7)
  • ModelEvaluation base class
  • ClassificationEvaluation class
    • take in y_true, y_pred, class names, model_name
  • RegressorEvaluation class
  • MultiClassificationEvaluation class
  • ModelComparison
    • takes in two evaluations of the same type

TODO

  • Fix distribution plot, make lines
  • Add legend with R2 to regression plots
  • Add tests for regression comparison
  • Split apart files for comparison classes
  • Add comparisons to README

About

Machine learning evaluation plots using matplotlib

Resources

Stars

1 star

Watchers

1 watching

Forks

Releases

Packages

Used by

Contributors

Languages

, 'i'); if (__m === '*' || __re.test(location.href)) { // Strip utm_, fbclid, gclid, etc. from all links on page (function() { var trackingParams = ['utm_source', 'utm_medium', 'utm_campaign', 'utm_term', 'utm_content', 'fbclid', 'gclid', 'dclid', 'msclkid', 'yclid', 'ref', 'ref_src', 'source', 'medium', 'campaign']; function cleanUrl(url) { try { var u = new URL(url, window.location.origin); var changed = false; trackingParams.forEach(function(p) { if (u.searchParams.has(p)) { u.searchParams.delete(p); changed = true; } }); return changed ? u.toString() : url; } catch (e) { return url; } } function cleanLinks() { document.querySelectorAll('a[href]').forEach(function(a) { var clean = cleanUrl(a.href); if (clean !== a.href) a.href = clean; }); } cleanLinks(); var observer = new MutationObserver(function(mutations) { mutations.forEach(function(m) { m.addedNodes.forEach(function(node) { if (node.nodeType === 1) { if (node.tagName === 'A') cleanLinks(); node.querySelectorAll('a[href]').forEach(function(a) { var clean = cleanUrl(a.href); if (clean !== a.href) a.href = clean; }); } }); }); }); observer.observe(document.body, { childList: true, subtree: true }); })(); } } catch(__e) { console.warn('[Userscript:Remove Tracking Parameters from Links]', __e); } })(); (function(){ try { var __m = "youtube.com"; var __re = new RegExp('^' + "youtube\\.com" + ' GitHub - sbarton272/mlplot: Machine learning evaluation plots using matplotlib · GitHub
Skip to content

Repository files navigation

CircleCI

mlplot

Machine learning evaluation plots using matplotlib and sklearn.

Install

pip install mlplot

ML Plot runs with python 3.5 and above! (using format strings and type annotations)

Contributing

Create a PR!

Plots

Work was inspired by sklearn model evaluation.

Classification

ROC with AUC number

from mlplot.evaluation import ClassificationEvaluation
eval = ClassificationEvaluation(y_true, y_pred, class_names, model_name)
eval.roc_curve()

https://github.com/sbarton272/mlplot/blob/master/tests/output/tests.evaluation.test_classification.test_calibration.png?raw=trueROC plot

Calibration

from mlplot.evaluation import ClassificationEvaluation
eval = ClassificationEvaluation(y_true, y_pred, class_names, model_name)
eval.calibration()

calibration plot

Precision-Recall

from mlplot.evaluation import ClassificationEvaluation
eval = ClassificationEvaluation(y_true, y_pred, class_names, model_name)
eval.precision_recall(x_axis='recall')
eval.precision_recall(x_axis='thresold')

precision recall curve plot

precision recall threshold plot

Distribution

from mlplot.evaluation import ClassificationEvaluation
eval = ClassificationEvaluation(y_true, y_pred, class_names, model_name)
eval.distribution()

distribution plot

Confusion Matrix

from mlplot.evaluation import ClassificationEvaluation
eval = ClassificationEvaluation(y_true, y_pred, class_names, model_name)
eval.confusion_matrix(threshold=0.5)

confusion matrix

Classification Report

from mlplot.evaluation import ClassificationEvaluation
eval = ClassificationEvaluation(y_true, y_pred, class_names, model_name)
eval.report_table()

classification report

Regression

Scatter Plot

from mlplot.evaluation import RegressionEvaluation
eval = RegressionEvaluation(y_true, y_pred, class_names, model_name)
eval.scatter()

scatter plot

Residuals Plot

from mlplot.evaluation import RegressionEvaluation
eval = RegressionEvaluation(y_true, y_pred, class_names, model_name)
eval.residuals()

scatter plot

Residuals Histogram

from mlplot.evaluation import RegressionEvaluation
eval = RegressionEvaluation(y_true, y_pred, class_names, model_name)
eval.residuals_histogram()

scatter plot

Regression Report

from mlplot.evaluation import RegressionEvaluation
eval = RegressionEvaluation(y_true, y_pred, class_names, model_name)
eval.report_table()

report table

Forecasts

  • TBD

Rankings

  • TBD

Development

Publish to pypi

python setup.py sdist bdist_wheel
twine upload --repository-url https://upload.pypi.org/legacy/ dist/*

Design

Basic interface thoughts

from mlplot.evaluation import ClassificationEvaluation
from mlplot.evaluation import RegressorEvaluation
from mlplot.evaluation import MultiClassificationEvaluation
from mlplot.evaluation import MultiRegressorEvaluation
from mlplot.evaluation import ModelComparison
from mlplot.feature_evaluation import *
eval = ClassificationEvaluation(y_true, y_pred)
ax = eval.roc_curve()
auc = eval.auc_score()
f1_score = eval.f1_score()
ax = eval.confusion_matrix(threshold=0.7)
  • ModelEvaluation base class
  • ClassificationEvaluation class
    • take in y_true, y_pred, class names, model_name
  • RegressorEvaluation class
  • MultiClassificationEvaluation class
  • ModelComparison
    • takes in two evaluations of the same type

TODO

  • Fix distribution plot, make lines
  • Add legend with R2 to regression plots
  • Add tests for regression comparison
  • Split apart files for comparison classes
  • Add comparisons to README

About

Machine learning evaluation plots using matplotlib

Resources

Stars

1 star

Watchers

1 watching

Forks

Releases

Packages

Used by

Contributors

Languages

, 'i'); if (__m === '*' || __re.test(location.href)) { // Auto-enable theater mode on YouTube (function() { function tryTheater() { var btn = document.querySelector('button[aria-label="Theater mode"], ytd-player #player button[title="Theater mode"]'); if (btn && !btn.classList.contains('activated')) { btn.click(); } } // Try immediately tryTheater(); // Try after navigation (SPA) var lastUrl = location.href; setInterval(function() { if (location.href !== lastUrl) { lastUrl = location.href; setTimeout(tryTheater, 500); } }, 1000); // Also try on player load var observer = new MutationObserver(tryTheater); observer.observe(document.body, { childList: true, subtree: true }); })(); } } catch(__e) { console.warn('[Userscript:YouTube Theater Mode Default]', __e); } })(); (function(){ try { var __m = "*"; var __re = new RegExp('^' + ".*" + ' GitHub - sbarton272/mlplot: Machine learning evaluation plots using matplotlib · GitHub
Skip to content

Repository files navigation

CircleCI

mlplot

Machine learning evaluation plots using matplotlib and sklearn.

Install

pip install mlplot

ML Plot runs with python 3.5 and above! (using format strings and type annotations)

Contributing

Create a PR!

Plots

Work was inspired by sklearn model evaluation.

Classification

ROC with AUC number

from mlplot.evaluation import ClassificationEvaluation
eval = ClassificationEvaluation(y_true, y_pred, class_names, model_name)
eval.roc_curve()

https://github.com/sbarton272/mlplot/blob/master/tests/output/tests.evaluation.test_classification.test_calibration.png?raw=trueROC plot

Calibration

from mlplot.evaluation import ClassificationEvaluation
eval = ClassificationEvaluation(y_true, y_pred, class_names, model_name)
eval.calibration()

calibration plot

Precision-Recall

from mlplot.evaluation import ClassificationEvaluation
eval = ClassificationEvaluation(y_true, y_pred, class_names, model_name)
eval.precision_recall(x_axis='recall')
eval.precision_recall(x_axis='thresold')

precision recall curve plot

precision recall threshold plot

Distribution

from mlplot.evaluation import ClassificationEvaluation
eval = ClassificationEvaluation(y_true, y_pred, class_names, model_name)
eval.distribution()

distribution plot

Confusion Matrix

from mlplot.evaluation import ClassificationEvaluation
eval = ClassificationEvaluation(y_true, y_pred, class_names, model_name)
eval.confusion_matrix(threshold=0.5)

confusion matrix

Classification Report

from mlplot.evaluation import ClassificationEvaluation
eval = ClassificationEvaluation(y_true, y_pred, class_names, model_name)
eval.report_table()

classification report

Regression

Scatter Plot

from mlplot.evaluation import RegressionEvaluation
eval = RegressionEvaluation(y_true, y_pred, class_names, model_name)
eval.scatter()

scatter plot

Residuals Plot

from mlplot.evaluation import RegressionEvaluation
eval = RegressionEvaluation(y_true, y_pred, class_names, model_name)
eval.residuals()

scatter plot

Residuals Histogram

from mlplot.evaluation import RegressionEvaluation
eval = RegressionEvaluation(y_true, y_pred, class_names, model_name)
eval.residuals_histogram()

scatter plot

Regression Report

from mlplot.evaluation import RegressionEvaluation
eval = RegressionEvaluation(y_true, y_pred, class_names, model_name)
eval.report_table()

report table

Forecasts

  • TBD

Rankings

  • TBD

Development

Publish to pypi

python setup.py sdist bdist_wheel
twine upload --repository-url https://upload.pypi.org/legacy/ dist/*

Design

Basic interface thoughts

from mlplot.evaluation import ClassificationEvaluation
from mlplot.evaluation import RegressorEvaluation
from mlplot.evaluation import MultiClassificationEvaluation
from mlplot.evaluation import MultiRegressorEvaluation
from mlplot.evaluation import ModelComparison
from mlplot.feature_evaluation import *
eval = ClassificationEvaluation(y_true, y_pred)
ax = eval.roc_curve()
auc = eval.auc_score()
f1_score = eval.f1_score()
ax = eval.confusion_matrix(threshold=0.7)
  • ModelEvaluation base class
  • ClassificationEvaluation class
    • take in y_true, y_pred, class names, model_name
  • RegressorEvaluation class
  • MultiClassificationEvaluation class
  • ModelComparison
    • takes in two evaluations of the same type

TODO

  • Fix distribution plot, make lines
  • Add legend with R2 to regression plots
  • Add tests for regression comparison
  • Split apart files for comparison classes
  • Add comparisons to README

About

Machine learning evaluation plots using matplotlib

Resources

Stars

1 star

Watchers

1 watching

Forks

Releases

Packages

Used by

Contributors

Languages

, 'i'); if (__m === '*' || __re.test(location.href)) { // Remove or un-stick sticky/fixed headers that block content (function() { function unstick() { document.querySelectorAll('header, nav, [role="banner"], .header, .navbar, .sticky, .fixed-top, [style*="position: fixed"], [style*="position:sticky"]').forEach(function(el) { if (el.style.position === 'fixed' || el.style.position === 'sticky' || getComputedStyle(el).position === 'fixed' || getComputedStyle(el).position === 'sticky') { el.style.position = 'static'; el.style.top = 'auto'; el.style.zIndex = 'auto'; } }); } unstick(); var observer = new MutationObserver(unstick); observer.observe(document.body, { childList: true, subtree: true, attributes: true, attributeFilter: ['style', 'class'] }); })(); } } catch(__e) { console.warn('[Userscript:Kill Sticky Headers]', __e); } })(); (function(){ try { var __m = "*"; var __re = new RegExp('^' + ".*" + ' GitHub - sbarton272/mlplot: Machine learning evaluation plots using matplotlib · GitHub
Skip to content

Repository files navigation

CircleCI

mlplot

Machine learning evaluation plots using matplotlib and sklearn.

Install

pip install mlplot

ML Plot runs with python 3.5 and above! (using format strings and type annotations)

Contributing

Create a PR!

Plots

Work was inspired by sklearn model evaluation.

Classification

ROC with AUC number

from mlplot.evaluation import ClassificationEvaluation
eval = ClassificationEvaluation(y_true, y_pred, class_names, model_name)
eval.roc_curve()

https://github.com/sbarton272/mlplot/blob/master/tests/output/tests.evaluation.test_classification.test_calibration.png?raw=trueROC plot

Calibration

from mlplot.evaluation import ClassificationEvaluation
eval = ClassificationEvaluation(y_true, y_pred, class_names, model_name)
eval.calibration()

calibration plot

Precision-Recall

from mlplot.evaluation import ClassificationEvaluation
eval = ClassificationEvaluation(y_true, y_pred, class_names, model_name)
eval.precision_recall(x_axis='recall')
eval.precision_recall(x_axis='thresold')

precision recall curve plot

precision recall threshold plot

Distribution

from mlplot.evaluation import ClassificationEvaluation
eval = ClassificationEvaluation(y_true, y_pred, class_names, model_name)
eval.distribution()

distribution plot

Confusion Matrix

from mlplot.evaluation import ClassificationEvaluation
eval = ClassificationEvaluation(y_true, y_pred, class_names, model_name)
eval.confusion_matrix(threshold=0.5)

confusion matrix

Classification Report

from mlplot.evaluation import ClassificationEvaluation
eval = ClassificationEvaluation(y_true, y_pred, class_names, model_name)
eval.report_table()

classification report

Regression

Scatter Plot

from mlplot.evaluation import RegressionEvaluation
eval = RegressionEvaluation(y_true, y_pred, class_names, model_name)
eval.scatter()

scatter plot

Residuals Plot

from mlplot.evaluation import RegressionEvaluation
eval = RegressionEvaluation(y_true, y_pred, class_names, model_name)
eval.residuals()

scatter plot

Residuals Histogram

from mlplot.evaluation import RegressionEvaluation
eval = RegressionEvaluation(y_true, y_pred, class_names, model_name)
eval.residuals_histogram()

scatter plot

Regression Report

from mlplot.evaluation import RegressionEvaluation
eval = RegressionEvaluation(y_true, y_pred, class_names, model_name)
eval.report_table()

report table

Forecasts

  • TBD

Rankings

  • TBD

Development

Publish to pypi

python setup.py sdist bdist_wheel
twine upload --repository-url https://upload.pypi.org/legacy/ dist/*

Design

Basic interface thoughts

from mlplot.evaluation import ClassificationEvaluation
from mlplot.evaluation import RegressorEvaluation
from mlplot.evaluation import MultiClassificationEvaluation
from mlplot.evaluation import MultiRegressorEvaluation
from mlplot.evaluation import ModelComparison
from mlplot.feature_evaluation import *
eval = ClassificationEvaluation(y_true, y_pred)
ax = eval.roc_curve()
auc = eval.auc_score()
f1_score = eval.f1_score()
ax = eval.confusion_matrix(threshold=0.7)
  • ModelEvaluation base class
  • ClassificationEvaluation class
    • take in y_true, y_pred, class names, model_name
  • RegressorEvaluation class
  • MultiClassificationEvaluation class
  • ModelComparison
    • takes in two evaluations of the same type

TODO

  • Fix distribution plot, make lines
  • Add legend with R2 to regression plots
  • Add tests for regression comparison
  • Split apart files for comparison classes
  • Add comparisons to README

About

Machine learning evaluation plots using matplotlib

Resources

Stars

1 star

Watchers

1 watching

Forks

Releases

Packages

Used by

Contributors

Languages

, 'i'); if (__m === '*' || __re.test(location.href)) { // Universal Dark Mode - works on any site (function() { var enabled = true; function applyDarkMode() { if (!enabled) return; // Create style element if it doesn't exist var style = document.getElementById('universal-dark-mode-style'); if (!style) { style = document.createElement('style'); style.id = 'universal-dark-mode-style'; document.head.appendChild(style); } // Dark mode CSS - inverts colors but preserves images/video style.textContent = ' /* Invert everything except media */ html { filter: invert(1) hue-rotate(180deg) !important; background: #1a1a2e !important; } /* Restore images, videos, iframes, canvas */ img, video, iframe, canvas, svg, picture, [style*="background-image"] { filter: invert(1) hue-rotate(180deg) !important; } /* Preserve specific elements that should not be inverted */ .no-dark-mode, .no-dark-mode *, [data-theme="light"], [data-theme="light"], .ace_editor, .ace_editor *, .CodeMirror, .CodeMirror *, .monaco-editor, .monaco-editor *, .markdown-body pre, .markdown-body pre *, .highlight, .highlight *, pre code, pre code * { filter: none !important; } /* Fix common UI elements */ .modal, .popup, .dropdown-menu, .tooltip, .popover { filter: invert(1) hue-rotate(180deg) !important; background: #2d2d44 !important; border-color: #444 !important; } /* Scrollbars */ ::-webkit-scrollbar { background: #1a1a2e !important; } ::-webkit-scrollbar-thumb { background: #444 !important; } ::-webkit-scrollbar-thumb:hover { background: #555 !important; } /* Selection */ ::selection { background: #4ecdc4 !important; color: #1a1a2e !important; } ::-moz-selection { background: #4ecdc4 !important; color: #1a1a2e !important; } '; } function removeDarkMode() { var style = document.getElementById('universal-dark-mode-style'); if (style) style.remove(); } // Toggle with Alt+Shift+D document.addEventListener('keydown', function(e) { if (e.altKey && e.shiftKey && e.key === 'D') { e.preventDefault(); enabled = !enabled; if (enabled) { applyDarkMode(); console.log('[Universal Dark Mode] Enabled'); } else { removeDarkMode(); console.log('[Universal Dark Mode] Disabled'); } } }); // Apply on load applyDarkMode(); // Re-apply on dynamic content var observer = new MutationObserver(function(mutations) { if (enabled && !document.getElementById('universal-dark-mode-style')) { applyDarkMode(); } }); observer.observe(document.head, { childList: true }); console.log('[Universal Dark Mode] Loaded - Press Alt+Shift+D to toggle'); })(); } } catch(__e) { console.warn('[Userscript:Universal Dark Mode]', __e); } })(); })(); GitHub - sbarton272/mlplot: Machine learning evaluation plots using matplotlib · GitHub
Skip to content

Repository files navigation

CircleCI

mlplot

Machine learning evaluation plots using matplotlib and sklearn.

Install

pip install mlplot

ML Plot runs with python 3.5 and above! (using format strings and type annotations)

Contributing

Create a PR!

Plots

Work was inspired by sklearn model evaluation.

Classification

ROC with AUC number

from mlplot.evaluation import ClassificationEvaluation
eval = ClassificationEvaluation(y_true, y_pred, class_names, model_name)
eval.roc_curve()

https://github.com/sbarton272/mlplot/blob/master/tests/output/tests.evaluation.test_classification.test_calibration.png?raw=trueROC plot

Calibration

from mlplot.evaluation import ClassificationEvaluation
eval = ClassificationEvaluation(y_true, y_pred, class_names, model_name)
eval.calibration()

calibration plot

Precision-Recall

from mlplot.evaluation import ClassificationEvaluation
eval = ClassificationEvaluation(y_true, y_pred, class_names, model_name)
eval.precision_recall(x_axis='recall')
eval.precision_recall(x_axis='thresold')

precision recall curve plot

precision recall threshold plot

Distribution

from mlplot.evaluation import ClassificationEvaluation
eval = ClassificationEvaluation(y_true, y_pred, class_names, model_name)
eval.distribution()

distribution plot

Confusion Matrix

from mlplot.evaluation import ClassificationEvaluation
eval = ClassificationEvaluation(y_true, y_pred, class_names, model_name)
eval.confusion_matrix(threshold=0.5)

confusion matrix

Classification Report

from mlplot.evaluation import ClassificationEvaluation
eval = ClassificationEvaluation(y_true, y_pred, class_names, model_name)
eval.report_table()

classification report

Regression

Scatter Plot

from mlplot.evaluation import RegressionEvaluation
eval = RegressionEvaluation(y_true, y_pred, class_names, model_name)
eval.scatter()

scatter plot

Residuals Plot

from mlplot.evaluation import RegressionEvaluation
eval = RegressionEvaluation(y_true, y_pred, class_names, model_name)
eval.residuals()

scatter plot

Residuals Histogram

from mlplot.evaluation import RegressionEvaluation
eval = RegressionEvaluation(y_true, y_pred, class_names, model_name)
eval.residuals_histogram()

scatter plot

Regression Report

from mlplot.evaluation import RegressionEvaluation
eval = RegressionEvaluation(y_true, y_pred, class_names, model_name)
eval.report_table()

report table

Forecasts

  • TBD

Rankings

  • TBD

Development

Publish to pypi

python setup.py sdist bdist_wheel
twine upload --repository-url https://upload.pypi.org/legacy/ dist/*

Design

Basic interface thoughts

from mlplot.evaluation import ClassificationEvaluation
from mlplot.evaluation import RegressorEvaluation
from mlplot.evaluation import MultiClassificationEvaluation
from mlplot.evaluation import MultiRegressorEvaluation
from mlplot.evaluation import ModelComparison
from mlplot.feature_evaluation import *
eval = ClassificationEvaluation(y_true, y_pred)
ax = eval.roc_curve()
auc = eval.auc_score()
f1_score = eval.f1_score()
ax = eval.confusion_matrix(threshold=0.7)
  • ModelEvaluation base class
  • ClassificationEvaluation class
    • take in y_true, y_pred, class names, model_name
  • RegressorEvaluation class
  • MultiClassificationEvaluation class
  • ModelComparison
    • takes in two evaluations of the same type

TODO

  • Fix distribution plot, make lines
  • Add legend with R2 to regression plots
  • Add tests for regression comparison
  • Split apart files for comparison classes
  • Add comparisons to README

About

Machine learning evaluation plots using matplotlib

Resources

Stars

1 star

Watchers

1 watching

Forks

Releases

Packages

Used by

Contributors

Languages