A GUI-based, Python quantitative research kernel for indicator computation, strategy signal generation, and multi-ticker visualization.





Quant-Kernel is built around explicit pipelines, deterministic execution, and a strict separation between computation and rendering.
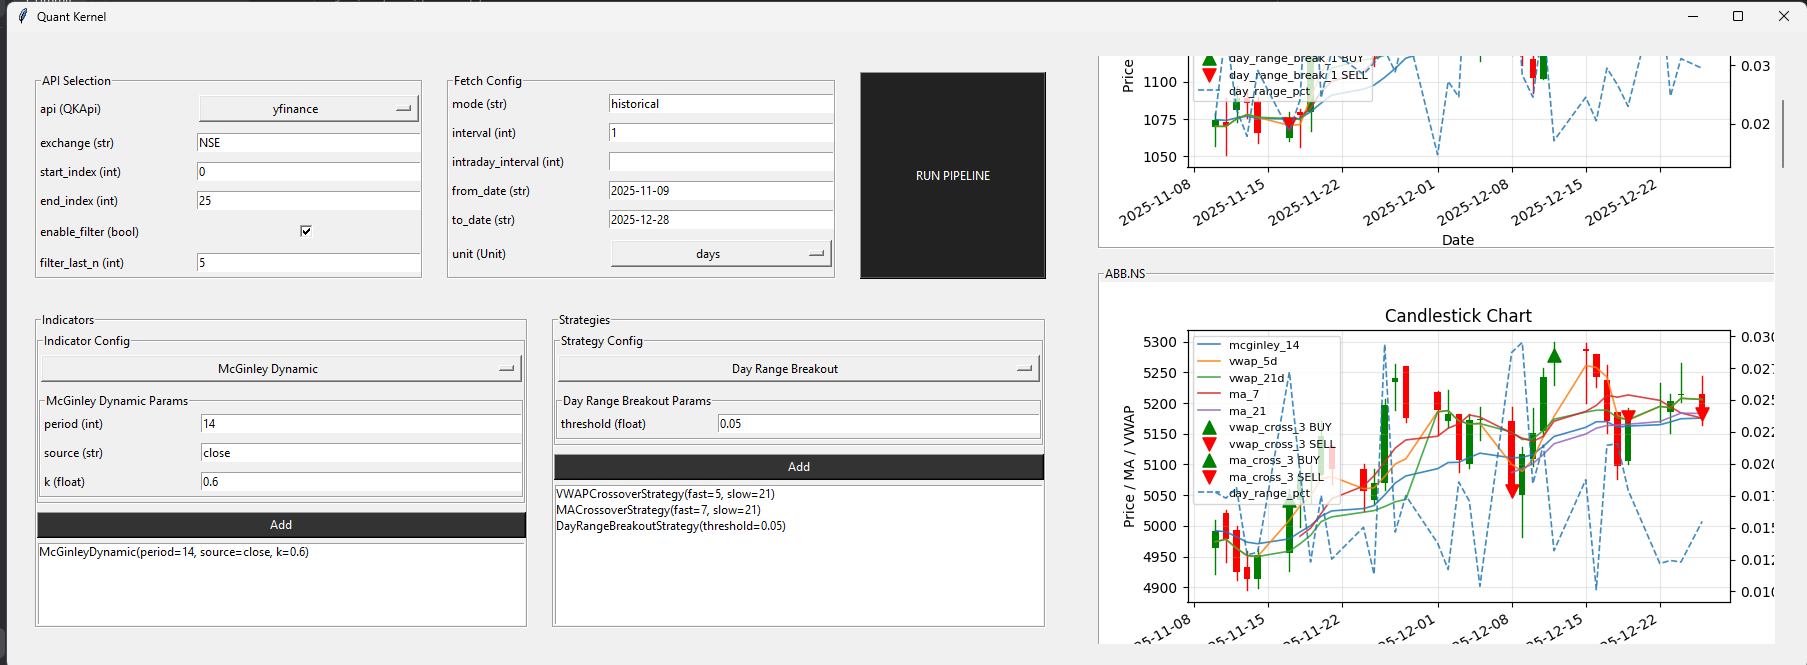
git clone https://github.com/th-efool/Quant-Kernel
cd Quant-Kernel
pip install -r requirements.txt
python app/app.py
Execution flow:
Market Data → Indicators → Strategies → Signals → Renderer
Each stage is isolated and replaceable.
data/
├─ QKHistoricalData # API + ticker orchestration
├─ historical_data/
│ ├─ fetcher_yfinance.py
│ ├─ fetcher_upstox.py
│ └─ fetcher_dhan.py
indicators/
├─ IndicatorBase # Pure feature generators
├─ IndicatorManager # Deduplication + execution
strategies/
├─ StrategyBase # Signal contracts
├─ StrategyManager # Strategy orchestration
gui/
├─ components/ # UI building blocks
├─ layout/ # Row / Column layout engine
├─ views/ # Screen composition
└─ QKRenderer.py # Tk bootstrap + render loop
engine/
└─ app_controller.py # Execution glue
- Multi-API support: Yahoo Finance, Upstox, Dhan
- Configurable date ranges and time units
- Batch ticker loading with index-range selection (e.g. 0–10, 11–20)
- Deterministic, repeatable data fetches
- Pure, side-effect-free indicator implementations
- Indicators run exactly once per configuration
- Structural deduplication via
IndicatorManager - Multiple parameterized instances supported simultaneously
- Explicit strategy contracts (
BUY / SELL / HOLD) - Strategies declare required indicators (no hidden dependencies)
- Multiple strategies can coexist without column collisions
- Signal columns are uniquely namespaced per strategy instance
- Optional last-N candle signal filtering
- Render only tickers that emit BUY or SELL in the recent window
- Skips non-qualifying tickers before rendering to save resources
- Designed for large-scale scanning workflows
- Component-driven Tkinter UI (no monolithic screens)
- Typed parameter inputs with validation
- Incremental, non-blocking rendering (background execution)
- One chart per ticker, stacked vertically
- Scrollable multi-ticker chart view
- Indicator overlays and signal markers rendered per chart
- Strict separation: Data → Indicators → Strategies → Renderer
- Renderer consumes final DataFrames only
- Layout engine (Row / Column / Panel) independent of components
- Headless-friendly core (GUI is optional, not required)
No hidden global state
No framework magic
Everything inspectable, overrideable, and composable
Suitable for:
- research
- batch scanning
- backtesting (planned)
- execution adapters (future)
Responsible only for market data acquisition.
Handles:
- API selection (
yfinance,upstox,dhan) - Date ranges and units
- Ticker resolution (including batch ranges)
data=QKHistoricalData(api=QKApi.yfinance)
df=data.fetch_historical("RELIANCE")
This layer never knows about indicators, strategies, or charts.
Indicators are pure feature generators.
Rules:
- Input: full
DataFrame - Output: aligned
pd.Series - No side effects
classMovingAverage(IndicatorBase):
defcompute(self, df):
return {
"ma_21": df["close"].rolling(21).mean()
}
Indicators do not:
- generate signals
- know about plotting
- know about strategies
Responsibilities:
- Deduplicate indicators by configuration
- Execute each indicator exactly once
- Inject outputs into the DataFrame
manager.add(MovingAverage(21))
manager.add(MovingAverage(21)) # deduplicatedStrategies:
- Declare required indicators
- Convert indicators → signals
- Output
Signal.BUY / SELL / HOLD
classMACrossoverStrategy(StrategyBase):
defindicators(self):
return [MovingAverage(7), MovingAverage(21)]
defcompute(self, df):
...
Each strategy instance produces its own signal column, allowing multiple parameterized strategies safely.
Responsibilities:
- Register strategies
- Collect required indicators
- Execute indicators first
- Execute strategies second
strategy_mgr=StrategyManager()
strategy_mgr.add(MACrossoverStrategy(7, 21))
df=strategy_mgr.run(df)
No rendering. No execution. Only signal generation.
Quant-Kernel includes a modular, component-driven Tkinter renderer focused purely on visualization.
The GUI layer:
- never fetches data
- never computes indicators
- never generates signals
It consumes final DataFrames only.
gui/
├─ components/
│ ├─ base_ui_component.py # UIComponent contract
│ ├─ param_input.py # Typed parameter forms
│ ├─ select_and_configure.py # Class + params selector
│ ├─ add_to_list.py # Multi-instance aggregation
│ ├─ stock_chart.py # Single-ticker chart
│ └─ market_chart_view.py # Scrollable multi-chart view
│
├─ layout/
│ ├─ row.py # Horizontal layout
│ ├─ column.py # Vertical layout
│ └─ panel.py # Size-constrained containers
│
├─ views/
│ └─ main_view.py # UI composition only
│
└─ QKRenderer.py # Tk bootstrap + layout build
The renderer does not:
- decide what to fetch
- decide what to compute
- interpret signals
It only:
- builds UI components
- manages layout and scrolling
- renders charts from DataFrames
- appends charts incrementally
Each ticker renders into:
one ticker → one chart → one matplotlib figure
No shared axes. No hidden state.
User Input
↓
AppController.run_pipeline(ticker)
↓
DataFrame (OHLC + indicators + signals)
↓
MarketChartView.append_data()
↓
StockChartComponent.render()
Charts can be:
- skipped via signal filters
- appended incrementally
- rendered without blocking the UI thread
AppController is the only layer that touches both computation and rendering.
data_manager=QKHistoricalData()
strategy_manager=StrategyManager()
controller=AppController(data_manager, strategy_manager)
It:
- applies fetch configuration
- switches APIs
- runs indicator + strategy pipelines
- returns final DataFrames to the renderer
- Data describes markets
- Indicators describe features
- Strategies describe signals
- Renderer describes presentation
Quant-Kernel keeps these layers deliberately separate to remain inspectable, extensible, and predictable.
If you want next:
- a short “Features” section
- or a separate
docs/gui_architecture.md
say the word.