NOTE: I have not been able to maintain this repo. Recommend switching to Victory Charts.
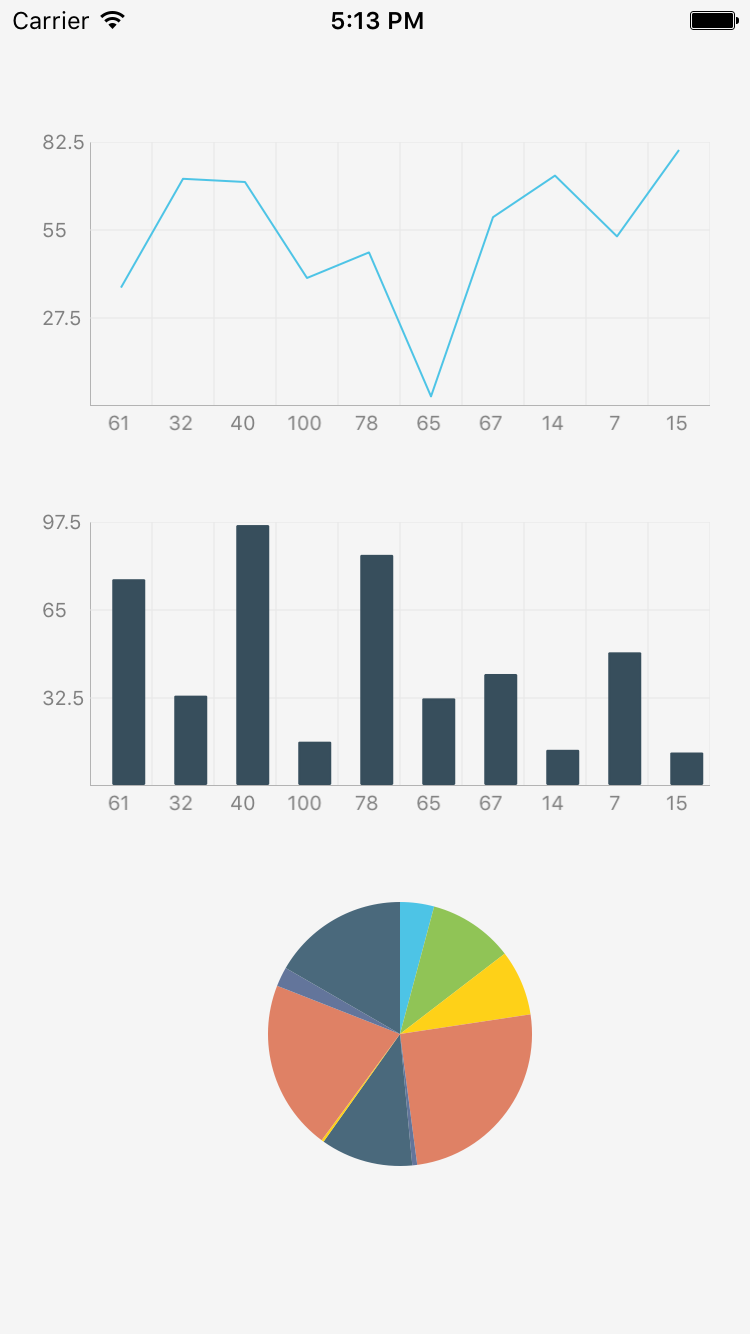

npm i react-native-chart --save
Link ART to your project
- Right click Libraries and click 'Add Files to {YourProject}'

- Navigate to your project's node_modules/react-native/Libraries/ART and select 'ART.xcodeproj'

- Go to Build Phases -> Link Binary With Libraries

4 Click the '+', and add libART.a

Then rebuild.
importReact,{StyleSheet,View,Component}from'react-native';importChartfrom'react-native-chart';conststyles=StyleSheet.create({container: {flex: 1,justifyContent: 'center',alignItems: 'center',backgroundColor: 'white',},chart: {width: 200,height: 200,},});constdata=[[[0,1],[1,3],[3,7],[4,9],]];classSimpleChartextendsComponent{render(){return(<Viewstyle={styles.container}><Chartstyle={styles.chart}data={data}verticalGridStep={5}type="line"showDataPoint={true}color={['#e1cd00']}/></View>);}}Use '' y-values to signify the 'render but empty' data points.
| Property | Type | Description | Required | Default |
|---|---|---|---|---|
| data | Array< Array< [number, number] > > | An array of arrays of [x, y] pairs. | Yes | |
| type | string | pie/bar/line | Yes | bar |
| color | Array < string > | Color of bars/line in line chart | No | #4DC4E6 |
| cornerRadius | number | Corner radius of bars in bar chart | No | 0 |
| fillColor | Array < string > | Fill area colors in line chart | No | |
| dataPointColor | Array < string > | Stroke colors for line chart data point | No | |
| dataPointFillColor | Array < string > | Fill colors for line chart data point | No | |
| dataPointRadius | number | Radius of the data point | No | 3 |
| lineWidth | number | Width of line chart line | No | 1 |
| showDataPoint | boolean | Show data points on line chart | No | false |
| sliceColors | Array < string > | Array of colors for pie chart slices | Yes | [ < random colors > ] |
| axisColor | string | Color of axis lines | No | #333333 |
| axisLabelColor | string | Color of axis test | No | #333333 |
| axisLineWidth | number | Width of axis lines | No | 1 |
| gridColor | string | Color of grid lines | No | #333333 |
| gridLineWidth | number | Width of grid lines | No | 0.5 |
| hideHorizontalGridLines | boolean | Hide grid lines going from LTR | No | false |
| hideVerticalGridLines | boolean | Hide grid lines going up -> down | No | false |
| showAxis | boolean | Show the X and Y axes | No | true |
| showGrid | boolean | Show the grid | No | true |
| showXAxisLabels | boolean | Show X-Axis labels | No | true |
| showYAxisLabels | boolean | Show Y-Axis labels | No | true |
| style | object | Style on the container | No | {} |
| tightBounds | boolean | Tighten min and max bounds strictly to min/max in dataset | No | false |
| verticalGridStep | number | How many vertical grid lines to show | No | 4 |
| horizontalGridStep | number | How many horizontal grid lines to show | No | all |
| xAxisHeight | number | Height of X-axis container | No | 20 |
| yAxisTransform | Function | Transform data point to y-axis label | No | (_) => _ |
| xAxisTransform | Function | Transform data point to x-axis label | No | (_) => _ |
| yAxisWidth | number | Width of the Y-axis container | No | 30 |
| yAxisUseDecimal | boolean | Show decimals on Y-axis labels | No | false |
| yAxisShortLabel | boolean | Shorten yAxis labels with K, M, B for thousand<->billion, etc | No | false |
- Code cleanup
- Multi-line chart
- Horizontal line chart
- Scatter chart