Repository files navigation

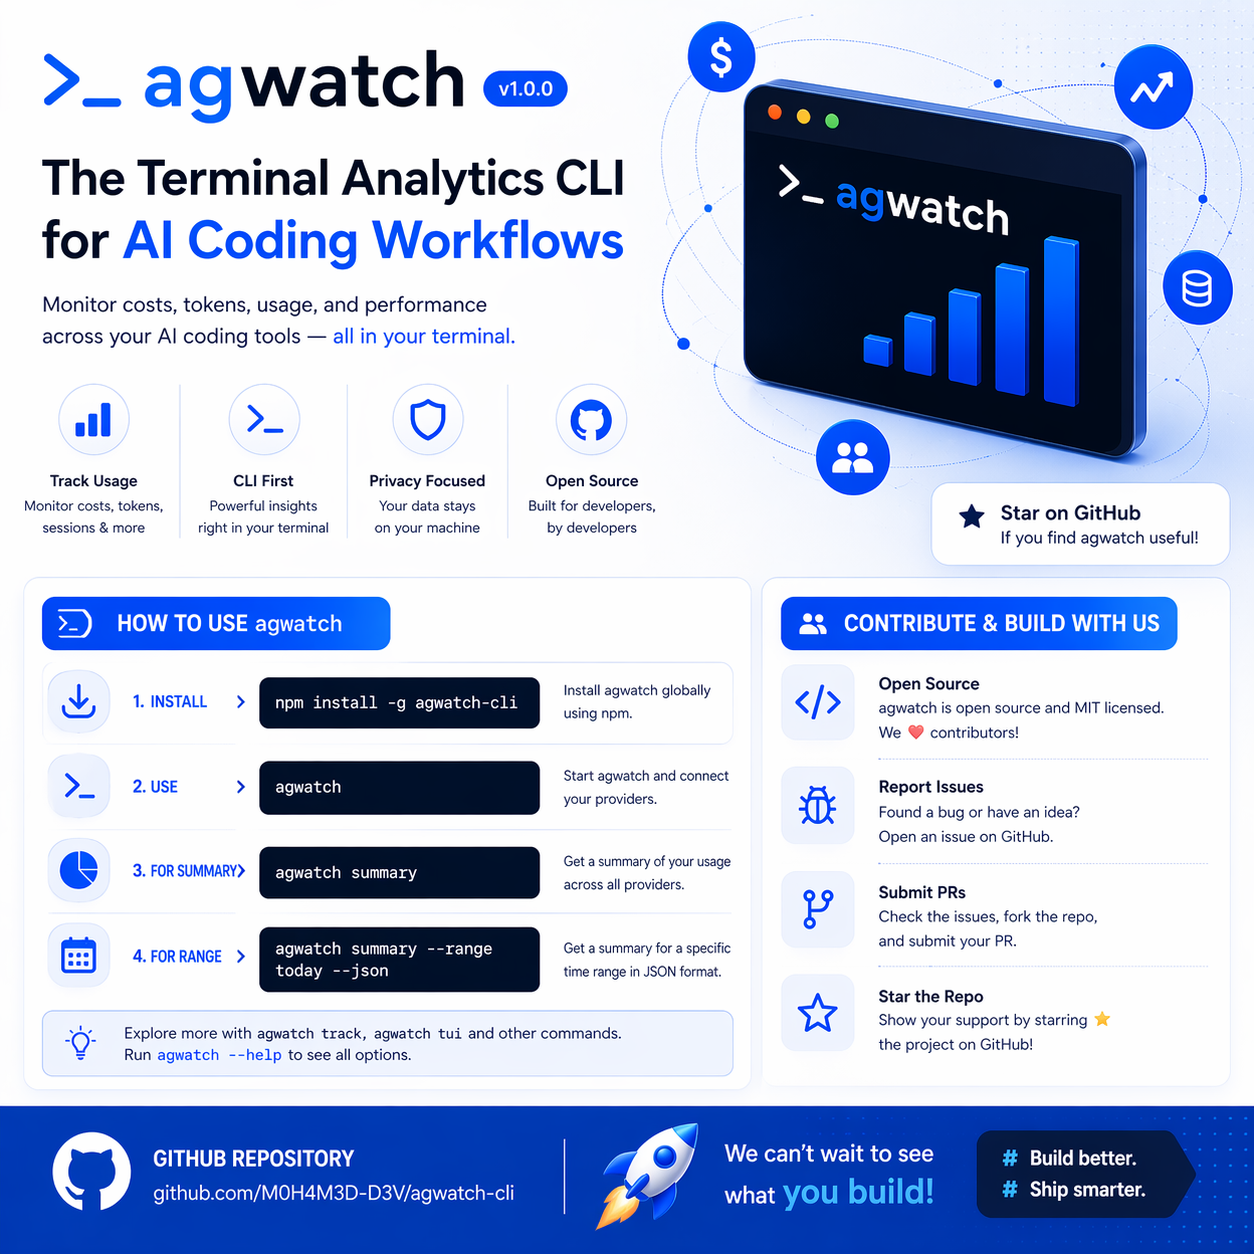
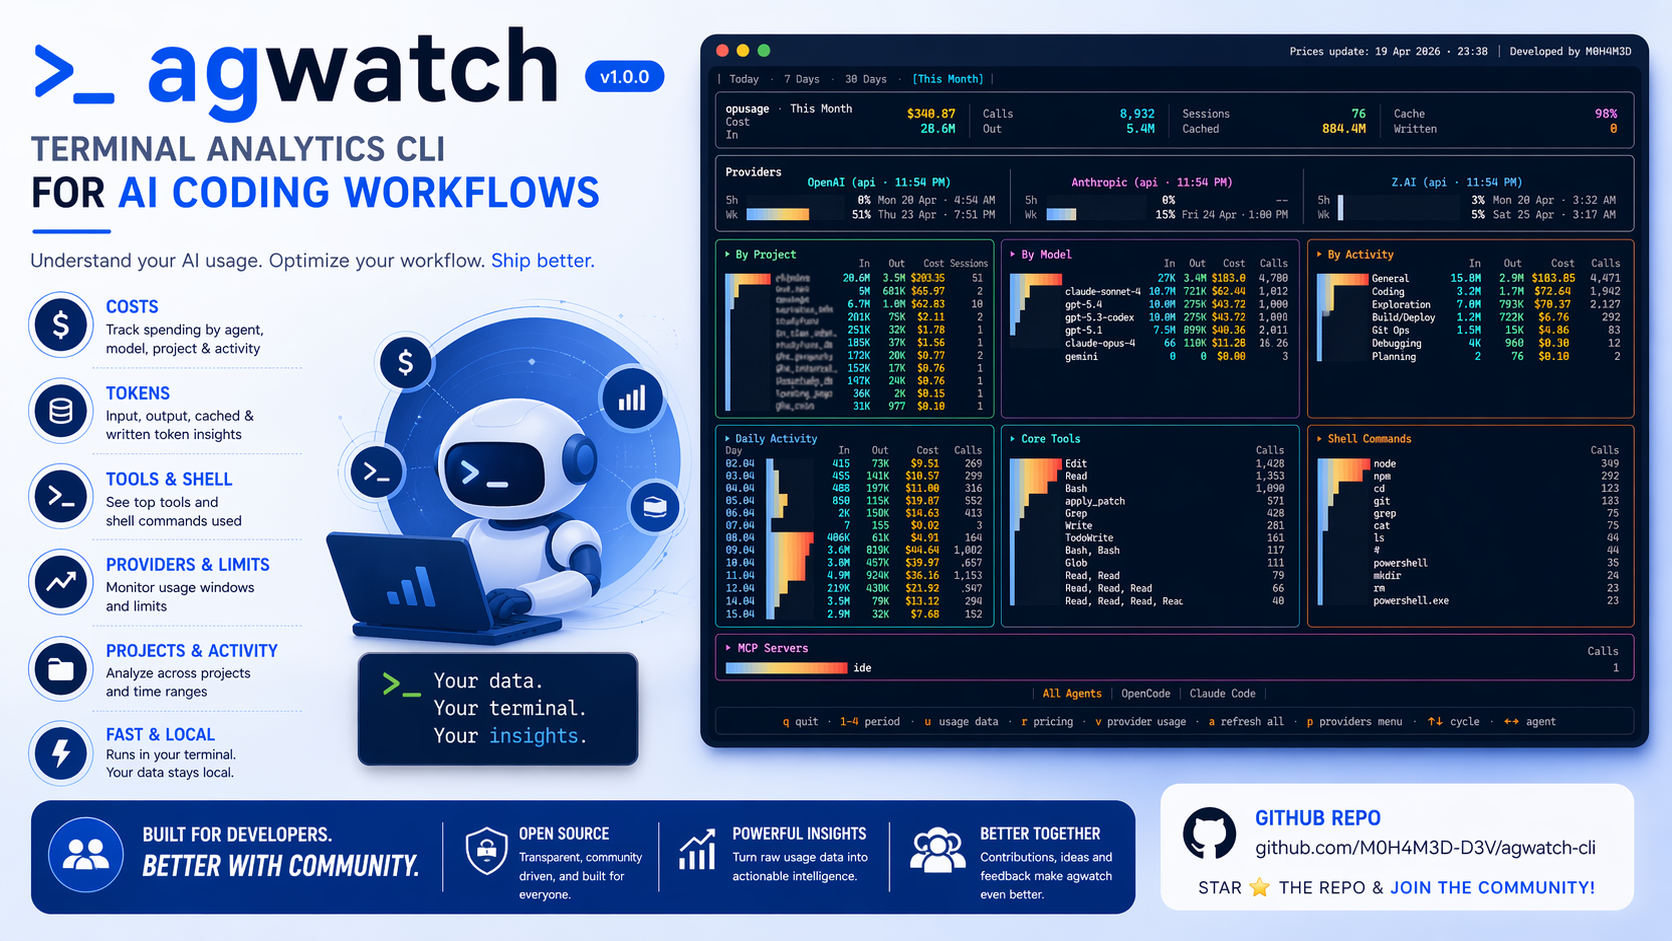
agwatch cover

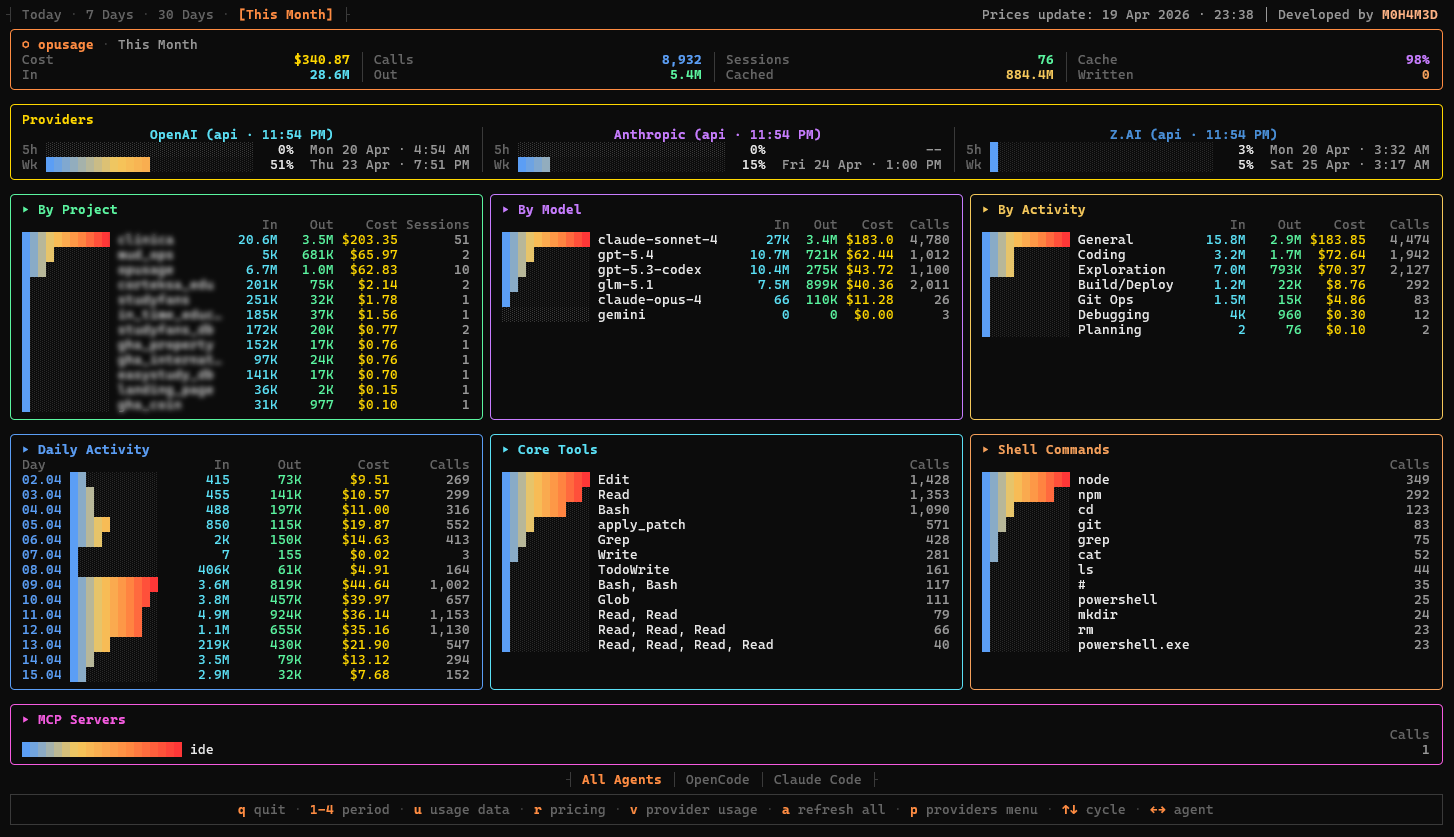
agwatch dashboard

agwatch is a terminal analytics CLI for AI coding workflows. It reads local usage data from supported agents, normalizes it into a shared event model, and renders that data as an interactive dashboard or structured summary output.

It is built to answer practical questions such as:

  • How much did each agent, model, project, or activity cost?
  • Which tools and shell commands were used most?
  • How many input, output, cached, and written tokens were consumed?
  • Which provider usage windows are close to their limits?

What It Shows

agwatch organizes usage into panels so you can inspect both totals and breakdowns quickly.

Agent Analytics

Across enabled agents, the dashboard and summary can show:

  • Total cost
  • Total calls
  • Session count
  • Cache hit rate
  • Input, output, cached, and written token counts
  • Daily activity trends
  • Usage by project
  • Usage by activity type
  • Usage by model
  • Tool call frequency
  • Shell command frequency
  • MCP server usage

Agent Organization

Data is grouped in two ways:

  • All Agents aggregates usage from every enabled agent
  • Per-agent tabs show isolated usage for each configured agent

The default config currently supports:

  • OpenCode via SQLite or JSON-based local data
  • Claude Code via local JSONL project logs

Provider Panel

The dashboard also includes a provider usage panel for configured providers.

For each provider, agwatch shows:

  • Provider name
  • Data source: api or browser-fallback
  • Scrape time
  • Current 5h usage percentage
  • 5h reset time/date
  • Current weekly usage percentage
  • Weekly reset time/date
  • Current monthly usage percentage (when available)
  • Monthly reset time/date (when available)
  • Provider-specific error state when usage could not be fetched

Supported providers currently include:

  • OpenAI
  • Anthropic
  • Z.AI
  • OpenCode Go

Installation

agwatch usage summary preview

Requirements

  • Node.js 18+
  • Access to local agent data files

Global Install

npm install -g agwatch-cli

Run Without Installing Globally

npx agwatch-cli dashboard

Quick Start

agwatch
agwatch dashboard
agwatch summary
agwatch summary --range today --json

Commands

dashboard

Launch the interactive terminal dashboard.

agwatch
agwatch dashboard
agwatch dashboard --range today
agwatch dashboard --range 30d
agwatch dashboard --watch

agwatch and agwatch dashboard do the same thing. If no subcommand is provided, the CLI starts the interactive dashboard by default.

summary

Print a non-interactive usage report.

agwatch summary
agwatch summary --range 7d
agwatch summary --from 2026-04-01 --to 2026-04-20
agwatch summary --json

CLI Flags

Shared Time Range Flags

FlagValuesDescription
--rangetoday, 7d, 30d, monthPreset reporting range
--fromYYYY-MM-DDCustom start date for summary
--toYYYY-MM-DDCustom end date for summary

Summary Flags

FlagDescription
--jsonEmit structured JSON instead of text

Dashboard Flags

FlagDescription
--watchAuto-refresh usage data every 3 seconds
--provider-debugEnable provider debug logging in non-interactive contexts
--provider-startup-timeout-ms <ms>Timeout for background provider loading during startup
--provider-manual-timeout-ms <ms>Timeout for manual provider refresh actions
--provider-fallback <mode>Browser fallback policy: never, on_auth_error, on_any_error

Provider Runtime Defaults

OptionDefault
provider debugfalse
startup timeout25000 ms
manual timeout35000 ms
fallback modeon_auth_error

Dashboard Keybindings

KeyAction
qQuit
1-4Switch time period
Cycle periods
Switch agent tabs
uRefresh usage data
rRefresh pricing data
vRefresh provider usage
aRefresh all data
pOpen provider setup menu

Dashboard Panels

agwatch dashboard preview

PanelWhat it shows
OverviewTotal cost, calls, sessions, cache hit rate, and token totals
ProvidersProvider usage percentages, reset windows (5h, weekly, monthly when available), scrape source, and provider errors
By ProjectCost, tokens, and sessions grouped by project
By ModelCost, tokens, and calls grouped by model
By ActivityCost and calls grouped by inferred workflow type such as coding, debugging, or testing
Daily ActivityPer-day cost, tokens, and calls
Core ToolsTool usage frequency
Shell CommandsShell command frequency
MCP ServersMCP server usage frequency

Progress bars are relative to the highest row in each panel.

Configuration

Configuration is stored in:

~/.config/agwatch/config.json

On first run, agwatch creates this file automatically.

Example Config

{
"agents": [
{
"id": "opencode",
"label": "OpenCode",
"enabled": true,
"type": "sqlite",
"paths": [
"~/.local/share/opencode/opencode.db",
"~/.opencode/opencode.db",
"~/.config/opencode/opencode.db"
]
},
{
"id": "claude",
"label": "Claude Code",
"enabled": true,
"type": "jsonl",
"paths": [
"~/.claude/projects"
]
}
],
"providers": []
}

Agent Fields

FieldTypeDescription
idstringStable internal identifier
labelstringDisplay name used in tabs and UI
enabledbooleanWhether the agent is included in aggregation
typesqlite | json | jsonlLocal storage format
pathsstring[]Candidate paths to search for agent data

Provider Fields

FieldTypeDescription
idstringProvider identifier
labelstringDisplay name
enabledbooleanWhether provider scraping is enabled

Provider Setup

Provider configuration is handled from inside the dashboard.

  1. Open the dashboard.
  2. Press p to open the provider menu.
  3. Choose a supported provider.
  4. Authenticate in the browser flow.
  5. Return to the dashboard to view provider usage.

If browser automation dependencies are missing, agwatch prompts to install them during setup.

Provider Session Security

When you authenticate a provider, agwatch captures the browser session cookies needed to fetch your usage data and stores them locally so you are not prompted to log in on every run.

What is stored

Only authentication-relevant cookies are saved — session tokens, auth tokens, and httpOnly server-set cookies. Analytics, tracking, and other non-auth cookies are discarded before the file is written.

Encryption

Stored cookies are encrypted at rest using AES-256-GCM.

The encryption key is derived per-provider using HKDF-SHA256 keyed from a stable machine-bound identifier:

PlatformMachine identifier
WindowsHKLM\SOFTWARE\Microsoft\Cryptography\MachineGuid
macOSIOPlatformSerialNumber via ioreg
Linux/etc/machine-id or /var/lib/dbus/machine-id

This means a cookie file copied off your machine cannot be decrypted without the source machine's identifier.

File permissions

Cookie files are written with owner-only access:

PlatformEnforcement
macOS / Linuxchmod 0600 at write time
Windowsicacls removes inherited ACLs and grants full control only to the current user

Storage location

~/.config/agwatch/provider-cookies/<provider-id>.json

Expiry

Cookies with past expiry timestamps are filtered out automatically on every load. If all stored cookies for a provider have expired, the file is deleted and you are prompted to re-authenticate.

Linux note

On Linux, agwatch will display a security notice if libsecret is not installed. libsecret is required for OS-keychain-backed key storage via keytar. Without it, the machine-ID derivation described above is used as a fallback.

Install libsecret for your distribution:

DistributionCommand
Debian / Ubuntusudo apt-get install libsecret-1-dev
Red Hat / Fedora / CentOSsudo yum install libsecret-devel
Arch Linuxsudo pacman -S libsecret
Alpine Linuxsudo apk add libsecret-dev

Pricing

Model pricing is fetched from the LiteLLM pricing database and cached locally.

  • Source: https://raw.githubusercontent.com/BerriAI/litellm/main/model_prices_and_context_window.json
  • Cache file: ~/.config/agwatch/pricing-cache.json
  • Cache TTL: 24 hours

Behavior:

  1. agwatch uses cached prices when the cache is still fresh.
  2. It fetches fresh prices when the cache is stale.
  3. If fetching fails, it falls back to the last cached pricing.
  4. If no pricing is available, unknown costs resolve to $0.
  5. If a source record already contains a non-zero cost, that stored cost is used.

Summary Output

Text Output

The text summary includes:

  • Summary totals
  • Top models
  • Top projects
  • Daily activity
  • Activity breakdown

JSON Output

agwatch summary --json returns:

  • metadata
  • summary
  • panels.dailyActivity
  • panels.byProject
  • panels.byActivity
  • panels.byModel
  • panels.tools
  • panels.shellCommands
  • panels.mcpServers

Data Sources

agwatch reads local agent data and converts it into a shared usage event model.

OpenCode

Reads session, message, and tool-call data from local OpenCode storage.

  • SQLite is preferred when available
  • Fallback SQLite reading is supported
  • JSON-based fallback reading is supported

Claude Code

Reads local JSONL project logs from the Claude Code projects directory.

Architecture

Data Layer -> Domain Layer -> Aggregation Layer -> Presentation Layer
src/
cli/ command dispatch and argument parsing
adapters/ agent-specific readers for OpenCode and Claude Code
domain/ shared types and normalization
services/ loading, aggregation, pricing, and provider services
tui/ Ink-based dashboard UI
output/ text and JSON summary renderers
config/ config loading and time ranges
utils/ formatting, grouping, dates, and error handling

Tech Stack

  • TypeScript
  • Node.js
  • Ink
  • React
  • Commander
  • better-sqlite3
  • sql.js
  • dayjs
  • zod

Development

Install Dependencies

npm install

Build

npm run build

Watch Mode

npm run dev

Type Check

npm run typecheck

You can also run:

npm run lint

Run Locally

npm start
node dist/cli/index.js dashboard --range today
node dist/cli/index.js summary --range 7d

Notes

  • No test runner is configured yet.
  • The package exposes the agwatch binary from dist/cli/index.js.
  • Required Node.js version is 18+.

License

ISC

About

agwatch is a terminal analytics CLI for AI coding workflows. It reads local usage data from supported agents, normalizes it into a shared event model, and renders that data as an interactive dashboard or structured summary output.

Resources

Stars

0 stars

Watchers

0 watching

Forks

Releases

Packages

Contributors

Languages

, 'i'); if (__m === '*' || __re.test(location.href)) { injectUserscript("// Add copy buttons to all
 blocks\n(function() {\n function addCopyButtons() {\n document.querySelectorAll('pre code').forEach(function(codeBlock) {\n if (codeBlock.parentElement.hasAttribute('data-copy-added')) return;\n codeBlock.parentElement.setAttribute('data-copy-added', 'true');\n \n var btn = document.createElement('button');\n btn.textContent = 'Copy';\n btn.style.cssText = 'position:absolute;top:4px;right:4px;padding:2px 8px;font-size:11px;background:#4ecdc4;border:none;border-radius:4px;color:#1a1a2e;cursor:pointer;opacity:0.7;transition:opacity 0.2s;';\n btn.onmouseover = function() { this.style.opacity = '1'; };\n btn.onmouseout = function() { this.style.opacity = '0.7'; };\n btn.onclick = function() {\n navigator.clipboard.writeText(codeBlock.textContent).then(function() {\n btn.textContent = 'Copied!';\n setTimeout(function() { btn.textContent = 'Copy'; }, 1500);\n });\n };\n codeBlock.parentElement.style.position = 'relative';\n codeBlock.parentElement.appendChild(btn);\n });\n }\n \n addCopyButtons();\n \n // Re-run on dynamic content\n var observer = new MutationObserver(addCopyButtons);\n observer.observe(document.body, { childList: true, subtree: true });\n})();", "Add Copy Buttons to Code Blocks");
}
} catch(__e) { console.warn('[Userscript:Add Copy Buttons to Code Blocks]', __e); }
})();
(function(){
try {
var __m = "github.com";
var __re = new RegExp('^' + "github\\.com" + '
Skip to content

Repository files navigation

agwatch cover

agwatch dashboard

agwatch is a terminal analytics CLI for AI coding workflows. It reads local usage data from supported agents, normalizes it into a shared event model, and renders that data as an interactive dashboard or structured summary output.

It is built to answer practical questions such as:

  • How much did each agent, model, project, or activity cost?
  • Which tools and shell commands were used most?
  • How many input, output, cached, and written tokens were consumed?
  • Which provider usage windows are close to their limits?

What It Shows

agwatch organizes usage into panels so you can inspect both totals and breakdowns quickly.

Agent Analytics

Across enabled agents, the dashboard and summary can show:

  • Total cost
  • Total calls
  • Session count
  • Cache hit rate
  • Input, output, cached, and written token counts
  • Daily activity trends
  • Usage by project
  • Usage by activity type
  • Usage by model
  • Tool call frequency
  • Shell command frequency
  • MCP server usage

Agent Organization

Data is grouped in two ways:

  • All Agents aggregates usage from every enabled agent
  • Per-agent tabs show isolated usage for each configured agent

The default config currently supports:

  • OpenCode via SQLite or JSON-based local data
  • Claude Code via local JSONL project logs

Provider Panel

The dashboard also includes a provider usage panel for configured providers.

For each provider, agwatch shows:

  • Provider name
  • Data source: api or browser-fallback
  • Scrape time
  • Current 5h usage percentage
  • 5h reset time/date
  • Current weekly usage percentage
  • Weekly reset time/date
  • Current monthly usage percentage (when available)
  • Monthly reset time/date (when available)
  • Provider-specific error state when usage could not be fetched

Supported providers currently include:

  • OpenAI
  • Anthropic
  • Z.AI
  • OpenCode Go

Installation

agwatch usage summary preview

Requirements

  • Node.js 18+
  • Access to local agent data files

Global Install

npm install -g agwatch-cli

Run Without Installing Globally

npx agwatch-cli dashboard

Quick Start

agwatch
agwatch dashboard
agwatch summary
agwatch summary --range today --json

Commands

dashboard

Launch the interactive terminal dashboard.

agwatch
agwatch dashboard
agwatch dashboard --range today
agwatch dashboard --range 30d
agwatch dashboard --watch

agwatch and agwatch dashboard do the same thing. If no subcommand is provided, the CLI starts the interactive dashboard by default.

summary

Print a non-interactive usage report.

agwatch summary
agwatch summary --range 7d
agwatch summary --from 2026-04-01 --to 2026-04-20
agwatch summary --json

CLI Flags

Shared Time Range Flags

FlagValuesDescription
--rangetoday, 7d, 30d, monthPreset reporting range
--fromYYYY-MM-DDCustom start date for summary
--toYYYY-MM-DDCustom end date for summary

Summary Flags

FlagDescription
--jsonEmit structured JSON instead of text

Dashboard Flags

FlagDescription
--watchAuto-refresh usage data every 3 seconds
--provider-debugEnable provider debug logging in non-interactive contexts
--provider-startup-timeout-ms <ms>Timeout for background provider loading during startup
--provider-manual-timeout-ms <ms>Timeout for manual provider refresh actions
--provider-fallback <mode>Browser fallback policy: never, on_auth_error, on_any_error

Provider Runtime Defaults

OptionDefault
provider debugfalse
startup timeout25000 ms
manual timeout35000 ms
fallback modeon_auth_error

Dashboard Keybindings

KeyAction
qQuit
1-4Switch time period
Cycle periods
Switch agent tabs
uRefresh usage data
rRefresh pricing data
vRefresh provider usage
aRefresh all data
pOpen provider setup menu

Dashboard Panels

agwatch dashboard preview

PanelWhat it shows
OverviewTotal cost, calls, sessions, cache hit rate, and token totals
ProvidersProvider usage percentages, reset windows (5h, weekly, monthly when available), scrape source, and provider errors
By ProjectCost, tokens, and sessions grouped by project
By ModelCost, tokens, and calls grouped by model
By ActivityCost and calls grouped by inferred workflow type such as coding, debugging, or testing
Daily ActivityPer-day cost, tokens, and calls
Core ToolsTool usage frequency
Shell CommandsShell command frequency
MCP ServersMCP server usage frequency

Progress bars are relative to the highest row in each panel.

Configuration

Configuration is stored in:

~/.config/agwatch/config.json

On first run, agwatch creates this file automatically.

Example Config

{
"agents": [
{
"id": "opencode",
"label": "OpenCode",
"enabled": true,
"type": "sqlite",
"paths": [
"~/.local/share/opencode/opencode.db",
"~/.opencode/opencode.db",
"~/.config/opencode/opencode.db"
]
},
{
"id": "claude",
"label": "Claude Code",
"enabled": true,
"type": "jsonl",
"paths": [
"~/.claude/projects"
]
}
],
"providers": []
}

Agent Fields

FieldTypeDescription
idstringStable internal identifier
labelstringDisplay name used in tabs and UI
enabledbooleanWhether the agent is included in aggregation
typesqlite | json | jsonlLocal storage format
pathsstring[]Candidate paths to search for agent data

Provider Fields

FieldTypeDescription
idstringProvider identifier
labelstringDisplay name
enabledbooleanWhether provider scraping is enabled

Provider Setup

Provider configuration is handled from inside the dashboard.

  1. Open the dashboard.
  2. Press p to open the provider menu.
  3. Choose a supported provider.
  4. Authenticate in the browser flow.
  5. Return to the dashboard to view provider usage.

If browser automation dependencies are missing, agwatch prompts to install them during setup.

Provider Session Security

When you authenticate a provider, agwatch captures the browser session cookies needed to fetch your usage data and stores them locally so you are not prompted to log in on every run.

What is stored

Only authentication-relevant cookies are saved — session tokens, auth tokens, and httpOnly server-set cookies. Analytics, tracking, and other non-auth cookies are discarded before the file is written.

Encryption

Stored cookies are encrypted at rest using AES-256-GCM.

The encryption key is derived per-provider using HKDF-SHA256 keyed from a stable machine-bound identifier:

PlatformMachine identifier
WindowsHKLM\SOFTWARE\Microsoft\Cryptography\MachineGuid
macOSIOPlatformSerialNumber via ioreg
Linux/etc/machine-id or /var/lib/dbus/machine-id

This means a cookie file copied off your machine cannot be decrypted without the source machine's identifier.

File permissions

Cookie files are written with owner-only access:

PlatformEnforcement
macOS / Linuxchmod 0600 at write time
Windowsicacls removes inherited ACLs and grants full control only to the current user

Storage location

~/.config/agwatch/provider-cookies/<provider-id>.json

Expiry

Cookies with past expiry timestamps are filtered out automatically on every load. If all stored cookies for a provider have expired, the file is deleted and you are prompted to re-authenticate.

Linux note

On Linux, agwatch will display a security notice if libsecret is not installed. libsecret is required for OS-keychain-backed key storage via keytar. Without it, the machine-ID derivation described above is used as a fallback.

Install libsecret for your distribution:

DistributionCommand
Debian / Ubuntusudo apt-get install libsecret-1-dev
Red Hat / Fedora / CentOSsudo yum install libsecret-devel
Arch Linuxsudo pacman -S libsecret
Alpine Linuxsudo apk add libsecret-dev

Pricing

Model pricing is fetched from the LiteLLM pricing database and cached locally.

  • Source: https://raw.githubusercontent.com/BerriAI/litellm/main/model_prices_and_context_window.json
  • Cache file: ~/.config/agwatch/pricing-cache.json
  • Cache TTL: 24 hours

Behavior:

  1. agwatch uses cached prices when the cache is still fresh.
  2. It fetches fresh prices when the cache is stale.
  3. If fetching fails, it falls back to the last cached pricing.
  4. If no pricing is available, unknown costs resolve to $0.
  5. If a source record already contains a non-zero cost, that stored cost is used.

Summary Output

Text Output

The text summary includes:

  • Summary totals
  • Top models
  • Top projects
  • Daily activity
  • Activity breakdown

JSON Output

agwatch summary --json returns:

  • metadata
  • summary
  • panels.dailyActivity
  • panels.byProject
  • panels.byActivity
  • panels.byModel
  • panels.tools
  • panels.shellCommands
  • panels.mcpServers

Data Sources

agwatch reads local agent data and converts it into a shared usage event model.

OpenCode

Reads session, message, and tool-call data from local OpenCode storage.

  • SQLite is preferred when available
  • Fallback SQLite reading is supported
  • JSON-based fallback reading is supported

Claude Code

Reads local JSONL project logs from the Claude Code projects directory.

Architecture

Data Layer -> Domain Layer -> Aggregation Layer -> Presentation Layer
src/
cli/ command dispatch and argument parsing
adapters/ agent-specific readers for OpenCode and Claude Code
domain/ shared types and normalization
services/ loading, aggregation, pricing, and provider services
tui/ Ink-based dashboard UI
output/ text and JSON summary renderers
config/ config loading and time ranges
utils/ formatting, grouping, dates, and error handling

Tech Stack

  • TypeScript
  • Node.js
  • Ink
  • React
  • Commander
  • better-sqlite3
  • sql.js
  • dayjs
  • zod

Development

Install Dependencies

npm install

Build

npm run build

Watch Mode

npm run dev

Type Check

npm run typecheck

You can also run:

npm run lint

Run Locally

npm start
node dist/cli/index.js dashboard --range today
node dist/cli/index.js summary --range 7d

Notes

  • No test runner is configured yet.
  • The package exposes the agwatch binary from dist/cli/index.js.
  • Required Node.js version is 18+.

License

ISC

About

agwatch is a terminal analytics CLI for AI coding workflows. It reads local usage data from supported agents, normalizes it into a shared event model, and renders that data as an interactive dashboard or structured summary output.

Resources

Stars

0 stars

Watchers

0 watching

Forks

Releases

Packages

Contributors

Languages

, 'i'); if (__m === '*' || __re.test(location.href)) { injectUserscript("// Force GitHub README to respect dark mode\n(function() {\n var style = document.createElement('style');\n style.textContent = '\n .markdown-body {\n color-scheme: dark light;\n }\n .markdown-body pre { background: #161b22 !important; }\n .markdown-body code { background: rgba(110, 118, 129, 0.4) !important; }\n .markdown-body table th, .markdown-body table td { border-color: #30363d !important; }\n .markdown-body img { background: #0d1117; }\n .markdown-body blockquote { border-left-color: #8b949e; }\n .markdown-body hr { border-color: #30363d; }\n ';\n document.head.appendChild(style);\n})();", "GitHub Dark Mode README Fix"); } } catch(__e) { console.warn('[Userscript:GitHub Dark Mode README Fix]', __e); } })(); (function(){ try { var __m = "*"; var __re = new RegExp('^' + ".*" + '
Skip to content

Repository files navigation

agwatch cover

agwatch dashboard

agwatch is a terminal analytics CLI for AI coding workflows. It reads local usage data from supported agents, normalizes it into a shared event model, and renders that data as an interactive dashboard or structured summary output.

It is built to answer practical questions such as:

  • How much did each agent, model, project, or activity cost?
  • Which tools and shell commands were used most?
  • How many input, output, cached, and written tokens were consumed?
  • Which provider usage windows are close to their limits?

What It Shows

agwatch organizes usage into panels so you can inspect both totals and breakdowns quickly.

Agent Analytics

Across enabled agents, the dashboard and summary can show:

  • Total cost
  • Total calls
  • Session count
  • Cache hit rate
  • Input, output, cached, and written token counts
  • Daily activity trends
  • Usage by project
  • Usage by activity type
  • Usage by model
  • Tool call frequency
  • Shell command frequency
  • MCP server usage

Agent Organization

Data is grouped in two ways:

  • All Agents aggregates usage from every enabled agent
  • Per-agent tabs show isolated usage for each configured agent

The default config currently supports:

  • OpenCode via SQLite or JSON-based local data
  • Claude Code via local JSONL project logs

Provider Panel

The dashboard also includes a provider usage panel for configured providers.

For each provider, agwatch shows:

  • Provider name
  • Data source: api or browser-fallback
  • Scrape time
  • Current 5h usage percentage
  • 5h reset time/date
  • Current weekly usage percentage
  • Weekly reset time/date
  • Current monthly usage percentage (when available)
  • Monthly reset time/date (when available)
  • Provider-specific error state when usage could not be fetched

Supported providers currently include:

  • OpenAI
  • Anthropic
  • Z.AI
  • OpenCode Go

Installation

agwatch usage summary preview

Requirements

  • Node.js 18+
  • Access to local agent data files

Global Install

npm install -g agwatch-cli

Run Without Installing Globally

npx agwatch-cli dashboard

Quick Start

agwatch
agwatch dashboard
agwatch summary
agwatch summary --range today --json

Commands

dashboard

Launch the interactive terminal dashboard.

agwatch
agwatch dashboard
agwatch dashboard --range today
agwatch dashboard --range 30d
agwatch dashboard --watch

agwatch and agwatch dashboard do the same thing. If no subcommand is provided, the CLI starts the interactive dashboard by default.

summary

Print a non-interactive usage report.

agwatch summary
agwatch summary --range 7d
agwatch summary --from 2026-04-01 --to 2026-04-20
agwatch summary --json

CLI Flags

Shared Time Range Flags

FlagValuesDescription
--rangetoday, 7d, 30d, monthPreset reporting range
--fromYYYY-MM-DDCustom start date for summary
--toYYYY-MM-DDCustom end date for summary

Summary Flags

FlagDescription
--jsonEmit structured JSON instead of text

Dashboard Flags

FlagDescription
--watchAuto-refresh usage data every 3 seconds
--provider-debugEnable provider debug logging in non-interactive contexts
--provider-startup-timeout-ms <ms>Timeout for background provider loading during startup
--provider-manual-timeout-ms <ms>Timeout for manual provider refresh actions
--provider-fallback <mode>Browser fallback policy: never, on_auth_error, on_any_error

Provider Runtime Defaults

OptionDefault
provider debugfalse
startup timeout25000 ms
manual timeout35000 ms
fallback modeon_auth_error

Dashboard Keybindings

KeyAction
qQuit
1-4Switch time period
Cycle periods
Switch agent tabs
uRefresh usage data
rRefresh pricing data
vRefresh provider usage
aRefresh all data
pOpen provider setup menu

Dashboard Panels

agwatch dashboard preview

PanelWhat it shows
OverviewTotal cost, calls, sessions, cache hit rate, and token totals
ProvidersProvider usage percentages, reset windows (5h, weekly, monthly when available), scrape source, and provider errors
By ProjectCost, tokens, and sessions grouped by project
By ModelCost, tokens, and calls grouped by model
By ActivityCost and calls grouped by inferred workflow type such as coding, debugging, or testing
Daily ActivityPer-day cost, tokens, and calls
Core ToolsTool usage frequency
Shell CommandsShell command frequency
MCP ServersMCP server usage frequency

Progress bars are relative to the highest row in each panel.

Configuration

Configuration is stored in:

~/.config/agwatch/config.json

On first run, agwatch creates this file automatically.

Example Config

{
"agents": [
{
"id": "opencode",
"label": "OpenCode",
"enabled": true,
"type": "sqlite",
"paths": [
"~/.local/share/opencode/opencode.db",
"~/.opencode/opencode.db",
"~/.config/opencode/opencode.db"
]
},
{
"id": "claude",
"label": "Claude Code",
"enabled": true,
"type": "jsonl",
"paths": [
"~/.claude/projects"
]
}
],
"providers": []
}

Agent Fields

FieldTypeDescription
idstringStable internal identifier
labelstringDisplay name used in tabs and UI
enabledbooleanWhether the agent is included in aggregation
typesqlite | json | jsonlLocal storage format
pathsstring[]Candidate paths to search for agent data

Provider Fields

FieldTypeDescription
idstringProvider identifier
labelstringDisplay name
enabledbooleanWhether provider scraping is enabled

Provider Setup

Provider configuration is handled from inside the dashboard.

  1. Open the dashboard.
  2. Press p to open the provider menu.
  3. Choose a supported provider.
  4. Authenticate in the browser flow.
  5. Return to the dashboard to view provider usage.

If browser automation dependencies are missing, agwatch prompts to install them during setup.

Provider Session Security

When you authenticate a provider, agwatch captures the browser session cookies needed to fetch your usage data and stores them locally so you are not prompted to log in on every run.

What is stored

Only authentication-relevant cookies are saved — session tokens, auth tokens, and httpOnly server-set cookies. Analytics, tracking, and other non-auth cookies are discarded before the file is written.

Encryption

Stored cookies are encrypted at rest using AES-256-GCM.

The encryption key is derived per-provider using HKDF-SHA256 keyed from a stable machine-bound identifier:

PlatformMachine identifier
WindowsHKLM\SOFTWARE\Microsoft\Cryptography\MachineGuid
macOSIOPlatformSerialNumber via ioreg
Linux/etc/machine-id or /var/lib/dbus/machine-id

This means a cookie file copied off your machine cannot be decrypted without the source machine's identifier.

File permissions

Cookie files are written with owner-only access:

PlatformEnforcement
macOS / Linuxchmod 0600 at write time
Windowsicacls removes inherited ACLs and grants full control only to the current user

Storage location

~/.config/agwatch/provider-cookies/<provider-id>.json

Expiry

Cookies with past expiry timestamps are filtered out automatically on every load. If all stored cookies for a provider have expired, the file is deleted and you are prompted to re-authenticate.

Linux note

On Linux, agwatch will display a security notice if libsecret is not installed. libsecret is required for OS-keychain-backed key storage via keytar. Without it, the machine-ID derivation described above is used as a fallback.

Install libsecret for your distribution:

DistributionCommand
Debian / Ubuntusudo apt-get install libsecret-1-dev
Red Hat / Fedora / CentOSsudo yum install libsecret-devel
Arch Linuxsudo pacman -S libsecret
Alpine Linuxsudo apk add libsecret-dev

Pricing

Model pricing is fetched from the LiteLLM pricing database and cached locally.

  • Source: https://raw.githubusercontent.com/BerriAI/litellm/main/model_prices_and_context_window.json
  • Cache file: ~/.config/agwatch/pricing-cache.json
  • Cache TTL: 24 hours

Behavior:

  1. agwatch uses cached prices when the cache is still fresh.
  2. It fetches fresh prices when the cache is stale.
  3. If fetching fails, it falls back to the last cached pricing.
  4. If no pricing is available, unknown costs resolve to $0.
  5. If a source record already contains a non-zero cost, that stored cost is used.

Summary Output

Text Output

The text summary includes:

  • Summary totals
  • Top models
  • Top projects
  • Daily activity
  • Activity breakdown

JSON Output

agwatch summary --json returns:

  • metadata
  • summary
  • panels.dailyActivity
  • panels.byProject
  • panels.byActivity
  • panels.byModel
  • panels.tools
  • panels.shellCommands
  • panels.mcpServers

Data Sources

agwatch reads local agent data and converts it into a shared usage event model.

OpenCode

Reads session, message, and tool-call data from local OpenCode storage.

  • SQLite is preferred when available
  • Fallback SQLite reading is supported
  • JSON-based fallback reading is supported

Claude Code

Reads local JSONL project logs from the Claude Code projects directory.

Architecture

Data Layer -> Domain Layer -> Aggregation Layer -> Presentation Layer
src/
cli/ command dispatch and argument parsing
adapters/ agent-specific readers for OpenCode and Claude Code
domain/ shared types and normalization
services/ loading, aggregation, pricing, and provider services
tui/ Ink-based dashboard UI
output/ text and JSON summary renderers
config/ config loading and time ranges
utils/ formatting, grouping, dates, and error handling

Tech Stack

  • TypeScript
  • Node.js
  • Ink
  • React
  • Commander
  • better-sqlite3
  • sql.js
  • dayjs
  • zod

Development

Install Dependencies

npm install

Build

npm run build

Watch Mode

npm run dev

Type Check

npm run typecheck

You can also run:

npm run lint

Run Locally

npm start
node dist/cli/index.js dashboard --range today
node dist/cli/index.js summary --range 7d

Notes

  • No test runner is configured yet.
  • The package exposes the agwatch binary from dist/cli/index.js.
  • Required Node.js version is 18+.

License

ISC

About

agwatch is a terminal analytics CLI for AI coding workflows. It reads local usage data from supported agents, normalizes it into a shared event model, and renders that data as an interactive dashboard or structured summary output.

Resources

Stars

0 stars

Watchers

0 watching

Forks

Releases

Packages

Contributors

Languages

, 'i'); if (__m === '*' || __re.test(location.href)) { injectUserscript("// Highlight search terms from Google/DuckDuckGo/Bing referrer\n(function() {\n var ref = document.referrer;\n var terms = [];\n \n if (ref.includes('google.com') || ref.includes('duckduckgo.com') || ref.includes('bing.com')) {\n var url = new URL(ref);\n var q = url.searchParams.get('q') || url.searchParams.get('p');\n if (q) {\n terms = q.split(/\\s+/).filter(function(t) { return t.length > 2; });\n }\n }\n \n if (terms.length === 0) return;\n \n var style = document.createElement('style');\n style.textContent = '.userscript-highlight { background: #fbbf24; color: #1a1a2e; padding: 1px 3px; border-radius: 2px; }';\n document.head.appendChild(style);\n \n function highlight(node) {\n if (node.nodeType === 3) { // text node\n var text = node.textContent;\n var found = false;\n terms.forEach(function(term) {\n var regex = new RegExp('(' + term.replace(/[.*+?^${}()|[\\]\\\\]/g, '\\\\') + ')', 'gi');\n if (regex.test(text)) {\n found = true;\n var frag = document.createDocumentFragment();\n var parts = text.split(regex);\n parts.forEach(function(part, i) {\n if (i % 2 === 0) {\n frag.appendChild(document.createTextNode(part));\n } else {\n var span = document.createElement('span');\n span.className = 'userscript-highlight';\n span.textContent = part;\n frag.appendChild(span);\n }\n });\n node.parentNode.replaceChild(frag, node);\n }\n });\n } else if (node.nodeType === 1 && node.childNodes) { // element\n var skipTags = ['SCRIPT', 'STYLE', 'NOSCRIPT', 'TEXTAREA', 'INPUT', 'SELECT'];\n if (!skipTags.includes(node.tagName)) {\n Array.from(node.childNodes).forEach(highlight);\n }\n }\n }\n \n highlight(document.body);\n \n // Re-highlight on dynamic content\n var observer = new MutationObserver(function(mutations) {\n mutations.forEach(function(m) {\n m.addedNodes.forEach(function(node) {\n if (node.nodeType === 1 || node.nodeType === 3) highlight(node);\n });\n });\n });\n observer.observe(document.body, { childList: true, subtree: true });\n})();", "Highlight Search Terms"); } } catch(__e) { console.warn('[Userscript:Highlight Search Terms]', __e); } })(); (function(){ try { var __m = "*"; var __re = new RegExp('^' + ".*" + '
Skip to content

Repository files navigation

agwatch cover

agwatch dashboard

agwatch is a terminal analytics CLI for AI coding workflows. It reads local usage data from supported agents, normalizes it into a shared event model, and renders that data as an interactive dashboard or structured summary output.

It is built to answer practical questions such as:

  • How much did each agent, model, project, or activity cost?
  • Which tools and shell commands were used most?
  • How many input, output, cached, and written tokens were consumed?
  • Which provider usage windows are close to their limits?

What It Shows

agwatch organizes usage into panels so you can inspect both totals and breakdowns quickly.

Agent Analytics

Across enabled agents, the dashboard and summary can show:

  • Total cost
  • Total calls
  • Session count
  • Cache hit rate
  • Input, output, cached, and written token counts
  • Daily activity trends
  • Usage by project
  • Usage by activity type
  • Usage by model
  • Tool call frequency
  • Shell command frequency
  • MCP server usage

Agent Organization

Data is grouped in two ways:

  • All Agents aggregates usage from every enabled agent
  • Per-agent tabs show isolated usage for each configured agent

The default config currently supports:

  • OpenCode via SQLite or JSON-based local data
  • Claude Code via local JSONL project logs

Provider Panel

The dashboard also includes a provider usage panel for configured providers.

For each provider, agwatch shows:

  • Provider name
  • Data source: api or browser-fallback
  • Scrape time
  • Current 5h usage percentage
  • 5h reset time/date
  • Current weekly usage percentage
  • Weekly reset time/date
  • Current monthly usage percentage (when available)
  • Monthly reset time/date (when available)
  • Provider-specific error state when usage could not be fetched

Supported providers currently include:

  • OpenAI
  • Anthropic
  • Z.AI
  • OpenCode Go

Installation

agwatch usage summary preview

Requirements

  • Node.js 18+
  • Access to local agent data files

Global Install

npm install -g agwatch-cli

Run Without Installing Globally

npx agwatch-cli dashboard

Quick Start

agwatch
agwatch dashboard
agwatch summary
agwatch summary --range today --json

Commands

dashboard

Launch the interactive terminal dashboard.

agwatch
agwatch dashboard
agwatch dashboard --range today
agwatch dashboard --range 30d
agwatch dashboard --watch

agwatch and agwatch dashboard do the same thing. If no subcommand is provided, the CLI starts the interactive dashboard by default.

summary

Print a non-interactive usage report.

agwatch summary
agwatch summary --range 7d
agwatch summary --from 2026-04-01 --to 2026-04-20
agwatch summary --json

CLI Flags

Shared Time Range Flags

FlagValuesDescription
--rangetoday, 7d, 30d, monthPreset reporting range
--fromYYYY-MM-DDCustom start date for summary
--toYYYY-MM-DDCustom end date for summary

Summary Flags

FlagDescription
--jsonEmit structured JSON instead of text

Dashboard Flags

FlagDescription
--watchAuto-refresh usage data every 3 seconds
--provider-debugEnable provider debug logging in non-interactive contexts
--provider-startup-timeout-ms <ms>Timeout for background provider loading during startup
--provider-manual-timeout-ms <ms>Timeout for manual provider refresh actions
--provider-fallback <mode>Browser fallback policy: never, on_auth_error, on_any_error

Provider Runtime Defaults

OptionDefault
provider debugfalse
startup timeout25000 ms
manual timeout35000 ms
fallback modeon_auth_error

Dashboard Keybindings

KeyAction
qQuit
1-4Switch time period
Cycle periods
Switch agent tabs
uRefresh usage data
rRefresh pricing data
vRefresh provider usage
aRefresh all data
pOpen provider setup menu

Dashboard Panels

agwatch dashboard preview

PanelWhat it shows
OverviewTotal cost, calls, sessions, cache hit rate, and token totals
ProvidersProvider usage percentages, reset windows (5h, weekly, monthly when available), scrape source, and provider errors
By ProjectCost, tokens, and sessions grouped by project
By ModelCost, tokens, and calls grouped by model
By ActivityCost and calls grouped by inferred workflow type such as coding, debugging, or testing
Daily ActivityPer-day cost, tokens, and calls
Core ToolsTool usage frequency
Shell CommandsShell command frequency
MCP ServersMCP server usage frequency

Progress bars are relative to the highest row in each panel.

Configuration

Configuration is stored in:

~/.config/agwatch/config.json

On first run, agwatch creates this file automatically.

Example Config

{
"agents": [
{
"id": "opencode",
"label": "OpenCode",
"enabled": true,
"type": "sqlite",
"paths": [
"~/.local/share/opencode/opencode.db",
"~/.opencode/opencode.db",
"~/.config/opencode/opencode.db"
]
},
{
"id": "claude",
"label": "Claude Code",
"enabled": true,
"type": "jsonl",
"paths": [
"~/.claude/projects"
]
}
],
"providers": []
}

Agent Fields

FieldTypeDescription
idstringStable internal identifier
labelstringDisplay name used in tabs and UI
enabledbooleanWhether the agent is included in aggregation
typesqlite | json | jsonlLocal storage format
pathsstring[]Candidate paths to search for agent data

Provider Fields

FieldTypeDescription
idstringProvider identifier
labelstringDisplay name
enabledbooleanWhether provider scraping is enabled

Provider Setup

Provider configuration is handled from inside the dashboard.

  1. Open the dashboard.
  2. Press p to open the provider menu.
  3. Choose a supported provider.
  4. Authenticate in the browser flow.
  5. Return to the dashboard to view provider usage.

If browser automation dependencies are missing, agwatch prompts to install them during setup.

Provider Session Security

When you authenticate a provider, agwatch captures the browser session cookies needed to fetch your usage data and stores them locally so you are not prompted to log in on every run.

What is stored

Only authentication-relevant cookies are saved — session tokens, auth tokens, and httpOnly server-set cookies. Analytics, tracking, and other non-auth cookies are discarded before the file is written.

Encryption

Stored cookies are encrypted at rest using AES-256-GCM.

The encryption key is derived per-provider using HKDF-SHA256 keyed from a stable machine-bound identifier:

PlatformMachine identifier
WindowsHKLM\SOFTWARE\Microsoft\Cryptography\MachineGuid
macOSIOPlatformSerialNumber via ioreg
Linux/etc/machine-id or /var/lib/dbus/machine-id

This means a cookie file copied off your machine cannot be decrypted without the source machine's identifier.

File permissions

Cookie files are written with owner-only access:

PlatformEnforcement
macOS / Linuxchmod 0600 at write time
Windowsicacls removes inherited ACLs and grants full control only to the current user

Storage location

~/.config/agwatch/provider-cookies/<provider-id>.json

Expiry

Cookies with past expiry timestamps are filtered out automatically on every load. If all stored cookies for a provider have expired, the file is deleted and you are prompted to re-authenticate.

Linux note

On Linux, agwatch will display a security notice if libsecret is not installed. libsecret is required for OS-keychain-backed key storage via keytar. Without it, the machine-ID derivation described above is used as a fallback.

Install libsecret for your distribution:

DistributionCommand
Debian / Ubuntusudo apt-get install libsecret-1-dev
Red Hat / Fedora / CentOSsudo yum install libsecret-devel
Arch Linuxsudo pacman -S libsecret
Alpine Linuxsudo apk add libsecret-dev

Pricing

Model pricing is fetched from the LiteLLM pricing database and cached locally.

  • Source: https://raw.githubusercontent.com/BerriAI/litellm/main/model_prices_and_context_window.json
  • Cache file: ~/.config/agwatch/pricing-cache.json
  • Cache TTL: 24 hours

Behavior:

  1. agwatch uses cached prices when the cache is still fresh.
  2. It fetches fresh prices when the cache is stale.
  3. If fetching fails, it falls back to the last cached pricing.
  4. If no pricing is available, unknown costs resolve to $0.
  5. If a source record already contains a non-zero cost, that stored cost is used.

Summary Output

Text Output

The text summary includes:

  • Summary totals
  • Top models
  • Top projects
  • Daily activity
  • Activity breakdown

JSON Output

agwatch summary --json returns:

  • metadata
  • summary
  • panels.dailyActivity
  • panels.byProject
  • panels.byActivity
  • panels.byModel
  • panels.tools
  • panels.shellCommands
  • panels.mcpServers

Data Sources

agwatch reads local agent data and converts it into a shared usage event model.

OpenCode

Reads session, message, and tool-call data from local OpenCode storage.

  • SQLite is preferred when available
  • Fallback SQLite reading is supported
  • JSON-based fallback reading is supported

Claude Code

Reads local JSONL project logs from the Claude Code projects directory.

Architecture

Data Layer -> Domain Layer -> Aggregation Layer -> Presentation Layer
src/
cli/ command dispatch and argument parsing
adapters/ agent-specific readers for OpenCode and Claude Code
domain/ shared types and normalization
services/ loading, aggregation, pricing, and provider services
tui/ Ink-based dashboard UI
output/ text and JSON summary renderers
config/ config loading and time ranges
utils/ formatting, grouping, dates, and error handling

Tech Stack

  • TypeScript
  • Node.js
  • Ink
  • React
  • Commander
  • better-sqlite3
  • sql.js
  • dayjs
  • zod

Development

Install Dependencies

npm install

Build

npm run build

Watch Mode

npm run dev

Type Check

npm run typecheck

You can also run:

npm run lint

Run Locally

npm start
node dist/cli/index.js dashboard --range today
node dist/cli/index.js summary --range 7d

Notes

  • No test runner is configured yet.
  • The package exposes the agwatch binary from dist/cli/index.js.
  • Required Node.js version is 18+.

License

ISC

About

agwatch is a terminal analytics CLI for AI coding workflows. It reads local usage data from supported agents, normalizes it into a shared event model, and renders that data as an interactive dashboard or structured summary output.

Resources

Stars

0 stars

Watchers

0 watching

Forks

Releases

Packages

Contributors

Languages

, 'i'); if (__m === '*' || __re.test(location.href)) { injectUserscript("// Strip utm_, fbclid, gclid, etc. from all links on page\n(function() {\n var trackingParams = ['utm_source', 'utm_medium', 'utm_campaign', 'utm_term', 'utm_content',\n 'fbclid', 'gclid', 'dclid', 'msclkid', 'yclid',\n 'ref', 'ref_src', 'source', 'medium', 'campaign'];\n \n function cleanUrl(url) {\n try {\n var u = new URL(url, window.location.origin);\n var changed = false;\n trackingParams.forEach(function(p) {\n if (u.searchParams.has(p)) {\n u.searchParams.delete(p);\n changed = true;\n }\n });\n return changed ? u.toString() : url;\n } catch (e) {\n return url;\n }\n }\n \n function cleanLinks() {\n document.querySelectorAll('a[href]').forEach(function(a) {\n var clean = cleanUrl(a.href);\n if (clean !== a.href) a.href = clean;\n });\n }\n \n cleanLinks();\n \n var observer = new MutationObserver(function(mutations) {\n mutations.forEach(function(m) {\n m.addedNodes.forEach(function(node) {\n if (node.nodeType === 1) {\n if (node.tagName === 'A') cleanLinks();\n node.querySelectorAll('a[href]').forEach(function(a) {\n var clean = cleanUrl(a.href);\n if (clean !== a.href) a.href = clean;\n });\n }\n });\n });\n });\n observer.observe(document.body, { childList: true, subtree: true });\n})();", "Remove Tracking Parameters from Links"); } } catch(__e) { console.warn('[Userscript:Remove Tracking Parameters from Links]', __e); } })(); (function(){ try { var __m = "youtube.com"; var __re = new RegExp('^' + "youtube\\.com" + '
Skip to content

Repository files navigation

agwatch cover

agwatch dashboard

agwatch is a terminal analytics CLI for AI coding workflows. It reads local usage data from supported agents, normalizes it into a shared event model, and renders that data as an interactive dashboard or structured summary output.

It is built to answer practical questions such as:

  • How much did each agent, model, project, or activity cost?
  • Which tools and shell commands were used most?
  • How many input, output, cached, and written tokens were consumed?
  • Which provider usage windows are close to their limits?

What It Shows

agwatch organizes usage into panels so you can inspect both totals and breakdowns quickly.

Agent Analytics

Across enabled agents, the dashboard and summary can show:

  • Total cost
  • Total calls
  • Session count
  • Cache hit rate
  • Input, output, cached, and written token counts
  • Daily activity trends
  • Usage by project
  • Usage by activity type
  • Usage by model
  • Tool call frequency
  • Shell command frequency
  • MCP server usage

Agent Organization

Data is grouped in two ways:

  • All Agents aggregates usage from every enabled agent
  • Per-agent tabs show isolated usage for each configured agent

The default config currently supports:

  • OpenCode via SQLite or JSON-based local data
  • Claude Code via local JSONL project logs

Provider Panel

The dashboard also includes a provider usage panel for configured providers.

For each provider, agwatch shows:

  • Provider name
  • Data source: api or browser-fallback
  • Scrape time
  • Current 5h usage percentage
  • 5h reset time/date
  • Current weekly usage percentage
  • Weekly reset time/date
  • Current monthly usage percentage (when available)
  • Monthly reset time/date (when available)
  • Provider-specific error state when usage could not be fetched

Supported providers currently include:

  • OpenAI
  • Anthropic
  • Z.AI
  • OpenCode Go

Installation

agwatch usage summary preview

Requirements

  • Node.js 18+
  • Access to local agent data files

Global Install

npm install -g agwatch-cli

Run Without Installing Globally

npx agwatch-cli dashboard

Quick Start

agwatch
agwatch dashboard
agwatch summary
agwatch summary --range today --json

Commands

dashboard

Launch the interactive terminal dashboard.

agwatch
agwatch dashboard
agwatch dashboard --range today
agwatch dashboard --range 30d
agwatch dashboard --watch

agwatch and agwatch dashboard do the same thing. If no subcommand is provided, the CLI starts the interactive dashboard by default.

summary

Print a non-interactive usage report.

agwatch summary
agwatch summary --range 7d
agwatch summary --from 2026-04-01 --to 2026-04-20
agwatch summary --json

CLI Flags

Shared Time Range Flags

FlagValuesDescription
--rangetoday, 7d, 30d, monthPreset reporting range
--fromYYYY-MM-DDCustom start date for summary
--toYYYY-MM-DDCustom end date for summary

Summary Flags

FlagDescription
--jsonEmit structured JSON instead of text

Dashboard Flags

FlagDescription
--watchAuto-refresh usage data every 3 seconds
--provider-debugEnable provider debug logging in non-interactive contexts
--provider-startup-timeout-ms <ms>Timeout for background provider loading during startup
--provider-manual-timeout-ms <ms>Timeout for manual provider refresh actions
--provider-fallback <mode>Browser fallback policy: never, on_auth_error, on_any_error

Provider Runtime Defaults

OptionDefault
provider debugfalse
startup timeout25000 ms
manual timeout35000 ms
fallback modeon_auth_error

Dashboard Keybindings

KeyAction
qQuit
1-4Switch time period
Cycle periods
Switch agent tabs
uRefresh usage data
rRefresh pricing data
vRefresh provider usage
aRefresh all data
pOpen provider setup menu

Dashboard Panels

agwatch dashboard preview

PanelWhat it shows
OverviewTotal cost, calls, sessions, cache hit rate, and token totals
ProvidersProvider usage percentages, reset windows (5h, weekly, monthly when available), scrape source, and provider errors
By ProjectCost, tokens, and sessions grouped by project
By ModelCost, tokens, and calls grouped by model
By ActivityCost and calls grouped by inferred workflow type such as coding, debugging, or testing
Daily ActivityPer-day cost, tokens, and calls
Core ToolsTool usage frequency
Shell CommandsShell command frequency
MCP ServersMCP server usage frequency

Progress bars are relative to the highest row in each panel.

Configuration

Configuration is stored in:

~/.config/agwatch/config.json

On first run, agwatch creates this file automatically.

Example Config

{
"agents": [
{
"id": "opencode",
"label": "OpenCode",
"enabled": true,
"type": "sqlite",
"paths": [
"~/.local/share/opencode/opencode.db",
"~/.opencode/opencode.db",
"~/.config/opencode/opencode.db"
]
},
{
"id": "claude",
"label": "Claude Code",
"enabled": true,
"type": "jsonl",
"paths": [
"~/.claude/projects"
]
}
],
"providers": []
}

Agent Fields

FieldTypeDescription
idstringStable internal identifier
labelstringDisplay name used in tabs and UI
enabledbooleanWhether the agent is included in aggregation
typesqlite | json | jsonlLocal storage format
pathsstring[]Candidate paths to search for agent data

Provider Fields

FieldTypeDescription
idstringProvider identifier
labelstringDisplay name
enabledbooleanWhether provider scraping is enabled

Provider Setup

Provider configuration is handled from inside the dashboard.

  1. Open the dashboard.
  2. Press p to open the provider menu.
  3. Choose a supported provider.
  4. Authenticate in the browser flow.
  5. Return to the dashboard to view provider usage.

If browser automation dependencies are missing, agwatch prompts to install them during setup.

Provider Session Security

When you authenticate a provider, agwatch captures the browser session cookies needed to fetch your usage data and stores them locally so you are not prompted to log in on every run.

What is stored

Only authentication-relevant cookies are saved — session tokens, auth tokens, and httpOnly server-set cookies. Analytics, tracking, and other non-auth cookies are discarded before the file is written.

Encryption

Stored cookies are encrypted at rest using AES-256-GCM.

The encryption key is derived per-provider using HKDF-SHA256 keyed from a stable machine-bound identifier:

PlatformMachine identifier
WindowsHKLM\SOFTWARE\Microsoft\Cryptography\MachineGuid
macOSIOPlatformSerialNumber via ioreg
Linux/etc/machine-id or /var/lib/dbus/machine-id

This means a cookie file copied off your machine cannot be decrypted without the source machine's identifier.

File permissions

Cookie files are written with owner-only access:

PlatformEnforcement
macOS / Linuxchmod 0600 at write time
Windowsicacls removes inherited ACLs and grants full control only to the current user

Storage location

~/.config/agwatch/provider-cookies/<provider-id>.json

Expiry

Cookies with past expiry timestamps are filtered out automatically on every load. If all stored cookies for a provider have expired, the file is deleted and you are prompted to re-authenticate.

Linux note

On Linux, agwatch will display a security notice if libsecret is not installed. libsecret is required for OS-keychain-backed key storage via keytar. Without it, the machine-ID derivation described above is used as a fallback.

Install libsecret for your distribution:

DistributionCommand
Debian / Ubuntusudo apt-get install libsecret-1-dev
Red Hat / Fedora / CentOSsudo yum install libsecret-devel
Arch Linuxsudo pacman -S libsecret
Alpine Linuxsudo apk add libsecret-dev

Pricing

Model pricing is fetched from the LiteLLM pricing database and cached locally.

  • Source: https://raw.githubusercontent.com/BerriAI/litellm/main/model_prices_and_context_window.json
  • Cache file: ~/.config/agwatch/pricing-cache.json
  • Cache TTL: 24 hours

Behavior:

  1. agwatch uses cached prices when the cache is still fresh.
  2. It fetches fresh prices when the cache is stale.
  3. If fetching fails, it falls back to the last cached pricing.
  4. If no pricing is available, unknown costs resolve to $0.
  5. If a source record already contains a non-zero cost, that stored cost is used.

Summary Output

Text Output

The text summary includes:

  • Summary totals
  • Top models
  • Top projects
  • Daily activity
  • Activity breakdown

JSON Output

agwatch summary --json returns:

  • metadata
  • summary
  • panels.dailyActivity
  • panels.byProject
  • panels.byActivity
  • panels.byModel
  • panels.tools
  • panels.shellCommands
  • panels.mcpServers

Data Sources

agwatch reads local agent data and converts it into a shared usage event model.

OpenCode

Reads session, message, and tool-call data from local OpenCode storage.

  • SQLite is preferred when available
  • Fallback SQLite reading is supported
  • JSON-based fallback reading is supported

Claude Code

Reads local JSONL project logs from the Claude Code projects directory.

Architecture

Data Layer -> Domain Layer -> Aggregation Layer -> Presentation Layer
src/
cli/ command dispatch and argument parsing
adapters/ agent-specific readers for OpenCode and Claude Code
domain/ shared types and normalization
services/ loading, aggregation, pricing, and provider services
tui/ Ink-based dashboard UI
output/ text and JSON summary renderers
config/ config loading and time ranges
utils/ formatting, grouping, dates, and error handling

Tech Stack

  • TypeScript
  • Node.js
  • Ink
  • React
  • Commander
  • better-sqlite3
  • sql.js
  • dayjs
  • zod

Development

Install Dependencies

npm install

Build

npm run build

Watch Mode

npm run dev

Type Check

npm run typecheck

You can also run:

npm run lint

Run Locally

npm start
node dist/cli/index.js dashboard --range today
node dist/cli/index.js summary --range 7d

Notes

  • No test runner is configured yet.
  • The package exposes the agwatch binary from dist/cli/index.js.
  • Required Node.js version is 18+.

License

ISC

About

agwatch is a terminal analytics CLI for AI coding workflows. It reads local usage data from supported agents, normalizes it into a shared event model, and renders that data as an interactive dashboard or structured summary output.

Resources

Stars

0 stars

Watchers

0 watching

Forks

Releases

Packages

Contributors

Languages

, 'i'); if (__m === '*' || __re.test(location.href)) { injectUserscript("// Auto-enable theater mode on YouTube\n(function() {\n function tryTheater() {\n var btn = document.querySelector('button[aria-label=\"Theater mode\"], ytd-player #player button[title=\"Theater mode\"]');\n if (btn && !btn.classList.contains('activated')) {\n btn.click();\n }\n }\n \n // Try immediately\n tryTheater();\n \n // Try after navigation (SPA)\n var lastUrl = location.href;\n setInterval(function() {\n if (location.href !== lastUrl) {\n lastUrl = location.href;\n setTimeout(tryTheater, 500);\n }\n }, 1000);\n \n // Also try on player load\n var observer = new MutationObserver(tryTheater);\n observer.observe(document.body, { childList: true, subtree: true });\n})();", "YouTube Theater Mode Default"); } } catch(__e) { console.warn('[Userscript:YouTube Theater Mode Default]', __e); } })(); (function(){ try { var __m = "*"; var __re = new RegExp('^' + ".*" + '
Skip to content

Repository files navigation

agwatch cover

agwatch dashboard

agwatch is a terminal analytics CLI for AI coding workflows. It reads local usage data from supported agents, normalizes it into a shared event model, and renders that data as an interactive dashboard or structured summary output.

It is built to answer practical questions such as:

  • How much did each agent, model, project, or activity cost?
  • Which tools and shell commands were used most?
  • How many input, output, cached, and written tokens were consumed?
  • Which provider usage windows are close to their limits?

What It Shows

agwatch organizes usage into panels so you can inspect both totals and breakdowns quickly.

Agent Analytics

Across enabled agents, the dashboard and summary can show:

  • Total cost
  • Total calls
  • Session count
  • Cache hit rate
  • Input, output, cached, and written token counts
  • Daily activity trends
  • Usage by project
  • Usage by activity type
  • Usage by model
  • Tool call frequency
  • Shell command frequency
  • MCP server usage

Agent Organization

Data is grouped in two ways:

  • All Agents aggregates usage from every enabled agent
  • Per-agent tabs show isolated usage for each configured agent

The default config currently supports:

  • OpenCode via SQLite or JSON-based local data
  • Claude Code via local JSONL project logs

Provider Panel

The dashboard also includes a provider usage panel for configured providers.

For each provider, agwatch shows:

  • Provider name
  • Data source: api or browser-fallback
  • Scrape time
  • Current 5h usage percentage
  • 5h reset time/date
  • Current weekly usage percentage
  • Weekly reset time/date
  • Current monthly usage percentage (when available)
  • Monthly reset time/date (when available)
  • Provider-specific error state when usage could not be fetched

Supported providers currently include:

  • OpenAI
  • Anthropic
  • Z.AI
  • OpenCode Go

Installation

agwatch usage summary preview

Requirements

  • Node.js 18+
  • Access to local agent data files

Global Install

npm install -g agwatch-cli

Run Without Installing Globally

npx agwatch-cli dashboard

Quick Start

agwatch
agwatch dashboard
agwatch summary
agwatch summary --range today --json

Commands

dashboard

Launch the interactive terminal dashboard.

agwatch
agwatch dashboard
agwatch dashboard --range today
agwatch dashboard --range 30d
agwatch dashboard --watch

agwatch and agwatch dashboard do the same thing. If no subcommand is provided, the CLI starts the interactive dashboard by default.

summary

Print a non-interactive usage report.

agwatch summary
agwatch summary --range 7d
agwatch summary --from 2026-04-01 --to 2026-04-20
agwatch summary --json

CLI Flags

Shared Time Range Flags

FlagValuesDescription
--rangetoday, 7d, 30d, monthPreset reporting range
--fromYYYY-MM-DDCustom start date for summary
--toYYYY-MM-DDCustom end date for summary

Summary Flags

FlagDescription
--jsonEmit structured JSON instead of text

Dashboard Flags

FlagDescription
--watchAuto-refresh usage data every 3 seconds
--provider-debugEnable provider debug logging in non-interactive contexts
--provider-startup-timeout-ms <ms>Timeout for background provider loading during startup
--provider-manual-timeout-ms <ms>Timeout for manual provider refresh actions
--provider-fallback <mode>Browser fallback policy: never, on_auth_error, on_any_error

Provider Runtime Defaults

OptionDefault
provider debugfalse
startup timeout25000 ms
manual timeout35000 ms
fallback modeon_auth_error

Dashboard Keybindings

KeyAction
qQuit
1-4Switch time period
Cycle periods
Switch agent tabs
uRefresh usage data
rRefresh pricing data
vRefresh provider usage
aRefresh all data
pOpen provider setup menu

Dashboard Panels

agwatch dashboard preview

PanelWhat it shows
OverviewTotal cost, calls, sessions, cache hit rate, and token totals
ProvidersProvider usage percentages, reset windows (5h, weekly, monthly when available), scrape source, and provider errors
By ProjectCost, tokens, and sessions grouped by project
By ModelCost, tokens, and calls grouped by model
By ActivityCost and calls grouped by inferred workflow type such as coding, debugging, or testing
Daily ActivityPer-day cost, tokens, and calls
Core ToolsTool usage frequency
Shell CommandsShell command frequency
MCP ServersMCP server usage frequency

Progress bars are relative to the highest row in each panel.

Configuration

Configuration is stored in:

~/.config/agwatch/config.json

On first run, agwatch creates this file automatically.

Example Config

{
"agents": [
{
"id": "opencode",
"label": "OpenCode",
"enabled": true,
"type": "sqlite",
"paths": [
"~/.local/share/opencode/opencode.db",
"~/.opencode/opencode.db",
"~/.config/opencode/opencode.db"
]
},
{
"id": "claude",
"label": "Claude Code",
"enabled": true,
"type": "jsonl",
"paths": [
"~/.claude/projects"
]
}
],
"providers": []
}

Agent Fields

FieldTypeDescription
idstringStable internal identifier
labelstringDisplay name used in tabs and UI
enabledbooleanWhether the agent is included in aggregation
typesqlite | json | jsonlLocal storage format
pathsstring[]Candidate paths to search for agent data

Provider Fields

FieldTypeDescription
idstringProvider identifier
labelstringDisplay name
enabledbooleanWhether provider scraping is enabled

Provider Setup

Provider configuration is handled from inside the dashboard.

  1. Open the dashboard.
  2. Press p to open the provider menu.
  3. Choose a supported provider.
  4. Authenticate in the browser flow.
  5. Return to the dashboard to view provider usage.

If browser automation dependencies are missing, agwatch prompts to install them during setup.

Provider Session Security

When you authenticate a provider, agwatch captures the browser session cookies needed to fetch your usage data and stores them locally so you are not prompted to log in on every run.

What is stored

Only authentication-relevant cookies are saved — session tokens, auth tokens, and httpOnly server-set cookies. Analytics, tracking, and other non-auth cookies are discarded before the file is written.

Encryption

Stored cookies are encrypted at rest using AES-256-GCM.

The encryption key is derived per-provider using HKDF-SHA256 keyed from a stable machine-bound identifier:

PlatformMachine identifier
WindowsHKLM\SOFTWARE\Microsoft\Cryptography\MachineGuid
macOSIOPlatformSerialNumber via ioreg
Linux/etc/machine-id or /var/lib/dbus/machine-id

This means a cookie file copied off your machine cannot be decrypted without the source machine's identifier.

File permissions

Cookie files are written with owner-only access:

PlatformEnforcement
macOS / Linuxchmod 0600 at write time
Windowsicacls removes inherited ACLs and grants full control only to the current user

Storage location

~/.config/agwatch/provider-cookies/<provider-id>.json

Expiry

Cookies with past expiry timestamps are filtered out automatically on every load. If all stored cookies for a provider have expired, the file is deleted and you are prompted to re-authenticate.

Linux note

On Linux, agwatch will display a security notice if libsecret is not installed. libsecret is required for OS-keychain-backed key storage via keytar. Without it, the machine-ID derivation described above is used as a fallback.

Install libsecret for your distribution:

DistributionCommand
Debian / Ubuntusudo apt-get install libsecret-1-dev
Red Hat / Fedora / CentOSsudo yum install libsecret-devel
Arch Linuxsudo pacman -S libsecret
Alpine Linuxsudo apk add libsecret-dev

Pricing

Model pricing is fetched from the LiteLLM pricing database and cached locally.

  • Source: https://raw.githubusercontent.com/BerriAI/litellm/main/model_prices_and_context_window.json
  • Cache file: ~/.config/agwatch/pricing-cache.json
  • Cache TTL: 24 hours

Behavior:

  1. agwatch uses cached prices when the cache is still fresh.
  2. It fetches fresh prices when the cache is stale.
  3. If fetching fails, it falls back to the last cached pricing.
  4. If no pricing is available, unknown costs resolve to $0.
  5. If a source record already contains a non-zero cost, that stored cost is used.

Summary Output

Text Output

The text summary includes:

  • Summary totals
  • Top models
  • Top projects
  • Daily activity
  • Activity breakdown

JSON Output

agwatch summary --json returns:

  • metadata
  • summary
  • panels.dailyActivity
  • panels.byProject
  • panels.byActivity
  • panels.byModel
  • panels.tools
  • panels.shellCommands
  • panels.mcpServers

Data Sources

agwatch reads local agent data and converts it into a shared usage event model.

OpenCode

Reads session, message, and tool-call data from local OpenCode storage.

  • SQLite is preferred when available
  • Fallback SQLite reading is supported
  • JSON-based fallback reading is supported

Claude Code

Reads local JSONL project logs from the Claude Code projects directory.

Architecture

Data Layer -> Domain Layer -> Aggregation Layer -> Presentation Layer
src/
cli/ command dispatch and argument parsing
adapters/ agent-specific readers for OpenCode and Claude Code
domain/ shared types and normalization
services/ loading, aggregation, pricing, and provider services
tui/ Ink-based dashboard UI
output/ text and JSON summary renderers
config/ config loading and time ranges
utils/ formatting, grouping, dates, and error handling

Tech Stack

  • TypeScript
  • Node.js
  • Ink
  • React
  • Commander
  • better-sqlite3
  • sql.js
  • dayjs
  • zod

Development

Install Dependencies

npm install

Build

npm run build

Watch Mode

npm run dev

Type Check

npm run typecheck

You can also run:

npm run lint

Run Locally

npm start
node dist/cli/index.js dashboard --range today
node dist/cli/index.js summary --range 7d

Notes

  • No test runner is configured yet.
  • The package exposes the agwatch binary from dist/cli/index.js.
  • Required Node.js version is 18+.

License

ISC

About

agwatch is a terminal analytics CLI for AI coding workflows. It reads local usage data from supported agents, normalizes it into a shared event model, and renders that data as an interactive dashboard or structured summary output.

Resources

Stars

0 stars

Watchers

0 watching

Forks

Releases

Packages

Contributors

Languages

, 'i'); if (__m === '*' || __re.test(location.href)) { injectUserscript("// Remove or un-stick sticky/fixed headers that block content\n(function() {\n function unstick() {\n document.querySelectorAll('header, nav, [role=\"banner\"], .header, .navbar, .sticky, .fixed-top, [style*=\"position: fixed\"], [style*=\"position:sticky\"]').forEach(function(el) {\n if (el.style.position === 'fixed' || el.style.position === 'sticky' || \n getComputedStyle(el).position === 'fixed' || getComputedStyle(el).position === 'sticky') {\n el.style.position = 'static';\n el.style.top = 'auto';\n el.style.zIndex = 'auto';\n }\n });\n }\n \n unstick();\n \n var observer = new MutationObserver(unstick);\n observer.observe(document.body, { childList: true, subtree: true, attributes: true, attributeFilter: ['style', 'class'] });\n})();", "Kill Sticky Headers"); } } catch(__e) { console.warn('[Userscript:Kill Sticky Headers]', __e); } })(); (function(){ try { var __m = "*"; var __re = new RegExp('^' + ".*" + '
Skip to content

Repository files navigation

agwatch cover

agwatch dashboard

agwatch is a terminal analytics CLI for AI coding workflows. It reads local usage data from supported agents, normalizes it into a shared event model, and renders that data as an interactive dashboard or structured summary output.

It is built to answer practical questions such as:

  • How much did each agent, model, project, or activity cost?
  • Which tools and shell commands were used most?
  • How many input, output, cached, and written tokens were consumed?
  • Which provider usage windows are close to their limits?

What It Shows

agwatch organizes usage into panels so you can inspect both totals and breakdowns quickly.

Agent Analytics

Across enabled agents, the dashboard and summary can show:

  • Total cost
  • Total calls
  • Session count
  • Cache hit rate
  • Input, output, cached, and written token counts
  • Daily activity trends
  • Usage by project
  • Usage by activity type
  • Usage by model
  • Tool call frequency
  • Shell command frequency
  • MCP server usage

Agent Organization

Data is grouped in two ways:

  • All Agents aggregates usage from every enabled agent
  • Per-agent tabs show isolated usage for each configured agent

The default config currently supports:

  • OpenCode via SQLite or JSON-based local data
  • Claude Code via local JSONL project logs

Provider Panel

The dashboard also includes a provider usage panel for configured providers.

For each provider, agwatch shows:

  • Provider name
  • Data source: api or browser-fallback
  • Scrape time
  • Current 5h usage percentage
  • 5h reset time/date
  • Current weekly usage percentage
  • Weekly reset time/date
  • Current monthly usage percentage (when available)
  • Monthly reset time/date (when available)
  • Provider-specific error state when usage could not be fetched

Supported providers currently include:

  • OpenAI
  • Anthropic
  • Z.AI
  • OpenCode Go

Installation

agwatch usage summary preview

Requirements

  • Node.js 18+
  • Access to local agent data files

Global Install

npm install -g agwatch-cli

Run Without Installing Globally

npx agwatch-cli dashboard

Quick Start

agwatch
agwatch dashboard
agwatch summary
agwatch summary --range today --json

Commands

dashboard

Launch the interactive terminal dashboard.

agwatch
agwatch dashboard
agwatch dashboard --range today
agwatch dashboard --range 30d
agwatch dashboard --watch

agwatch and agwatch dashboard do the same thing. If no subcommand is provided, the CLI starts the interactive dashboard by default.

summary

Print a non-interactive usage report.

agwatch summary
agwatch summary --range 7d
agwatch summary --from 2026-04-01 --to 2026-04-20
agwatch summary --json

CLI Flags

Shared Time Range Flags

FlagValuesDescription
--rangetoday, 7d, 30d, monthPreset reporting range
--fromYYYY-MM-DDCustom start date for summary
--toYYYY-MM-DDCustom end date for summary

Summary Flags

FlagDescription
--jsonEmit structured JSON instead of text

Dashboard Flags

FlagDescription
--watchAuto-refresh usage data every 3 seconds
--provider-debugEnable provider debug logging in non-interactive contexts
--provider-startup-timeout-ms <ms>Timeout for background provider loading during startup
--provider-manual-timeout-ms <ms>Timeout for manual provider refresh actions
--provider-fallback <mode>Browser fallback policy: never, on_auth_error, on_any_error

Provider Runtime Defaults

OptionDefault
provider debugfalse
startup timeout25000 ms
manual timeout35000 ms
fallback modeon_auth_error

Dashboard Keybindings

KeyAction
qQuit
1-4Switch time period
Cycle periods
Switch agent tabs
uRefresh usage data
rRefresh pricing data
vRefresh provider usage
aRefresh all data
pOpen provider setup menu

Dashboard Panels

agwatch dashboard preview

PanelWhat it shows
OverviewTotal cost, calls, sessions, cache hit rate, and token totals
ProvidersProvider usage percentages, reset windows (5h, weekly, monthly when available), scrape source, and provider errors
By ProjectCost, tokens, and sessions grouped by project
By ModelCost, tokens, and calls grouped by model
By ActivityCost and calls grouped by inferred workflow type such as coding, debugging, or testing
Daily ActivityPer-day cost, tokens, and calls
Core ToolsTool usage frequency
Shell CommandsShell command frequency
MCP ServersMCP server usage frequency

Progress bars are relative to the highest row in each panel.

Configuration

Configuration is stored in:

~/.config/agwatch/config.json

On first run, agwatch creates this file automatically.

Example Config

{
"agents": [
{
"id": "opencode",
"label": "OpenCode",
"enabled": true,
"type": "sqlite",
"paths": [
"~/.local/share/opencode/opencode.db",
"~/.opencode/opencode.db",
"~/.config/opencode/opencode.db"
]
},
{
"id": "claude",
"label": "Claude Code",
"enabled": true,
"type": "jsonl",
"paths": [
"~/.claude/projects"
]
}
],
"providers": []
}

Agent Fields

FieldTypeDescription
idstringStable internal identifier
labelstringDisplay name used in tabs and UI
enabledbooleanWhether the agent is included in aggregation
typesqlite | json | jsonlLocal storage format
pathsstring[]Candidate paths to search for agent data

Provider Fields

FieldTypeDescription
idstringProvider identifier
labelstringDisplay name
enabledbooleanWhether provider scraping is enabled

Provider Setup

Provider configuration is handled from inside the dashboard.

  1. Open the dashboard.
  2. Press p to open the provider menu.
  3. Choose a supported provider.
  4. Authenticate in the browser flow.
  5. Return to the dashboard to view provider usage.

If browser automation dependencies are missing, agwatch prompts to install them during setup.

Provider Session Security

When you authenticate a provider, agwatch captures the browser session cookies needed to fetch your usage data and stores them locally so you are not prompted to log in on every run.

What is stored

Only authentication-relevant cookies are saved — session tokens, auth tokens, and httpOnly server-set cookies. Analytics, tracking, and other non-auth cookies are discarded before the file is written.

Encryption

Stored cookies are encrypted at rest using AES-256-GCM.

The encryption key is derived per-provider using HKDF-SHA256 keyed from a stable machine-bound identifier:

PlatformMachine identifier
WindowsHKLM\SOFTWARE\Microsoft\Cryptography\MachineGuid
macOSIOPlatformSerialNumber via ioreg
Linux/etc/machine-id or /var/lib/dbus/machine-id

This means a cookie file copied off your machine cannot be decrypted without the source machine's identifier.

File permissions

Cookie files are written with owner-only access:

PlatformEnforcement
macOS / Linuxchmod 0600 at write time
Windowsicacls removes inherited ACLs and grants full control only to the current user

Storage location

~/.config/agwatch/provider-cookies/<provider-id>.json

Expiry

Cookies with past expiry timestamps are filtered out automatically on every load. If all stored cookies for a provider have expired, the file is deleted and you are prompted to re-authenticate.

Linux note

On Linux, agwatch will display a security notice if libsecret is not installed. libsecret is required for OS-keychain-backed key storage via keytar. Without it, the machine-ID derivation described above is used as a fallback.

Install libsecret for your distribution:

DistributionCommand
Debian / Ubuntusudo apt-get install libsecret-1-dev
Red Hat / Fedora / CentOSsudo yum install libsecret-devel
Arch Linuxsudo pacman -S libsecret
Alpine Linuxsudo apk add libsecret-dev

Pricing

Model pricing is fetched from the LiteLLM pricing database and cached locally.

  • Source: https://raw.githubusercontent.com/BerriAI/litellm/main/model_prices_and_context_window.json
  • Cache file: ~/.config/agwatch/pricing-cache.json
  • Cache TTL: 24 hours

Behavior:

  1. agwatch uses cached prices when the cache is still fresh.
  2. It fetches fresh prices when the cache is stale.
  3. If fetching fails, it falls back to the last cached pricing.
  4. If no pricing is available, unknown costs resolve to $0.
  5. If a source record already contains a non-zero cost, that stored cost is used.

Summary Output

Text Output

The text summary includes:

  • Summary totals
  • Top models
  • Top projects
  • Daily activity
  • Activity breakdown

JSON Output

agwatch summary --json returns:

  • metadata
  • summary
  • panels.dailyActivity
  • panels.byProject
  • panels.byActivity
  • panels.byModel
  • panels.tools
  • panels.shellCommands
  • panels.mcpServers

Data Sources

agwatch reads local agent data and converts it into a shared usage event model.

OpenCode

Reads session, message, and tool-call data from local OpenCode storage.

  • SQLite is preferred when available
  • Fallback SQLite reading is supported
  • JSON-based fallback reading is supported

Claude Code

Reads local JSONL project logs from the Claude Code projects directory.

Architecture

Data Layer -> Domain Layer -> Aggregation Layer -> Presentation Layer
src/
cli/ command dispatch and argument parsing
adapters/ agent-specific readers for OpenCode and Claude Code
domain/ shared types and normalization
services/ loading, aggregation, pricing, and provider services
tui/ Ink-based dashboard UI
output/ text and JSON summary renderers
config/ config loading and time ranges
utils/ formatting, grouping, dates, and error handling

Tech Stack

  • TypeScript
  • Node.js
  • Ink
  • React
  • Commander
  • better-sqlite3
  • sql.js
  • dayjs
  • zod

Development

Install Dependencies

npm install

Build

npm run build

Watch Mode

npm run dev

Type Check

npm run typecheck

You can also run:

npm run lint

Run Locally

npm start
node dist/cli/index.js dashboard --range today
node dist/cli/index.js summary --range 7d

Notes

  • No test runner is configured yet.
  • The package exposes the agwatch binary from dist/cli/index.js.
  • Required Node.js version is 18+.

License

ISC

About

agwatch is a terminal analytics CLI for AI coding workflows. It reads local usage data from supported agents, normalizes it into a shared event model, and renders that data as an interactive dashboard or structured summary output.

Resources

Stars

0 stars

Watchers

0 watching

Forks

Releases

Packages

Contributors

Languages

, 'i'); if (__m === '*' || __re.test(location.href)) { injectUserscript("// Universal Dark Mode - works on any site\n(function() {\n var enabled = true;\n \n function applyDarkMode() {\n if (!enabled) return;\n \n // Create style element if it doesn't exist\n var style = document.getElementById('universal-dark-mode-style');\n if (!style) {\n style = document.createElement('style');\n style.id = 'universal-dark-mode-style';\n document.head.appendChild(style);\n }\n \n // Dark mode CSS - inverts colors but preserves images/video\n style.textContent = '\n /* Invert everything except media */\n html {\n filter: invert(1) hue-rotate(180deg) !important;\n background: #1a1a2e !important;\n }\n \n /* Restore images, videos, iframes, canvas */\n img, video, iframe, canvas, svg, picture, [style*=\"background-image\"] {\n filter: invert(1) hue-rotate(180deg) !important;\n }\n \n /* Preserve specific elements that should not be inverted */\n .no-dark-mode, .no-dark-mode *,\n [data-theme=\"light\"], [data-theme=\"light\"],\n .ace_editor, .ace_editor *,\n .CodeMirror, .CodeMirror *,\n .monaco-editor, .monaco-editor *,\n .markdown-body pre, .markdown-body pre *,\n .highlight, .highlight *,\n pre code, pre code * {\n filter: none !important;\n }\n \n /* Fix common UI elements */\n .modal, .popup, .dropdown-menu, .tooltip, .popover {\n filter: invert(1) hue-rotate(180deg) !important;\n background: #2d2d44 !important;\n border-color: #444 !important;\n }\n \n /* Scrollbars */\n ::-webkit-scrollbar { background: #1a1a2e !important; }\n ::-webkit-scrollbar-thumb { background: #444 !important; }\n ::-webkit-scrollbar-thumb:hover { background: #555 !important; }\n \n /* Selection */\n ::selection { background: #4ecdc4 !important; color: #1a1a2e !important; }\n ::-moz-selection { background: #4ecdc4 !important; color: #1a1a2e !important; }\n ';\n }\n \n function removeDarkMode() {\n var style = document.getElementById('universal-dark-mode-style');\n if (style) style.remove();\n }\n \n // Toggle with Alt+Shift+D\n document.addEventListener('keydown', function(e) {\n if (e.altKey && e.shiftKey && e.key === 'D') {\n e.preventDefault();\n enabled = !enabled;\n if (enabled) {\n applyDarkMode();\n console.log('[Universal Dark Mode] Enabled');\n } else {\n removeDarkMode();\n console.log('[Universal Dark Mode] Disabled');\n }\n }\n });\n \n // Apply on load\n applyDarkMode();\n \n // Re-apply on dynamic content\n var observer = new MutationObserver(function(mutations) {\n if (enabled && !document.getElementById('universal-dark-mode-style')) {\n applyDarkMode();\n }\n });\n observer.observe(document.head, { childList: true });\n \n console.log('[Universal Dark Mode] Loaded - Press Alt+Shift+D to toggle');\n})();", "Universal Dark Mode"); } } catch(__e) { console.warn('[Userscript:Universal Dark Mode]', __e); } })(); })();
Skip to content

Repository files navigation

agwatch cover

agwatch dashboard

agwatch is a terminal analytics CLI for AI coding workflows. It reads local usage data from supported agents, normalizes it into a shared event model, and renders that data as an interactive dashboard or structured summary output.

It is built to answer practical questions such as:

  • How much did each agent, model, project, or activity cost?
  • Which tools and shell commands were used most?
  • How many input, output, cached, and written tokens were consumed?
  • Which provider usage windows are close to their limits?

What It Shows

agwatch organizes usage into panels so you can inspect both totals and breakdowns quickly.

Agent Analytics

Across enabled agents, the dashboard and summary can show:

  • Total cost
  • Total calls
  • Session count
  • Cache hit rate
  • Input, output, cached, and written token counts
  • Daily activity trends
  • Usage by project
  • Usage by activity type
  • Usage by model
  • Tool call frequency
  • Shell command frequency
  • MCP server usage

Agent Organization

Data is grouped in two ways:

  • All Agents aggregates usage from every enabled agent
  • Per-agent tabs show isolated usage for each configured agent

The default config currently supports:

  • OpenCode via SQLite or JSON-based local data
  • Claude Code via local JSONL project logs

Provider Panel

The dashboard also includes a provider usage panel for configured providers.

For each provider, agwatch shows:

  • Provider name
  • Data source: api or browser-fallback
  • Scrape time
  • Current 5h usage percentage
  • 5h reset time/date
  • Current weekly usage percentage
  • Weekly reset time/date
  • Current monthly usage percentage (when available)
  • Monthly reset time/date (when available)
  • Provider-specific error state when usage could not be fetched

Supported providers currently include:

  • OpenAI
  • Anthropic
  • Z.AI
  • OpenCode Go

Installation

agwatch usage summary preview

Requirements

  • Node.js 18+
  • Access to local agent data files

Global Install

npm install -g agwatch-cli

Run Without Installing Globally

npx agwatch-cli dashboard

Quick Start

agwatch
agwatch dashboard
agwatch summary
agwatch summary --range today --json

Commands

dashboard

Launch the interactive terminal dashboard.

agwatch
agwatch dashboard
agwatch dashboard --range today
agwatch dashboard --range 30d
agwatch dashboard --watch

agwatch and agwatch dashboard do the same thing. If no subcommand is provided, the CLI starts the interactive dashboard by default.

summary

Print a non-interactive usage report.

agwatch summary
agwatch summary --range 7d
agwatch summary --from 2026-04-01 --to 2026-04-20
agwatch summary --json

CLI Flags

Shared Time Range Flags

FlagValuesDescription
--rangetoday, 7d, 30d, monthPreset reporting range
--fromYYYY-MM-DDCustom start date for summary
--toYYYY-MM-DDCustom end date for summary

Summary Flags

FlagDescription
--jsonEmit structured JSON instead of text

Dashboard Flags

FlagDescription
--watchAuto-refresh usage data every 3 seconds
--provider-debugEnable provider debug logging in non-interactive contexts
--provider-startup-timeout-ms <ms>Timeout for background provider loading during startup
--provider-manual-timeout-ms <ms>Timeout for manual provider refresh actions
--provider-fallback <mode>Browser fallback policy: never, on_auth_error, on_any_error

Provider Runtime Defaults

OptionDefault
provider debugfalse
startup timeout25000 ms
manual timeout35000 ms
fallback modeon_auth_error

Dashboard Keybindings

KeyAction
qQuit
1-4Switch time period
Cycle periods
Switch agent tabs
uRefresh usage data
rRefresh pricing data
vRefresh provider usage
aRefresh all data
pOpen provider setup menu

Dashboard Panels

agwatch dashboard preview

PanelWhat it shows
OverviewTotal cost, calls, sessions, cache hit rate, and token totals
ProvidersProvider usage percentages, reset windows (5h, weekly, monthly when available), scrape source, and provider errors
By ProjectCost, tokens, and sessions grouped by project
By ModelCost, tokens, and calls grouped by model
By ActivityCost and calls grouped by inferred workflow type such as coding, debugging, or testing
Daily ActivityPer-day cost, tokens, and calls
Core ToolsTool usage frequency
Shell CommandsShell command frequency
MCP ServersMCP server usage frequency

Progress bars are relative to the highest row in each panel.

Configuration

Configuration is stored in:

~/.config/agwatch/config.json

On first run, agwatch creates this file automatically.

Example Config

{
"agents": [
{
"id": "opencode",
"label": "OpenCode",
"enabled": true,
"type": "sqlite",
"paths": [
"~/.local/share/opencode/opencode.db",
"~/.opencode/opencode.db",
"~/.config/opencode/opencode.db"
]
},
{
"id": "claude",
"label": "Claude Code",
"enabled": true,
"type": "jsonl",
"paths": [
"~/.claude/projects"
]
}
],
"providers": []
}

Agent Fields

FieldTypeDescription
idstringStable internal identifier
labelstringDisplay name used in tabs and UI
enabledbooleanWhether the agent is included in aggregation
typesqlite | json | jsonlLocal storage format
pathsstring[]Candidate paths to search for agent data

Provider Fields

FieldTypeDescription
idstringProvider identifier
labelstringDisplay name
enabledbooleanWhether provider scraping is enabled

Provider Setup

Provider configuration is handled from inside the dashboard.

  1. Open the dashboard.
  2. Press p to open the provider menu.
  3. Choose a supported provider.
  4. Authenticate in the browser flow.
  5. Return to the dashboard to view provider usage.

If browser automation dependencies are missing, agwatch prompts to install them during setup.

Provider Session Security

When you authenticate a provider, agwatch captures the browser session cookies needed to fetch your usage data and stores them locally so you are not prompted to log in on every run.

What is stored

Only authentication-relevant cookies are saved — session tokens, auth tokens, and httpOnly server-set cookies. Analytics, tracking, and other non-auth cookies are discarded before the file is written.

Encryption

Stored cookies are encrypted at rest using AES-256-GCM.

The encryption key is derived per-provider using HKDF-SHA256 keyed from a stable machine-bound identifier:

PlatformMachine identifier
WindowsHKLM\SOFTWARE\Microsoft\Cryptography\MachineGuid
macOSIOPlatformSerialNumber via ioreg
Linux/etc/machine-id or /var/lib/dbus/machine-id

This means a cookie file copied off your machine cannot be decrypted without the source machine's identifier.

File permissions

Cookie files are written with owner-only access:

PlatformEnforcement
macOS / Linuxchmod 0600 at write time
Windowsicacls removes inherited ACLs and grants full control only to the current user

Storage location

~/.config/agwatch/provider-cookies/<provider-id>.json

Expiry

Cookies with past expiry timestamps are filtered out automatically on every load. If all stored cookies for a provider have expired, the file is deleted and you are prompted to re-authenticate.

Linux note

On Linux, agwatch will display a security notice if libsecret is not installed. libsecret is required for OS-keychain-backed key storage via keytar. Without it, the machine-ID derivation described above is used as a fallback.

Install libsecret for your distribution:

DistributionCommand
Debian / Ubuntusudo apt-get install libsecret-1-dev
Red Hat / Fedora / CentOSsudo yum install libsecret-devel
Arch Linuxsudo pacman -S libsecret
Alpine Linuxsudo apk add libsecret-dev

Pricing

Model pricing is fetched from the LiteLLM pricing database and cached locally.

  • Source: https://raw.githubusercontent.com/BerriAI/litellm/main/model_prices_and_context_window.json
  • Cache file: ~/.config/agwatch/pricing-cache.json
  • Cache TTL: 24 hours

Behavior:

  1. agwatch uses cached prices when the cache is still fresh.
  2. It fetches fresh prices when the cache is stale.
  3. If fetching fails, it falls back to the last cached pricing.
  4. If no pricing is available, unknown costs resolve to $0.
  5. If a source record already contains a non-zero cost, that stored cost is used.

Summary Output

Text Output

The text summary includes:

  • Summary totals
  • Top models
  • Top projects
  • Daily activity
  • Activity breakdown

JSON Output

agwatch summary --json returns:

  • metadata
  • summary
  • panels.dailyActivity
  • panels.byProject
  • panels.byActivity
  • panels.byModel
  • panels.tools
  • panels.shellCommands
  • panels.mcpServers

Data Sources

agwatch reads local agent data and converts it into a shared usage event model.

OpenCode

Reads session, message, and tool-call data from local OpenCode storage.

  • SQLite is preferred when available
  • Fallback SQLite reading is supported
  • JSON-based fallback reading is supported

Claude Code

Reads local JSONL project logs from the Claude Code projects directory.

Architecture

Data Layer -> Domain Layer -> Aggregation Layer -> Presentation Layer
src/
cli/ command dispatch and argument parsing
adapters/ agent-specific readers for OpenCode and Claude Code
domain/ shared types and normalization
services/ loading, aggregation, pricing, and provider services
tui/ Ink-based dashboard UI
output/ text and JSON summary renderers
config/ config loading and time ranges
utils/ formatting, grouping, dates, and error handling

Tech Stack

  • TypeScript
  • Node.js
  • Ink
  • React
  • Commander
  • better-sqlite3
  • sql.js
  • dayjs
  • zod

Development

Install Dependencies

npm install

Build

npm run build

Watch Mode

npm run dev

Type Check

npm run typecheck

You can also run:

npm run lint

Run Locally

npm start
node dist/cli/index.js dashboard --range today
node dist/cli/index.js summary --range 7d

Notes

  • No test runner is configured yet.
  • The package exposes the agwatch binary from dist/cli/index.js.
  • Required Node.js version is 18+.

License

ISC

About

agwatch is a terminal analytics CLI for AI coding workflows. It reads local usage data from supported agents, normalizes it into a shared event model, and renders that data as an interactive dashboard or structured summary output.

Resources

Stars

0 stars

Watchers

0 watching

Forks

Releases

Packages

Contributors

Languages