

react-native-chart is a simple module for adding line charts, area charts, or bar charts to your React Native app.
NOTE! The current major version (1.X.Y) is still being developed. If you are looking for the most recent iOS-only version, please download ^0.1.4.
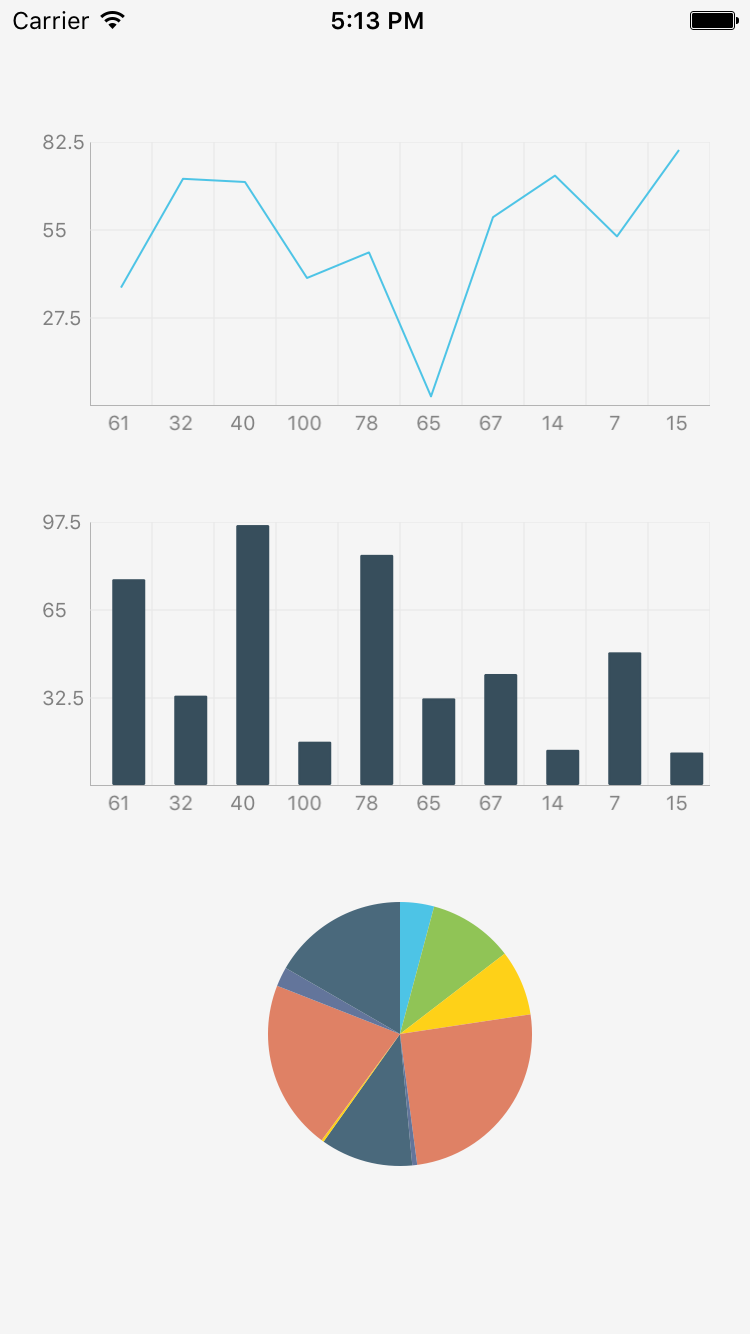

npm i react-native-chart --save
Link ART to your project
- Right click Libraries and click 'Add Files to {YourProject}'

- Navigate to your project's node_modules/react-native/Libraries/ART and select 'ART.xcodeproj'

- Go to Build Phases -> Link Binary With Libraries

4 Click the '+', and add libART.a

Then rebuild.
importReact,{StyleSheet,View,Component}from'react-native';importChartfrom'react-native-chart';conststyles=StyleSheet.create({container: {flex: 1,justifyContent: 'center',alignItems: 'center',backgroundColor: 'white',},chart: {width: 200,height: 200,},});constdata=[[0,1],[1,3],[3,7],[4,9],];classSimpleChartextendsComponent{render(){return(<Viewstyle={styles.container}><Chartstyle={styles.chart}data={data}verticalGridStep={5}type="line"showDataPoint={true}/></View>);}}| Property | Type | Description | Required | Default |
|---|---|---|---|---|
| data | Array< [number, number] > | An array of [x, y] pairs. | Yes | |
| type | string | pie/bar/line | Yes | bar |
| color | string | Color of bars/line in line chart | No | #4DC4E6 |
| cornerRadius | number | Corner radius of bars in bar chart | No | 0 |
| fillColor | string | Fill area color in line chart | No | |
| dataPointColor | string | Stroke color for line chart data point | No | |
| dataPointFillColor | string | Fill color for line chart data point | No | |
| dataPointRadius | number | Radius of the data point | No | 3 |
| lineWidth | number | Width of line chart line | No | 1 |
| showDataPoint | boolean | Show data points on line chart | No | false |
| sliceColors | Array < string > | Array of colors for pie chart slices | Yes | [ < random colors > ] |
| axisColor | string | Color of axis lines | No | #333333 |
| axisLabelColor | string | Color of axis test | No | #333333 |
| axisLineWidth | number | Width of axis lines | No | 1 |
| gridColor | string | Color of grid lines | No | #333333 |
| gridLineWidth | number | Width of grid lines | No | 0.5 |
| hideHorizontalGridLines | boolean | Hide grid lines going from LTR | No | false |
| hideVerticalGridLines | boolean | Hide grid lines going up -> down | No | false |
| showAxis | boolean | Show the X and Y axes | No | true |
| showGrid | boolean | Show the grid | No | true |
| showXAxisLabels | boolean | Show X-Axis labels | No | true |
| showYAxisLabels | boolean | Show Y-Axis labels | No | true |
| style | object | Style on the container | No | {} |
| tightBounds | boolean | Tighten min and max bounds strictly to min/max in dataset | No | false |
| verticalGridStep | number | How many vertical grid lines to show | No | 4 |
| horizontalGridStep | number | How many horizontal grid lines to show | No | all |
| xAxisHeight | number | Height of X-axis container | No | 20 |
| yAxisTransform | Function | Transform data point to y-axis label | No | (_) => _ |
| xAxisTransform | Function | Transform data point to x-axis label | No | (_) => _ |
| yAxisWidth | number | Width of the Y-axis container | No | 30 |
| yAxisUseDecimal | boolean | Show decimals on Y-axis labels | No | false |
- Code cleanup
- Multi-line chart
- Horizontal line chart
- Scatter chart
Work prior to repo transfer on Feb 1, 2015 was the work of Hyun Cho @ OneFold.
Email tom.auty@gmail.com for support.