Releases: LSYS/forestplot
Release list
v0.4.1
What's Changed
- Fix padding for data w/ 6 (or fewer) rows (resolves #52) by @LSYS in #117
- Thanks to @jeanbaptisteb for providing the fix! (see #52 (comment))
Full Changelog: v0.4.0...v0.4.1
Contributors
Assets2
Uh oh!
There was an error while loading. Please reload this page.
Mplot
What's Changed
Forestplot
forestplot is a Python package to make publication-ready but customizable coefficient plots.
- GitHub repo: https://github.com/LSYS/forestplot
- Docs: https://forestplot.readthedocs.io
To install via PyPI:
pip install forestplotQuickstart:
importforestplotasfpdf_mmodel=pd.read_csv("../examples/data/sleep-mmodel.csv").query(
"model=='all' | model=='young kids'"
)
fp.mforestplot(
dataframe=df_mmodel,
estimate="coef",
ll="ll",
hl="hl",
varlabel="label",
capitalize="capitalize",
model_col="model",
color_alt_rows=True,
groupvar="group",
table=True,
rightannote=["var", "group"],
right_annoteheaders=["Source", "Group"],
xlabel="Coefficient (95% CI)",
modellabels=["Have young kids", "Full sample"],
xticks=[-1200, -600, 0, 600],
mcolor=["#CC6677", "#4477AA"],
# Additional kwargs for customizations**{
"markersize": 30,
# override default vertical offset between models (0.0 to 1.0)"offset": 0.35, "xlinestyle": (0, (10, 5)), # long dash for x-reference line"xlinecolor": ".8", # gray color for x-reference line
},
)
Full Changelog: v0.3.3...v0.4.0
v0.3.3
What's Changed
- Add axis object as argument to forest plot by @juancq in #73
- Warn about duplicated
varlabel(closes #76, closes #81). - Add test that above warning works.
- Add known issues about duplicated
varlabel(closes #76, closes #81) and PyCharm (closes #80).
New Contributors
Forestplot
forestplot is a Python package to make publication-ready but customizable coefficient plots.
- GitHub repo: https://github.com/LSYS/forestplot
- Docs: https://forestplot.readthedocs.io
To install via PyPI:
pip install forestplotQuickstart:
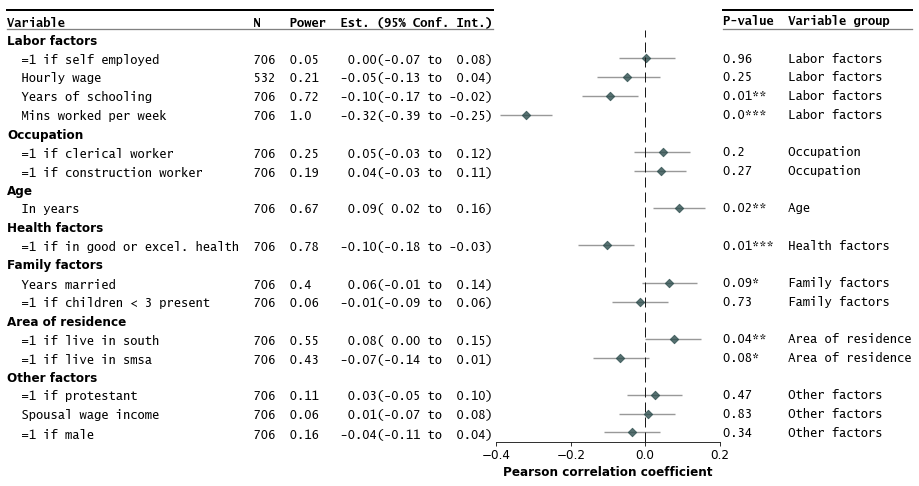
importforestplotasfpdf=fp.load_data("sleep") # companion example datafp.forestplot(df, # the dataframe with results dataestimate="r", # col containing estimated effect size ll="ll", hl="hl", # columns containing conf. int. lower and higher limitsvarlabel="label", # column containing variable labelylabel="Confidence interval", # y-label titlexlabel="Pearson correlation"# x-label title
)
Full Changelog: v0.3.2...v0.3.3
Contributors
Assets2
Uh oh!
There was an error while loading. Please reload this page.
v0.3.2
What's Changed
- Patch to fix bug for newer matplotlib versions (by @LSYS in #85).
- Thanks to @maikia for flagging and @Tian-hao for solution (#82).
- No user-facing changes.
Forestplot
forestplot is a Python package to make publication-ready but customizable coefficient plots.
- GitHub repo: https://github.com/LSYS/forestplot
- Docs: https://forestplot.readthedocs.io
To install via PyPI:
pip install forestplotQuickstart:
importforestplotasfpdf=fp.load_data("sleep") # companion example datafp.forestplot(df, # the dataframe with results dataestimate="r", # col containing estimated effect size ll="ll", hl="hl", # columns containing conf. int. lower and higher limitsvarlabel="label", # column containing variable labelylabel="Confidence interval", # y-label titlexlabel="Pearson correlation"# x-label title
)
Full Changelog: v0.2.2...v0.3.2
Contributors
Assets2
Uh oh!
There was an error while loading. Please reload this page.
v0.3.1
What's Changed
No user-facing changes.
Pandas append API in the backend is deprecated and so replaced by concat. This should accommodate newer versions of Pandas, like the recent v2.0 release.
Forestplot
forestplot is a Python package to make publication-ready but customizable coefficient plots.
- GitHub repo: https://github.com/LSYS/forestplot
- Docs: https://forestplot.readthedocs.io
To install via PyPI:
pip install forestplotQuickstart:
importforestplotasfpdf=fp.load_data("sleep") # companion example datafp.forestplot(df, # the dataframe with results dataestimate="r", # col containing estimated effect size ll="ll", hl="hl", # columns containing conf. int. lower and higher limitsvarlabel="label", # column containing variable labelylabel="Confidence interval", # y-label titlexlabel="Pearson correlation"# x-label title
)
Full Changelog: v0.2.2...v0.3.1
v0.3.0
What's Changed
Main user-facing change is that no drawing of CI (confidence intervals) is now possible.
- Allow no drawing of CI #58
- Update docs accordingly to reflect that
llandhloptions are no longer required
Forestplot
forestplot is a Python package to make publication-ready but customizable coefficient plots.
- GitHub repo: https://github.com/LSYS/forestplot
- Docs: https://forestplot.readthedocs.io
To install via PyPI:
pip install forestplotQuickstart:
importforestplotasfpdf=fp.load_data("sleep") # companion example datafp.forestplot(df, # the dataframe with results dataestimate="r", # col containing estimated effect size ll="ll", hl="hl", # columns containing conf. int. lower and higher limitsvarlabel="label", # column containing variable labelylabel="Confidence interval", # y-label titlexlabel="Pearson correlation"# x-label title
)
No CI:
fp.forestplot(df, # the dataframe with results dataestimate="r", # col containing estimated effect size varlabel="label", # column containing variable label
)
See the README for more customizations.
Full Changelog: v0.2.2...v0.3.0
v0.2.2
What's Changed
- Fix spacing issue at top of plot (fixes #48, #47)
- Create notebook for some simple regression tests (closes #49)
- Tidy imports using isort (closes #50)
- Allowed thresholds and symbols for p-values to be passedthrough (fixes #51)
- Fix different heigh and fontsize for confidence interval and p-value labels (fixes #53)
- Update docs for RTD (closes #54)
- Freeze matplotlib-inline dependency in setup.py (closes #56)
Forestplot
forestplot is a Python package to make publication-ready but customizable coefficient plots.
- GitHub repo: https://github.com/LSYS/forestplot
- Docs: https://forestplot.readthedocs.io
To install via PyPI:
pip install forestplotQuickstart:
importforestplotasfpdf=fp.load_data("sleep") # companion example datafp.forestplot(df, # the dataframe with results dataestimate="r", # col containing estimated effect size ll="ll", hl="hl", # columns containing conf. int. lower and higher limitsvarlabel="label", # column containing variable labelylabel="Confidence interval", # y-label titlexlabel="Pearson correlation"# x-label title
)
See the README for more customizations.
Full Changelog: v0.2.0...v0.2.2
v0.2.1
What's Changed
Remove excessive vertical whitespace
Add matplotlib-inline as requirement
Add note to save using bbox_inches="tight"
Add versioning
Add recipe to run readme-examples.ipynb notebook
Full Changelog: v0.2.0...v0.2.1
v0.2.0
What's Changed
- Create workflow to check links in readme.md by @LSYS in #14
- Patch by @LSYS in #16
- Update docs & fix group subheadings order by @LSYS in #20
- Add logscale option, make no string normalization the default by @LSYS in #34
- add wheel to build, include a requirements_dev.txt and document by @shapiromatron in #35
- Fix typo in readme by @shapiromatron in #31
- Better backend for Confidence Intervals (closes #29)
- Plotting of estimates on a log-scale (closes #28)
- Maintain label character formatting (making no string normalisation the default, closes #27)
tldr
- logscale is now an option
- default is now not to normalize strings
New Contributors
- @shapiromatron made their first contribution in #35
Full Changelog: v0.0.4...v0.2.0
Contributors
Assets2
Uh oh!
There was an error while loading. Please reload this page.
Release of Forestplot v0.1.0
forestplot is a Python package to make publication-ready but customizable forest plots.
- GitHub repo: https://github.com/LSYS/forestplot
- Docs: https://forestplot.readthedocs.io
To install via PyPI:
pip install forestplotQuickstart:
importforestplotasfpdf=fp.load_data("sleep") # companion example datafp.forestplot(df, # the dataframe with results dataestimate="r", # col containing estimated effect size ll="ll", hl="hl", # columns containing conf. int. lower and higher limitsvarlabel="label", # column containing variable labelylabel="Confidence interval", # y-label titlexlabel="Pearson correlation"# x-label title
)
More customizations are available, for example: